Sequencing metrics
Approximately 4 million raw reads from 94 multiplexed samples (roughly 46,605 ± 15,136 reads per sample) with an average length of 463 bases, and an average Q score of 35 were further filtered for quality. Reads 1 and 2 were merged at an average efficiency of 83%. High quality unmerged read 1 was also included in downstream analysis. All samples had a Good’s Coverage value exceeding 0.95, indicating that samples were sequenced to a level nearing saturation38. After rarefaction, 770,810 sequences were retained for the final analysis.
Weather
A dry period had been recorded prior to the commencement of sampling, with the most recent precipitation dating back to a 21 mm rain event on 8/20, 3 weeks prior to the first pre-rain sampling. The first rain event (Rain 1) on 9/12 recorded 9.14 mm of precipitation and the second event (Rain 2) on 9/21 reached 9.65 mm (Fig. 1). The highest daily temperature was recorded on 9/9 and a wind gust occurred on 9/13 around sampling time. Barometric pressure was low on 9/9 and 9/13 compared to the other sampling dates. Rain 1 was accompanied by thunder and lightning.
Cucumber carpoplane
Following the 9/12 rain event (Rain 1), a significant change in cucumber fruit surface bacterial community structure was observed for both unweighted UniFrac (R2 = 0.173, p = 0.001) and weighted UniFrac (R2 = 0.225, p = 0.005) analyses (Fig. 2A, Figure S1). Cucumber fruit samples collected 3 days prior to Rain 1 supported bacterial communities that clustered separately from those collected 1 day after Rain 1, and the largest average unweighted UniFrac distances were obtained between samples collected on 9/9–9/13 and 9/9–9/17 (Fig. 2B). Although some samples collected on 9/17 generated bacterial community profiles resembling the pre-rain profile, some resembled the immediate post-rain profile, a trend evident across 3 different distance metrics (Figure S1). Therefore, within 4 days a partial return to the pre-rain profile was detected.
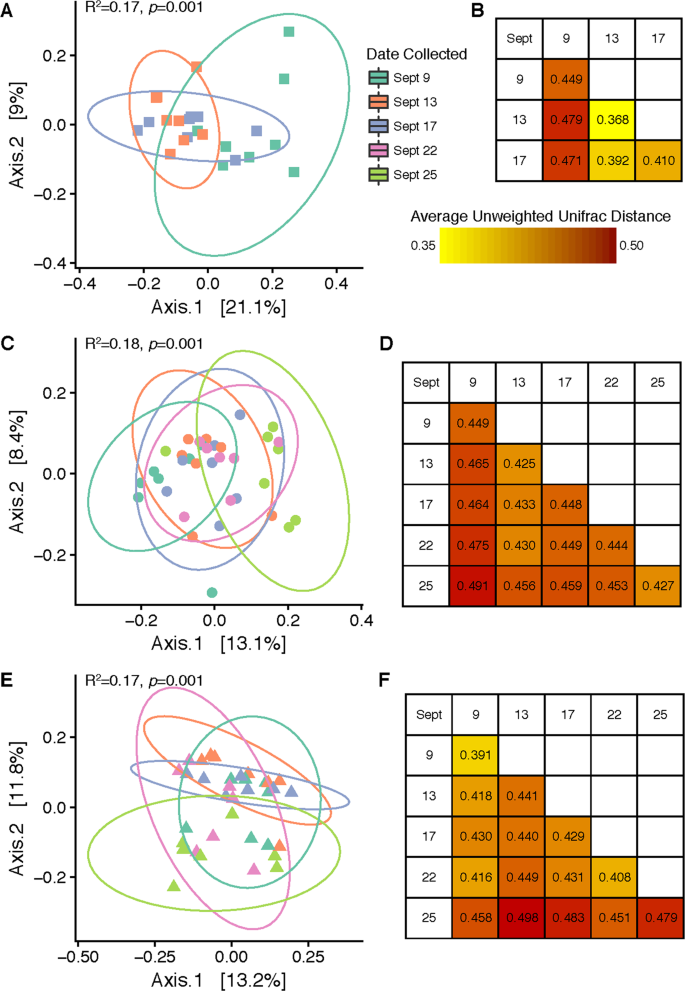
Influence of rain on cucumber and tomato-associated bacterial communities. Panels A, C and E show PCoA plots created from unweighted (including taxonomic identification but not relative abundance) UniFrac distance matrices comparing bacterial community β-diversity before, 1 day after, and 4–5 days after two rain events on the surfaces of Cucumber Fruit (A), Tomato Fruit (C) and Tomato Leaf (E). Panels B, D and F display the average unweighted UniFrac distances between sample groups collected on same or different days for each sample type (B = Cucumber Fruit, D = Tomato Fruit, F = Tomato Leaf).
On the cucumber carpoplane, α-diversity increased significantly following Rain 1, as measured by both Observed OTUs (p = 0.004) and Shannon Index (p = 0.002), escalating from an average of 232 ( ± 48) to 310 ( ± 21) OTUs per sample, a 33.6% increase (Fig. 1B). Five days after Rain 1, α-diversity remained elevated compared to pre-rain levels (p = 0.01 and p = 0.06 for Observed OTUs and Shannon Index, respectively), with an average of 300 ( ± 52) OTUs per cucumber. Many of these OTUs were introduced across all replicates, indicating a common source. A core microbiome analysis was conducted to identify taxa shared by 100% of samples collected on each date and across multiple dates. Thirty-eight OTUs were ubiquitous among all dates. Seventy-four OTUs not observed in pre-rain cucumber carpoplane samples were identified in samples collected 1 day post-rain (Fig. 3, Supplementary Table 1). Of these, 35 OTUs were retained across all replicates 4 days later. By contrast, only 7 OTUs observed in pre-rain samples were not detected 1 day post-rain, with 3 of these being observed again 5 days post-rain.
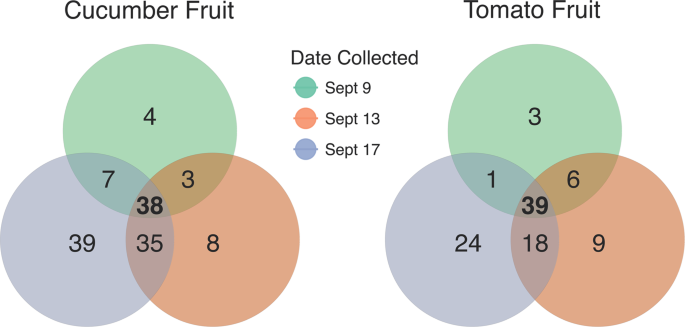
Bacterial OTUs associated with cucumber and tomato carpoplanes on 3 dates surrounding Rain 1. OTUs present in 100% of samples collected on 1, 2, or all 3 dates from 9/9 to 9/17 were tallied and represented in a Venn diagram. The list of ephemeral (present on only 1 or 2 dates) taxa summarized here can be found in Supplementary Table 1.
In addition to the introduction of new taxa, changes in the relative abundance of established taxa on the cucumber surface were observed following Rain 1 (Fig. 4). Of 809 total OTUs in the cucumber dataset, 112 were differentially abundant between samples collected on Sept 9 and 13 (pre- and post-rain). At the family level, 16 bacterial families differed between the pre- and post-rain timepoints. Notably, the family Xanthomonadaceae increased from an average of 1.2% to 9.6% relative abundance following rain (adjusted p < 0.001), dropping to 2.4% 5 days after rain. The Oxalobacteriaceae exhibited a similar increase, from 0.6% to 7.0% (adjusted p < 0.001), but in this case average relative abundance remained high after 4 days, at 7.1%. Similarly, the Sphingobacteriaceae and Comamonadaceae, initially detected at less than 0.2% average relative abundance, increased at least an order of magnitude in relative abundance following rainfall, remaining elevated 4 days later (adjusted p = 0.005 and p < 0.001, respectively). Relative abundance for several of the most dominant bacterial families on the cucumber surface declined or increased following rainfall. The Sphingomonadaceae decreased from an average of 9.6% to 5.1% relative abundance following rainfall (adjusted p = 0.001) but increased 4 days later to 7.6%. Similarly, the average relative abundance of the family Microbacteriaceae diminished following rainfall (from 15.6% to 8.6%, adjusted p = 0.003), increasing to an even higher average relative abundance later (17.9%). The Enterobacteriaceae demonstrated an opposite shift that was not significant (adjusted p = 0.323), increasing 1 day after rain from 18.4% to 21.9%, later returning to 17.2% average relative abundance (Fig. 4). Although these changes in relative abundance are indicative of community shifts, they do not necessarily translate to increases or decreases in the absolute abundance of certain taxa.
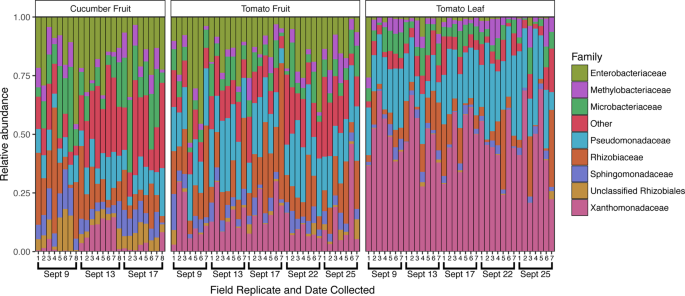
Family-level taxonomic profiles of all sample types across the study period. The top 8 most relatively abundant taxa are represented individually, with all other taxa grouped into the “Other” category, with all samples rarefied to 8,200 sequences. Sampling dates and replicate numbers for all sample types are marked: cucumber fruit (n = 8), tomato fruit (n = 7), and tomato leaf (n = 7).
Tomato carpoplane
Two rain events were followed in analysis of tomato bacterial communities. This may be the reason why β-diversity of the tomato carpoplane did not strictly parallel the same trend observed on cucumber fruit. There was an overall effect of sampling date on bacterial communities when analyzed using unweighted UniFrac distance (R2 = 0.177, p = 0.001; Fig. 2C) and Bray-Curtis dissimilarity (R2 = 0.186, p = 0.005) but not weighted UniFrac distance (R2 = 0.136, p = 0.225) (Figure S1). Throughout the sampling period, unweighted UniFrac distance increased steadily in comparison to the first pre-rain sampling date, with the greatest distance measured between samples collected on 9/9 (pre-rain) and 9/25 (post-Rain 2) (Fig. 2D).
On the other hand, following Rain 1, α-diversity on the tomato carpoplane resembled the dynamics seen on cucumbers. Observed OTU count increased from 185 ( ± 37) to 251 ( ± 28) OTUs per sample (p = 0.005) from 9/9 to 9/13 (Fig. 1B). Five days after Rain 1, α-diversity by both measures was indistinguishable from pre-rain and 1 day post-rain levels (p > 0.05), at 231 ( ± 35) OTUs per sample. Following Rain 2, observed OTU count remained elevated compared to pre-Rain 1 (p = 0.03 and p = 0.004 for 9/22 and 9/25, respectively) but did not significantly increase beyond 9/13 levels. Analysis of the same dates by Shannon Index suggests that across the sampling period, α-diversity was different only between 9/9 and 9/13 (p = 0.058). Following Rain 1, similar trends in the core microbiome as those on the cucumber carpoplane were observed on tomato fruit. For the 3 dates surrounding Rain 1, tomato fruit collected on each day supported OTUs common to all samples collected on that date but not observed on any other date, with 9/17 hosting the most unique core OTUs (Fig. 3, Supplementary Table 1). Moreover, 42 additional OTUs were present across all post-Rain 1 samples, of which 18 persisted in all samples 4 days later. Following Rain 2, only 17 new OTUs were detected on all tomato fruit samples, 7 of which remained present on all samples on the final sampling day.
Following Rain 1, the relative abundance of 44 OTUs changed significantly on the tomato fruit surface, including 10 members of the Enterobacteriaceae and 3 members of the Xanthomonadaceae, all of which increased in average relative abundance. There were no significant differences at the family level between 9/9 and 9/13, however there were significant differences in 6 low-abundance ( < 5%) bacterial families between 9/9 and 9/25. For example, relative abundance of the family Rhodobacteriaceae increased steadily over the study period (p = 0.006), from ~0.35% to 3.5%. The most abundant taxa tended to fluctuate throughout the study period irrespective of proximity to rainfall. On average, the Pseudomonadaceae increased in relative abundance from 9/9 (18.2%) to 9/13 (23.7%), decreased on 9/17 (16.9%), only to increase again after Rain 2 (23.4%) and decrease again by 9/25 (19.6%). The increase from 9/9 to 9/13 was not statistically supported, however the increase from 9/17 to 9/22 was statistically significant (adjusted p = 0.043). Relative abundance of the Oxalobacteriaceae also increased significantly following Rain 2, from 0.5% to 2.9% (adjusted p < 0.001), following a small borderline insignificant increase after Rain 1, from 9/9 (0.4%) to 9/13 (1.2%) (adjusted p = 0.081). This temporary post-rainfall increase in relative abundance of the Oxalobacteriaceae mirrored results seen on cucumber.
Tomato phylloplane
On tomato leaf surfaces, increases in α-diversity around rainfall were not discernible, with an average of 150 (±30) OTUs per sample. Though not significant, the pre-rain timepoint had the highest median number of OTUs per sample (Fig. 1B). A core microbiome of 27 OTUs was observed in all leaf samples. Twenty-one OTUs common to all pre-rain samples were not observed 1 day post-rain, and only 6 new OTU introductions common to all 1 day post-rain samples were detected. No OTUs were found to be common across all samples between 1 day and 4 days post-rain timepoints other than the core 27 common to all 3 dates, while 7 OTUs shared among all 4 days post-rain and pre-rain samples were recovered. On the other hand, shifts in β-diversity were detected across the full sampling period; timepoint significantly influenced bacterial community structure at a rarefaction level of 8,200 sequences per sample when analyzed with unweighted UniFrac distance (R2 = 0.175, p = 0.001) and Bray-Curtis dissimilarity (R2 = 0.195, p = 0.036). However, weighted UniFrac analysis did not reveal a significant effect (R2 = 0.106, p = 0.521) (Fig. 2E, Figure S1). No taxa shifted in relative abundance between the pre-rain and 1 day post-rain timepoints, but changes in the average relative abundance of some low-abundance families (<0.2%) were detected between the pre-rain timepoint and 4 days post Rain 2. The Unweighted UniFrac distances between averaged sample groups from each timepoint suggested a weak but consistent shift in community structure over the course of the sampling period, but also considerable variation within samples from the last timepoint (9/25) (Fig. 2F).
Cucumber versus tomato fruit
Cucumber fruit surfaces yielded a higher number of bacterial OTUs, 281 (±54), compared to tomato fruit surfaces, 232 (±40) (p < 0.001, Fig. 1B). Similarly, bacterial community structure differed significantly between the 2 fruit types (R2 = 0.246, p = 0.001) (Fig. 1C). Several of the most dominant taxa differed in average relative abundance between cucumber and tomato fruit surfaces, including Pseudomonadaceae (10.1% on cucumber, 19.6% on tomato, adjusted p < 0.001), Xanthomonadaceae (4.4% on cucumber, 15.5% on tomato, adjusted p < 0.001), Methylobacteriaceae (5.4% on cucumber, 3.5% on tomato, adjusted p = 0.038), and Microbacteriaceae (14.0% on cucumber, 6.7% on tomato, adjusted p < 0.001). Enterococcaceae were higher in average relative abundance on cucumber compared to tomato fruit (0.01% on cucumber, 0.002% on tomato, adjusted p = 0.003). Taxa of the Rhizobiaceae family were prevalent on both tomato (18.5%) and cucumber (13.7%) fruit surfaces and were not significantly different (adjusted p = 0.200). Similarly, members of the Enterobacteriaceae were dominant on both tomato (18.2%) and cucumber (19.2%) fruit surfaces (adjusted p = 0.932). (Fig. 4).
Presumptive E. coli
In order to more directly address the food safety implications of potential bacterial community changes in response to rainfall, samples were screened for presumptive generic E. coli, frequently used as an indicator of fecal contamination. In total, tomato leaf samples had significantly higher levels of presumptive E. coli compared to tomato and cucumber fruit samples (p < 0.001; Fig. 5). No significant differences were observed between sampling dates for any sample type, although presumptive E. coli counts and variability in the data increased in all samples following Rain 1 and the highest individual values within each sample type were observed on 9/13, the day following the first rain event (Fig. 5).
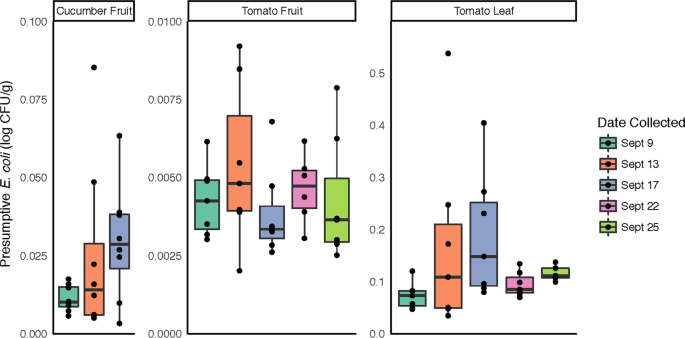
Presumptive E. coli recovery from cucumber and tomato surfaces. For each sampling date, serial dilutions from surface washes of the 3 sample types were dispensed onto selective media for quantification of colonies with morphology typical of generic E. coli.
Source: Ecology - nature.com