Data
Air quality data
The air quality data comprises a high-frequency dataset covering seven major sets of air pollutants. We obtained these data from the Ministry of Ecology and Environment34. The original dataset includes hourly readings of the AQI, PM2.5, PM10, SO2, O3, NO2 and CO concentrations from 1,605 air quality monitoring stations covering all of the prefectural cities in China. The AQI is a comprehensive measure of air pollution: the index is constructed using PM2.5, PM10, SO2, CO, O3 and NO2 concentrations, with a lower AQI meaning better air quality. In China, the AQI is determined by the maximum concentration of different air pollutants. We summarize the relationship between the AQI and each pollutant in Supplementary Table 1.
To create the city-level air quality data, we first calculated the distance from a city’s population centre to all monitoring stations within the corresponding city. We then aggregated station-level air pollution data to city-level data using the inverse distance weights. For this process, stations closer to the population centre are given higher weights so that city-level air pollution data can better represent the people dwelling in each city. The weights are inversely proportional to square distance.
Weather data
Weather data included temperature, precipitation and snow. These data were obtained from the Global Historical Climatology Network (GHCN) from the National Oceanic and Atmospheric Administration (NOAA)35. We collapsed these data to a daily city-level dataset using the same methods used for the air quality data.
Lockdown
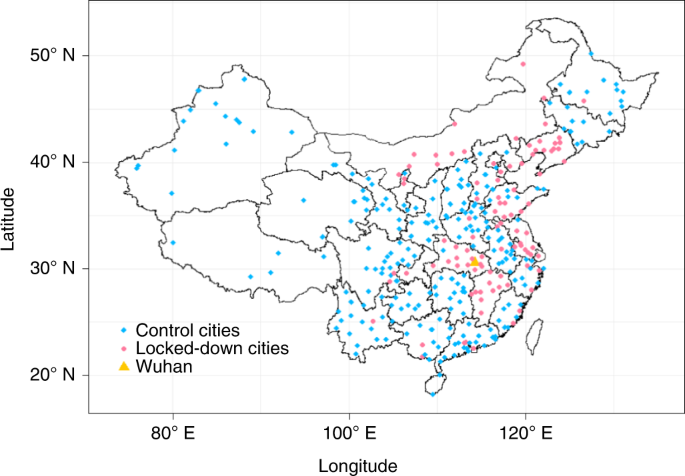
We collected local governments’ lockdown information city by city from the ‘COVID-19 pandemic lockdown in Hubei’ Wikipedia page36 and various other news media and government announcements. Most of the cities’ lockdown policies were directly issued by the city-level governments, although a few were promulgated by the provincial governments. To ensure compliance, civil servants and volunteers were assigned to communities, firms, business centres and traffic checkpoints. Local governments also penalized offenders if the rules were violated. There were some variations in rules and degree of the lockdown. For example, in some cities, individuals were not allowed to go out (food and daily necessities were delivered to them), while in other cities, they could go out if they did not have a fever. In this paper, we designated a city as locked down when the following three measures were all enforced: (1) prohibition of unnecessary commercial activities for people’s daily lives, (2) prohibition of any type of gathering by residents, (3) restrictions on private (vehicles) and public transportation. Their geographical distributions and timings are presented in Figs. 1 and 2 and Supplementary Table 2.
Socio-economic status
To explore the heterogeneity, we assembled the cities’ socio-economic status from the 2017 China City Statistical Yearbook37. It contains city-level statistics such as GDP, population, industrial output, number of firms, amount of traffic and pollutant emissions.
Summary statistics
We report the summary statistics of air pollution and weather variables during this period in Supplementary Table 3. The average AQI was 74, with a standard deviation of 42. The average PM2.5 concentration was 52 µg m−3, five times higher than the WHO standard (10 µg m−3 for annual mean, and 25 µg m−3 for a daily mean). Cities that were locked down were, on average, more polluted than the control cities before the lockdowns. This is probably because Wuhan and its neighbouring cities are generally more polluted than cities that are far away. We also saw a sharp decline in AQI and PM2.5 concentrations after the lockdown.
Models
We used two sets of DiD models to identify the impact of counter-COVID-19 measures on air pollution. First, in our baseline regression, we estimated the relative change in air pollution levels between the treated and control cities using the following model:
$$begin{array}{*{20}{c}} {Y_{it} = 1left[ {{{rm{city}},{rm{lockdown}}}} right]_{it} times beta + {bf{X}}_{it} times {bf alpha} + it mu _i + pi _t + varepsilon _{it}} end{array}$$
(1)
where Yit represents the level of air pollution in city i on date t. 1[city lockdown]it denotes whether a lockdown is enforced in city i on date t, and takes the value 1 if the city is locked down and 0 otherwise. Xit are the control variables, including temperature, temperature squared, precipitation and snow depth. μi indicate city fixed effects and πt indicate date fixed effects.
The city fixed effects, μi, which are a set of city-specific dummy variables, can control for time-invariant confounders specific to each city. For example, the city’s geographical conditions, short-term industrial and economic structure, income and natural endowment can be controlled by introducing the city fixed effects. The date fixed effects, πt, are a set of dummy variables that account for shocks that are common to all cities in a given day, such as the nationwide holiday policies, macroeconomic conditions and the national air pollution trend over time.
As both location and time fixed effects are included in the regression, the coefficient β estimates the difference in air pollution between the treatment (locked down) cities and the control cities before and after the enforcement of the lockdown policy. We expected β to be negative, as industrial and business activities were restricted in the locked-down cities, and thus their air pollution levels should greatly decrease.
Because some of the treated cities and the control cities are closely located, the reduction in the air quality in the treatment cities could affect air quality in other cities, creating a potential spillover effect. In our research setting, accounting for this spillover effect is challenging because the spillover not only depends on the timings of lockdown policies and the geographical distribution of treatment and control cities, but also depends on wind directions in different cities. So, strictly speaking, β measures the relative effect of the city lockdown on air pollution between the two groups of cities, rather than the absolute impact. In an attempt to test for the size of the spillover effect, we compared the treatment cities with a set of ‘clean’ control cities, which are those cities (1) without lockdown policies and (2) not neighbouring any lockdown cities. The underlying assumption of this test is that cities neighbouring the lockdown cities are most likely to be affected by the spillover effect (so they should be excluded from the analysis). As reported in Supplementary Table 8b, we obtained quantitatively similar results using this subsample. We thus concluded that the spillover effect does not bias our estimates in any substantial way.
The underlying assumption for the DiD estimator is that lockdown and control cities would have parallel trends in air quality in the absence of the event. Even if the results show that air quality improves in the locked-down city after its enforcement, the results may not be driven by the lockdown policy, but by systematic differences in treatment and control cities. For example, if treatment cities have an improving trend in air quality, this could drive the results. This assumption is untestable because we cannot observe the counterfactual: what would happen to the air pollution levels in the locked-down cities if such policies were not enforced. Nevertheless, we can still examine the trends in air quality for both groups before lockdown implementation and investigate whether the two groups are indeed comparable. To do so, we conducted the event study and fitted the following equation12:
$$begin{array}{*{20}{c}} {Y_{it} = mathop {sum }limits_{m = k,m ne – 1}^M 1left[ {{{rm{city}},{rm{lockdown}}}} right]_{it,k} times beta ^k + {bf{X}}_{it it} times bf{alpha} + it mu _i + pi _t + varepsilon _{it}} end{array}$$
(2)
where 1[city lockdown]it,k are a set of dummy variables indicating the treatment status at different periods. Here, we put 7 days (one week) into one bin (({mathrm{bin}},m in M)), so that the trend test is not affected by the high volatility of the daily air pollution. The dummy for m = −1 is omitted in equation (2) so that the post-lockdown effects are relative to the period immediately before the launch of the policy. The parameter of interest βk estimates the effect of city lockdown m weeks after the implementation. We included leads of the treatment dummy in the equation, testing whether the treatment affects the air pollution levels before the launch of the policy. Intuitively, the coefficient βk measures the difference in air quality between cities under lockdown and otherwise in period k relative to the difference one week before the lockdown. We expected that lockdown would improve air quality with βk being negative when k ≥ 0. If the pre-treatment trends are parallel, βk would be close to zero when k ≤ −2.
Even in a city that did not have a formal lockdown policy, people’s daily lives could still have been affected by the counter-virus measures. In fact, in all Chinese cities, the Spring Festival holiday was extended, and people were advised to stay at home when possible, enforce social distancing and maintain good hygiene. We examined this possibility by comparing the air pollution changes between 2019 and 2020 for the same period within the control group. As the explosion of the COVID-19 cases coincided with China’s Spring Festival (SF), we investigated whether the trend of air quality in 2020 differed from the trend in 2019 after the festival, by fitting the following model:
$$begin{array}{*{20}{c}} {Y_{itj} = 1left[ {{rm{SF}} times 1left( {{rm{year}} ge 2020} right)} right]_{itj} times beta + {bf{X}}_{it itj} times {bf{alpha}} +it mu _i + pi _t + gamma _j + varepsilon _{itj}} end{array}$$
(3)
where j represents year. (1left[ {{rm{SF}} times 1left( {{rm{year}} ge 2020} right)} right]_{itj}) is our variable of interest, and it takes the value 1 if it is after the start of the Chinese Spring Festival in the year 2020, and 0 otherwise. Because the national government announced that “the virus can transmit from people to people” on the 20 January, and the extension of the national holiday was announced on the 26 January, we think that the normal cities were affected by the virus and launched the containment actions from the beginning of the national holiday. The value of β would be 0 if the coronavirus and countermeasures do not affect control cities.
The identifying assumption for equation (3) is similar to equation (1). For the parallel trend assumption to be reasonable, the trends in air quality before the Spring Festival in 2019 are required to be similar to the trends in air quality in the corresponding period in 2020. We can investigate patterns in air pollution around the holiday analogously using equation (2). In all the regressions, we clustered the standard errors at the city level.
Combining the results from the two DiD models, we were able to evaluate the overall impact of city lockdowns. Our first DiD measures how the city lockdown improves air quality relative to non-locked down cities in 2020 (equation (1)), and the second DiD assesses how national-level disease preventive measures (for example, all cities extended the Spring Festival holiday, required social distancing and urged people to stay at home) affect non-locked-down cities relative to the same season in previous years (equation (3)). Therefore, summing up the two DiD estimates (equation (1) and equation (3)), we could infer the overall impacts of city lockdowns on air quality.
Reporting Summary
Further information on research design is available in the Nature Research Reporting Summary linked to this article.
Source: Ecology - nature.com

