There is a clear and systematic difference in peat OM content and stoichiometry in organic soils between the four studied land use types in Switzerland. We presume that differences in OM content among land use types, as found here, mostly reflect drainage and land use effects, and are the result of long-lasting decomposition. Yet, it must be considered that land use is not evenly distributed across the landscape, with sites chosen in part depending on their climatic or topographic suitability, and that this might be linked to initial peat conditions. This was addressed by using a nested ANOVA approach and, where possible, a comparison of paired sites. The latter confirmed that land use exerts direct control on SOC, OM content, and C/N; and that these differences cannot be explained solely by preferential selection of sites for particular land use.
Soil OM concentration gradients are used here to exemplify how stoichiometry changes with peat degradation, as no real time-series is available. Although the initial OM content is not known and may vary between sites, we presume that samples containing >95% OM contents are representative of an undisturbed situation. Relative to this sample set (>95% OM, n = 325, of which 225 = FL, 57 = NL, 43 = GL, 0 = CL), the other peat samples contained on average 5.0 ± 0.5 (NL), 11.3 ± 1.3 (FL), 34.8 ± 1.4 (GL) and 40.0 ± 1.9 (CL) % less OM. Lower OM contents in more intensively managed and more deeply drained soils (CL and GL in our case), are in line with the order of CO2 flux measurements over drained peatlands under different land use17. The reported differences in OM contents are upper-end approximations, as peat layers of some sites (particularly fens) may have had OM contents lower than 95% in their pristine state. On the other hand, for some organic soils, losses might have been even greater: While this study examined only existing organic soils, (near-) complete losses of OM results in classification as a mineral soil (organic horizon less than 10 cm thick or with less than 20–30% OM depending on clay content and water saturation); which, in Switzerland, may extend over larger areas than still-existing peatlands25.
The Cox integrates the stoichiometry into a single number. Across all samples, Cox is more negative (i.e., C is more reduced) compared to that of to various plant litter types27, most likely as a consequence of anaerobic decomposition during peat formation. Accordingly, i) OM from intact peatlands show the lowest Cox; and ii) Cox values tend to be more negative in subsoils, in agreement with other studies21,28. Elemental data were also converted to oxidative ratios (ORs), which are linearly and inversely related to Cox. Comparison with two further studies that report OR values for peatlands suggests that the peat described in this study is similar in terms of oxidation to peat reported elsewhere, but is much more variable. A study from Moor House, a blanket bog in northern England comprising different management practices, reported a range of OR values of 0.92–1.08 for 60 samples from the bog, and a greater range of 0.92–1.11 (median for Histosols 1.03) when literature values were included28. A study of 300 Canadian peatlands21 reported OR values of 1.00–1.18. Our OR values (median 1.07, range 0.81–1.43) encompass the OR values from these two studies and span a wider range, possibly because our sites represent a broader range of peatland ecosystems, and in contrast to the sites from21, also include drained and fertilised sites. The C in the peat samples from the current study is, on average, slightly less oxidized than that of Worrall, et al.28. This difference might be related to the type of peat sampled. Particularly, our analysis encompassed more strongly reduced peat from deeper layers (max. 2 m), whereas peat samples collected in28 were obtained only to 30 cm depth. Furthermore, because of ongoing subsidence of drained peatlands, a contemporary sampling depth of, for example, 1 m, may represent a soil layer at a depth of 3 m before drainage onset29, exposing older peat which is more aromatic and, consequently, has a higher OR, to the surface30.
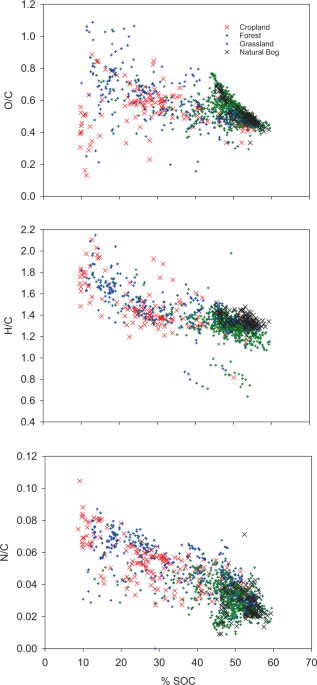
Molar ratios of H, O, and N to C were higher for samples containing little SOC, suggesting a greater number of functional groups and, in case of H/C and N/C, a greater microbial imprint. There were a few samples with H/C ratios of <1 (Fig. 1). Inspection of these data revealed that they belong to six different sites, representing three land use types. In a data set from Ontario, Canada21, measured H/C ratios as low as 0.7 in their (peat accumulating) peatlands. We therefore presume that these ‘outliers’ may represent background variability. Elements H and particularly N were enriched in samples containing less OM in our study. The observed significant shift in stoichiometry along SOC and OM concentration gradients suggests that the molecular composition of degrading peat is systematically altered towards a higher share of N and H-containing moieties with ongoing decomposition. Importantly, we see this trend not only for the bulk data set, but also when forest and natural sites, that do not receive N fertilization, are studied separately (see running averages for C/N ratios in Fig. 2, and data in Supplementary Table S2). Hence, the enrichment of N over C with declining OM content cannot be attributed solely to N fertilization, but is also caused by a faster loss of C relative to N when peat degrades. A relative enrichment of N over C, or, in other words, a greater loss of C than N, has been reported for the top layers of extensively used, unfertilized drained grasslands elsewhere13,16. Also, these studies indicated that the process of peat decomposition itself, without further N input, reduces C/N ratios substantially. At the same time, declining C/N ratios are also caused by N fertilization in agricultural soils, particularly when cropped. Consequently, C/N ratios were the smallest in topsoils under agriculture (Table 2) and similar to C/N ratios found in drained fens in North Germany31.
Different land uses resulted in significant differences in OM stoichiometry in both top- and subsoil (Table 2). However, effects were less pronounced in subsoil. For all of the measured parameters, differences between maximum and minimum values were smaller in subsoils than in the upper 30 cm, indicating that land use change alters chemical peat composition more in upper, typically permanently drained layers. Comparison of H/C ratios of peat from this study with values from peatlands around the world21 illustrates this: Whereas the H/C ratios of deeper peat (>0.3 m) in this study are within the range of that reported from Canadian, UK and Latvian peatlands, the H/C ratios from shallower peat of CL and GL sites (from this study) are outside of the range reported for these other peats. Such high H/C ratios indicate high lipid content32, possibly related to increased microbial residues indicating high microbial transformation of peat. Additionally, soil C/N ratios were smaller in topsoils of managed systems, suggesting higher N input and/or advanced microbial transformation of the peat33. Notably, this result was reversed for the natural sites. Here, in accordance with other natural mire profiles6,11, a smaller C/N ratio in subsoil is maintained. Taken together, a reversed trend of C/N ratios with depth, as found for CL, GL, and FL, might be indicative of advanced peat decomposition in organic soils.
Net N release from mineral soil is expected to depend on the soil’s C/N ratio. For mineral soils, a high C/N ratio is associated with lower N release, whereas at ratios below 15, N release increases exponentially5. Mechanistically, the negative relationship between soil C/N and N release is explained by the difference in stoichiometry of the decomposing microbial biomass vs. the nutrient-poor plant litter material. With continuing microbial transformation, soil’s C/N ratio declines, approaching values of 10 and below34. A non-linear relationship has been also reported for the dependency of N2O emissions on C/N in organic soil: at C/N ratios of below 15, N2O emissions tend to increase sharply35,36,37. These studies indicate that even strongly degraded and managed organic soils bear the risk of high N losses, in line with constantly high OM mineralization rates also found in strongly degraded peat38,39. Our sites represent different stages of soil degradation, and as such indicate that with ongoing OM loss, N-release rates increase in conjunction with a decline in soil C/N. This occurs in spite of an accumulation of N relative to the other elements. Figure 2 and Table S1 indicate that the smaller the C/N ratio becomes, the more C and N are lost in tandem. The C/N ratios change only little (CL, GL) or or almost not at all (FL, NL) below 75% OM. At higher OM contents, N seems mostly retained within the soil system. Data in Table 2 allow an estimate of the gross N mobilization in organic soil. With an annual C loss rate of 8 t ha−1, a value typical for drained and intensively managed temperate peatlands17, topsoil of a cropland with an average C/N ratio of 14.5 may annually release c. 550 kg N ha−1, a magnitude in line with experimental evidence40. Although this calculation is only a rough estimate, it stresses that more attention should be paid to the N cycle and N loss in degrading peatlands.
Set into a wider geographical context, our peat samples contained less C and considerably more N, resulting in a different distribution of C/N ratios compared to the northern hemisphere data set of7. As discussed above, the relative enrichment of N over other elements in degrading peat as caused by the different stoichiometry of plant material and decomposer organisms may be one reason for this, considering that the sites in7 are mostly unmanaged and, hence, accumulate peat. In addition, intensively managed organic soils are fertilized and prone to substantial atmospheric N deposition. In the Swiss Central Plateau, where most of the studied cropland and grassland sites are situated, annual N deposition can reach 30–40 kg N ha−1, and even in peatland ecosystems and forests, N deposition records in Switzerland are 10–20 kg N ha−1a−1 and up to 50 kg N ha−1a−1 in single fens41. Nitrogen input into peatlands, particularly bogs, alters vegetation communities, increases peat mineralization, and impairs CO2 uptake42,43,44. Thus, with ongoing peat decomposition, the observed relative accrual of soil N and the postulated increase in N release may induce a positive feedback mechanism, where peat communities altered by N deposition are subjected to accelerated decomposition processes, thereby mineralizing more C and further exacerbating declining C/N ratios. Notably, C/N ratios in7 also exceeded our measurements for samples with >50% SOC. These C-rich samples were mostly from natural and forest sites, suggesting that external N input may also play a relevant role when peatlands are not managed.
Source: Ecology - nature.com
