Electrolysis ecological floating bed design and eutrophic water
In this research, the EEFBs and the traditional EFBs both had the same surface area of 1,089 m2 and were designed to compare their removal efficiencies in eutrophic waters under similar conditions. The EEFBs were made of polystyrene board 33 cm wide × 33 cm long × 5.5 cm thick. A 15 cm diameter planting hole was at the center of the board. Two nylon bags of biochar substrates were hung on the two sides of the 15-cm inner square frame (15 cm wide) of the EEFBs (Fig. 8). Each bag of the biochar substrates weighed 1.2 kilograms. The biochar had a diameter ranging from 1 mm to 3 mm and was made from bamboo poles (Phyllostachys heterocycla (Carr.) Mitford cv. Pubescens), which were fired under a controlled oxygen condition for three days, then fired at 800 °C for 48 h, and then allowed to cool naturally to ambient temperature. Before use, biochar was immersed in 1 mol L−1 hydrochloric acid for two hours then rinsed with deionized water until neutral. Later, they were dried before use. The anodes and cathodes were both set in the middle of the bag. The anodes were the Mg-Al alloy with an atomic percentage of 72.52% Mg. The cathodes were graphite. Each anode and cathode was 250 mm long, 150 mm wide, and 0.2 mm thick. A 5% hydrochloric acid was used to activate the electrodes for 15 mins before use; They were then rinsed with deionized water. The distance between cathodes and anodes was 120 mm. The effective working area of the electrodes was 135.41 cm2. The electrodes were connected using copper wires with a diameter of 1 mm to a Model KXN-3020D DC regulated power supply (Zhaoxin Electronic Instruments and Equipment Co., Ltd., Shenzhen, China) with a voltage ranging between 0 V and 30 V and an amperage between 0 A and 5 A. This provided a constant current for electrolysis with a current density of 0.37 mA cm−2. The I. sibirica seedlings were cultivated for 10 days prior to the experiment with a similar height of 30.7 cm and fresh weight of about 5.54 g. These ornamental macrophytes were planted in the hole of the EEFBs and the EFBs.
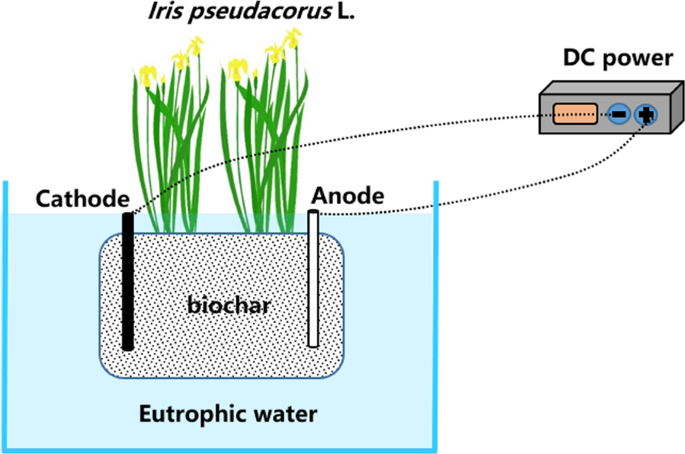
Schematic diagram of electrolysis-ecological floating bed (EEFB).
The EEFBs and the EFBs were both placed in a polyethylene plastic box with a total volume of 100 L. The box with only the experimental eutrophic water served as the control. With eutrophic waters of 60 L taken from a river near Nanjing city, the concentrations of TN, NH3-N, NO3−-N, NO2−-N, TP, PO43−-P, COD in the experimental water were 6.78 ± 0.2 mg L−1, 4.72 ± 0.17 mg L−1, 1.26 ± 0.02 mg L−1, 0.09 ± 0.01 mg L−1, 0.48 ± 0.03 mg L−1, 0.43 ± 0.01 mg L−1 and 48 ± 7 mg L−1, respectively. The parameters of DO, ORP (oxidation reduction potential) and pH were 6.44 ± 0.14 mg L−1, 122.9 ± 4.2 mV and 8.03 ± 0.03, respectively. During the experiment, three replicates wastewater samples were collected every 24 hours to determine nutrient values and physical and chemical indicators of water quality. The experimental apparatuses were maintained within a temperature range of 25 °C and 30°C. During the period of the experiment, the water loss from evaporation and transpiration was supplied by adding deionized water to the original level every two or three days.
Sampling of water, biochar substrate, and plants
Water samples were collected from the reactor every 24 hours to determine the physical and chemical indicators of water quality. The pH value, temperature, ORP values and turbidity, total dissolved solids (TDS), and salinity were immediately measured using a multi-parameter water quality YSI ProPlus (YSI Inc., Yellow Springs, OH, USA) at a depth of 0.5 m beneath the water surface. pH and DO were immediately measured by a portable Hach HQ30d multi-parameter analyzer, a PHC101-30 pH electrode, and a LDO101-03 DO electrode (all from Hach Company, Loveland, CO, USA). NO3−-N (dihydrochloride), NO2−-N (N-(1-naphthyl) ethylenediamine dihydrochloride), NH3-N (natrium reagent), TN (alkaline potassium persulfate digestion) and PO43−-P (ascorbic acid method) were measured using an ultraviolet and visible (UV-Vis) V1800 spectrophotometer (Shimadzu Corp., Kyoto, Japan) after the corresponding standard pretreatment and reagent addition were completed. All the testing procedures were according to Standard Methods for the Examination of Water and Wastewater by the Ministry of Ecology and Environment of the People’s Republic of China40.
To quantify the I. sibirica growth in the EEFBs and the EFBs, three plants of similar height and weight were compared to the seedlings planted in the floating beds and tested when the experiment was initiated. After washing with deionized water and drying with absorbent paper, the plants were weighed on an electronic scale to determine their total fresh weight, plant height, root length and branch number and AGR41. At the end of the experiment, the plants in the EEFBs and the EFBs were collected, and the same parameters were recorded using the same methods.
Characterization of the microbial community and diversity analysis
The bacterial community was examined in the biofilm on biochar of the EEFBs and the EFBs, using DNA-based molecular techniques. About 250 g of biochar were taken from each floating bed when the experiment was ended. At that time, phosphate buffer saline (PBS) solution (containing 9.3 g L−1 of K2HPO4 and 1.8 g L−1 KH2PO4) was added and washed into the liquid at 50 kHz for 30 mins; then, the washed liquid was centrifuged at 1200 rpm for 2 mins, and the precipitation was extracted according to the instructions of OMEGA E.Z.N.ATM-Bind Soil DNA Kit. High-throughput gene sequencing was used to identify and estimate changes in the relative abundances of bacteria.
DNA concentration and purity were determined by a NanoDrop ND-1000 microspectrophotometer (NanoDrop Technologies, Wilmington, DE, USA). Three replicate DNA extractions were combined into one sample for Illumina high-throughput sequencing (HTS) after genomic DNA was extracted. HTS was performed externally (by Sangon Biotech, Shanghai, China) using standard protocols on a MiSeq platform (Illumina, Inc., San Diego, CA, USA). The resulting sequencing data were processed using QIIME v 1.8.142. Archaeal, bacterial, and eukaryotic reads were distinguished based on differences in their PCR primers and then analyzed separately. The reads were then clustered into operational OTUs based on 97% similarity with UCLUST43. Representative sequences from each OTU were assigned a taxonomy using an RDP Classifier44, with a minimum support threshold of 80%, and aligned using the Greengenes reference database (version 13_8)45 by PyNAST42. Raw sequence data (FASTQ files) generated for this study have been deposited in NCBI’s Sequence Read Archive under BioProject number 16S190230. Microbial diversity was measured by analyzing the alpha and beta diversities, as determined using the QIIME pipeline and based on the OTUs. For alpha diversity, Chao1 richness and the Shannon and Simpson diversity indices were calculated using QIIME45.
Data analysis
All data analyses were performed in triplicate, and the data were expressed as mean ± standard errors. To evaluate the removal performance of the EEFBs, the removal efficiency (L, mg m−2), net removal rate (Rn, %), energy consumption (W, k·Wh g−1), and AGR (mg d−1) of plants were analyzed, according to the following formulas.
$${rm{L}}=({{rm{C}}}_{0}{{rm{V}}}_{0}-{{rm{C}}}_{{rm{i}}}{{rm{V}}}_{{rm{i}}})/{rm{A}}$$
(1)
$${{rm{R}}}_{{rm{n}}}={{rm{R}}}_{{rm{t}}}mbox{–}{{rm{R}}}_{{rm{c}}}$$
(2)
$${{rm{W}}}_{{rm{i}}}=({rm{UIt}}times 1000)/({{rm{C}}}_{{rm{t}}}-{{rm{C}}}_{0}){rm{V}}$$
(3)
$${rm{AGR}}=({{rm{W}}}_{1}-{{rm{W}}}_{2})/({{rm{t}}}_{2}-{{rm{t}}}_{1})$$
(4)
where L (%) represents the removal efficiency of different pollutants; C0 (mg L−1) represents the initial concentration of pollutants; V0 (L) represents the volume of eutrophic water; Ci and Vi refer to the pollutant concentration (mg L−1), and the water volume (L) was measured in day i. A (m2) is the area of each floating bed; Rn (%) represents the net removal rate of each treatment; Rt (%) represents the total ultimate average removal rate in each treatment; Rc (%) represents the average removal rate of the control; Wi (k·Wh g−1) represents the energy consumption of the electrolysis reaction in the EEFBs; U (V) represents the voltage between electrodes; I (mA) represents the current passing through the electrodes; C0 (mg L−1) represents the initial concentration of pollutants, Ct (mg L−1) is the concentration of pollutants in day i, V (L) is the volume of eutrophic water in each treatment; t (d) represents the reaction time; W1 (mg) and W2 (mg) refer to the initial and final fresh weights of the plants, respectively; and t1 (d) and t2 (d) represent the initial and final experimental time (days), respectively.
The concentrations (mg L−1) of N and P, removal rate (%), the removal efficiency (L, mg m−2) and energy consumption (W, k·Wh g−1) in the EEFBs, the EFBs and control group were performed with SPSS 23.0 (SPSS Inc., Chicago, IL, USA), the significant differences of energy consumption (W, k·Wh g−1) between treatments were determined by an analysis of variance (ANOVA) followed by post-hoc testing using Tukey’s HSD test. A p value of less than 0.05 was used to determine if the differences were statistically significant use one way ANOVA by Microsoft excel 2016.
Source: Ecology - nature.com
