Influence of basin geodynamics and petroleum fields
We applied GIS-based geospatial and geostatistical analyses to evaluate the relationship between hydrocarbon seep distribution, basin geodynamics and petroleum fields (see Methods).
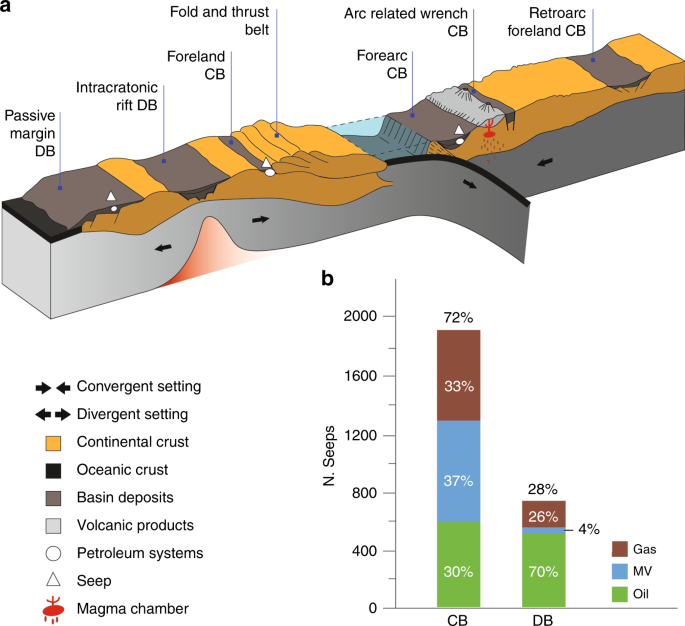
Convergent basins include retroarc, forearc, arc-related wrench and foreland basins associated with fold-and-thrust belts and form in geodynamic settings characterised by continental shortening and tectonic loading20 (Fig.1a). Divergent basins include intra-cratonic, rift and post-rift sags, passive margins and wrenches (see details in Supplementary Note 3).

a The main basin typologies and the potential occurrence of petroleum systems and seeps are also indicated. b Bar plot of seeps distribution: gas seeps, mud volcanoes (MV) and oil seeps, in convergent (CB) and divergent (DB) basins.
Geospatial analysis shows that out of 2699 seeps, 1941 seeps (72%) occur in convergent basins (Table 1 and Supplementary Fig. 3), although these basins cover an area smaller than that of divergent basins (Fig. 1b and Table 1).
There is not a well defined prevailing type of seep in convergent basins: 33% are gas seeps, 30% oil seeps and 37% mud volcanoes. About 95% of the worldwide mud volcanoes occur in these basins (Fig. 1b), which are closely related to thrust systems and sedimentary diapirism21. Divergent basins host 758 seeps (28% of the total), of which 70% is oil, 26% gas and 4% mud volcanoes (Fig. 1b).
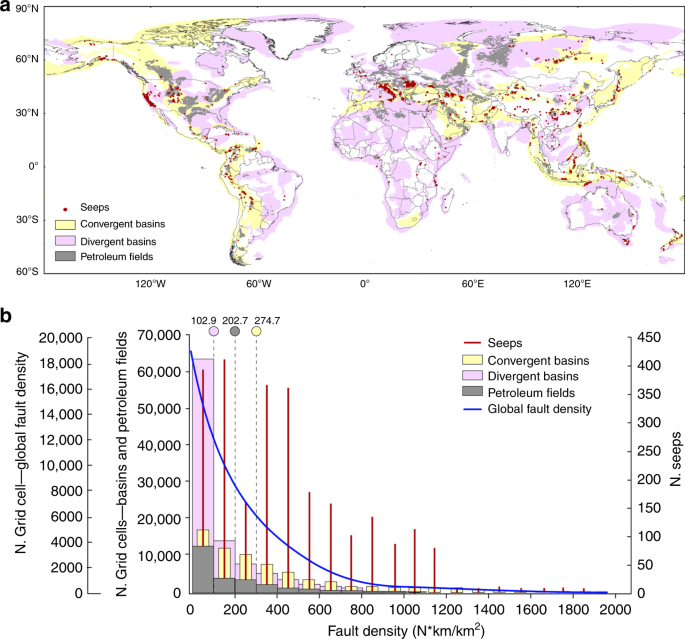
Convergent and divergent basins host 58% and 42% of petroleum fields, respectively. As expected, most seeps (81%) occur within the area covered by petroleum fields (Fig. 2a; Table 1). The remaining 19% of seeps can be related to minor fields not included in the petroleum field inventory, direct fluid migration from source rocks, also not included in the inventory, and long-distance lateral migration of gas and oil14. Seeps prevail at the margins of petroleum fields, which are typically more faulted and fractured (examples in Supplementary Note 3 and Supplementary Fig. 4). The result of our analysis demonstrates that seeps are a fundamental component of petroleum systems according to the definition of Petroleum Seepage System22, and gas-oil reservoirs are the source of most seeps15. In addition, seepage mostly (95%) occurs in areas with heat flow ≤98 mWm−2 (Supplementary Table 1), which are values typical of the thermal status of petroleum systems23 (Supplementary Note 3 and Supplementary Fig. 5).

a Map of sedimentary basins (convergent, light yellow; divergent, light violet), petroleum field areas (grey) and geo-CH4 seeps (red dots). b Multiple histograms of fault density values at global scale (blue line), in convergent (light yellow) and divergent (light violet) basins, in petroleum fields (grey), and at seep location (red). Grid cell is 0.2° × 0.2°. The fault density mean value for divergent basins, petroleum fields and convergent basins is indicated above the light violet, grey and yellow circles, respectively.
Seeps and faults
It is known that hydrocarbon seeps, especially gas seeps and mud volcanoes, develop along fracture and/or fault networks14,24. Therefore, we have evaluated the spatial occurrence of faults within convergent and divergent basins and within the petroleum fields. We built a fault density map (1° × 1°) as a proxy of brittle tectonics occurrence using onshore, active and non-active faults from a worldwide fault database integrating published global and regional datasets (Supplementary Figs. 6 and 7a–e). Fault density, in terms of number of faults, weighted for their length (km) per km2 (Nf kmf km−2) is mapped by using a kernel density algorithm25,26 (Methods, Supplementary Note 4 and Supplementary Figs. 8 and 9a–c). We then compared the statistical distribution of the global fault density with fault density values in convergent and divergent basins in petroleum fields and at seep locations (Fig. 2b). Results show that convergent basins are, on average, more fractured than divergent basins (mean fault density values are 274.7 and 102.9 Nf kmf km−2, respectively). This is likely due to the presence, in convergent basins, of longer faults, mainly thrusts associated with orogenic belts. These fault systems concentrate along the edges of thrust-and-fold belts and may be related to ruptures from shallow decollement layers up to the surface with multiple short-cuts, back-thrusts, and ancillary high-angle fracturing20,27. Petroleum fields show a mean fault density value (202.7 Nf kmf km−2) comparable to that of convergent basins. Interestingly, seeps occur for any value of fault density. This means that both isolated faults and regions with fault clusters can host seeps (Fig. 2b). Petroleum fields and seeps prevail in convergent basins (Table 1). This can be explained by the fact that convergent basins, although covering a smaller area than that of divergent basins, are more fractured and faulted (Fig. 2b)28.
To summarise, we found that seeps occur for any type of fault density, preferably at the boundaries of petroleum fields hosted mainly in convergent basins with heat flow values ≤98 mWm−2 (Supplementary Note 3).
We evaluated the role of faulting regime in gas seepage by correlating the seep location and type to the style (reverse, normal, and strike-slip) of the fault.
The distance between each seep and the nearest fault is calculated by proximity analysis (see Methods, Supplementary Note 4 and Supplementary Table 2). We stress that the nearest fault considered in this analysis solely serves as the source of information on the faulting regime of the area associated with seepage, and does not necessarily represent the actual fault system along which fluids migrated originating the seep.
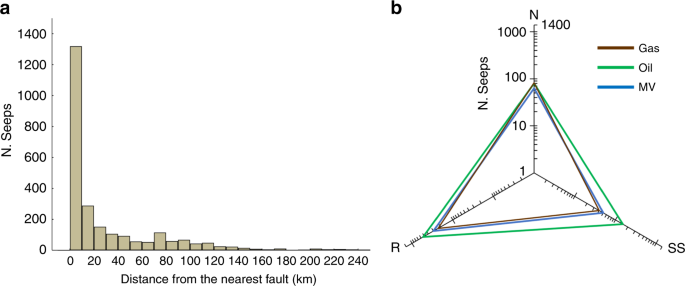
The results show that the distance between each seep and the nearest fault, used to extract information on the fault style, is mostly less than 20 km (Fig. 3a, Supplementary Fig. 10). This value corresponds to the nearest threshold distance common to all types of seeps (Supplementary Fig. 11) and it is within the uncertainty of geographic position of either seep and/or global fault inventories (see Methods). Accordingly, this distance has been used to analyse the association between seeps and fault type. The radar diagram in Fig. 3b shows that all types of seeps, i.e., gas seeps, oil seeps and mud volcanoes, occur in areas characterised by any fault style, with a preference for reverse faults, which is the type of faulting more frequent within petroleum field areas (Supplementary Table 3). The close spatial relation between mud volcanoes and reverse faults was evidenced in local and regional studies and it can be related to low-angle thrusts14,16. Also, mud volcanoes can be observed in strike-slip/transpressive29,30,31, and extensional32,33 settings. Extensional basins are characterised by higher rates of sedimentation, a depositional condition necessary for the trapping and migration of hydrocarbons14. A case study in Northern Italy demonstrates that mud volcanoes tend to occur on top of thrust-related anticlines hosting the main reservoir34. Our global analysis reveals that oil seeps are more frequently associated with reverse faults. It must be noted, however, that oil seeps may be not associated with any fault, as oil can migrate along permeable stratigraphic layers (e.g., homocline seeps)15,24. In our database, for example, we recognise 134 oil seeps located at distances >100 km from the nearest fault (most of them in the cratonic Siberian oil provinces). The association between gas seeps and normal faults (Fig. 3b) is similar to the one observed for geothermal CO2 degassing, which is mainly controlled by extensional structures5. This is the only analogy between CH4 and CO2 degassing and fault association. Basically, our results show that hydrocarbon seepage is not exclusively associated with any given fault type. The observed association between the tectonic style and seepage can, in theory, be also applied to offshore areas, where presently geospatial analyses cannot be performed due to the lack of a global inventory with precise seep geographic location6.

a Histogram of the distances between seeps and the nearest fault bearing the faulting style information, as available in the global fault dataset. The distinction by fault type is shown in Supplementary Fig. 10. b Radar diagram showing the number and the type of seeps related to fault type (nearest fault); N: normal, SS: strike-slip, R: reverse; Gas: gas seeps, Oil: oil seeps, MV: mud volcanoes.
Global spatial model of geo-CH4 seepage favourability
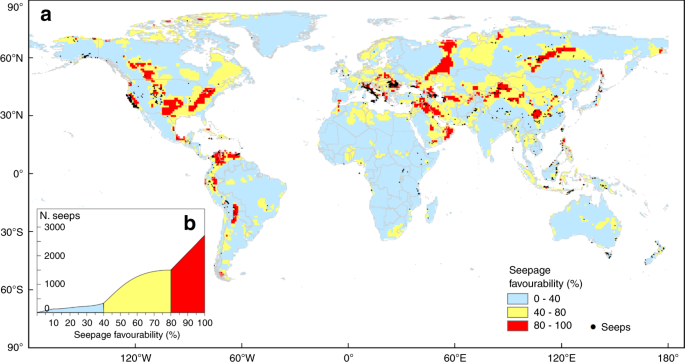
On the basis of the results of the geospatial analysis, we developed a conceptual spatial model of seepage occurrence providing a global map of the potential geo-CH4 emission areas. We used a GIS-based Spatial Multi-Criteria Decision Analysis (SMCDA) and, in particular, the Analytical Hierarchy Process (AHP) (Methods and Supplementary Note 5). The conceptual spatial model of seepage occurrence includes the following geological input parameters: basin type (convergent, divergent); global petroleum fields; heat flow; fault density, and faulting style. These factors are weighted by using AHP, an effective tool for determining the best combinations of factors. The model, represented by a raster map with 1° × 1° grid cell, has been normalised to obtain a final favourability map of seepage, expressed as spatial probability (%) of occurrence (Fig. 4a and Supplementary Fig. 12).

a Map with the boundary of seepage probability classes selected according to the slope changes in the inset graph. The map suggests the potential areas where additional seeps (not identified in available inventories) and microseepage can occur. b Cumulative number of seeps.
The model has been validated by verifying that the number of known (inventoried) seeps increases with seepage favourability. The test shows that about 70% of the seeps fall in the probability exceeding 50% (Fig. 4b). The model also suggests that, in addition to the known seepage areas (black dots in Fig. 4a), wide areas of geo-CH4 emissions potentially occur in North America, Northern and Arctic Europe, Western Russia, Caucasus and Eastern Europe, Western Siberia, China, Turkmenistan, Kyrgyzstan and the Arabian Peninsula (Supplementary Note 5, Supplementary Fig. 12). The favourability model also allows to identify potential areas of microseepage, i.e., diffuse degassing of methane and other light hydrocarbons. The favourability model is in fact applicable to any type of seepage, focused (seeps or macro-seeps) and diffused (microseepage), since the gas migration mechanism (fundamentally advective, i.e., driven by pressure gradients, and whose intensity is mainly controlled by fault-related permeability) is the same15,18,22. Besides the relevance for oil-gas exploration14,35, microseepage was estimated as the major geo-CH4 source to the atmosphere (about 24 (15–33) Mt yr−1)6,10. The main uncertainty in the global CH4 source strength is related to the limited knowledge of the global microseepage area. Our model suggests a high probability (≥50%) microseepage area of 8.1 Mkm2, a value consistent with that previously predicted by process-based modelling (8.6 Mkm2)6.
Source: Ecology - nature.com


