Preparation and optimization of Ben/Rm ceramsite
Elemental compositions of Ben and Rm were determined by XRF (Table 1). High contents of SiO2 and Al2O3 were found in Ben (SiO2 = 60.8% and Al2O3 = 11.9%) and Rm (SiO2 = 15.2% and Al2O3 = 22.2%), which are sufficient to meet the requirements of sintering ceramsite21. In addition to SiO2 and Al2O3, some fluxing components (e.g., MgO, CaO, Na2O, and K2O) and volatiles also present in Ben and Rm. About 10.48% and 50.68% of fluxing components are respectively contained in Ben and Rm. Therefore, Ben and Rm can be used as the main materials for firing ceramsite. Moreover, the mineral constituent of Ben and Rm were appraised by XRD. For Ben, the peak strength of SiO2 crystal phase is most intense, and crystal peaks of CaO3 can also be observed (Fig. 1a). Since other major components of Ben such as Al2O3 and MgO did not form crystal morphology, corresponding peaks were not detected. For Rm, large amount of crystal SiO2 and a certain amount of CaCO3 and Ca3Al2O6 were detected (Fig. 1b).
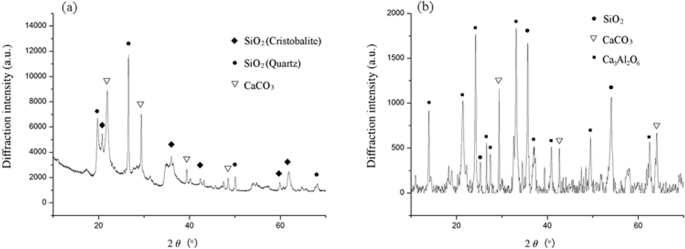
XRD spectra of bentonite (a) and red mud (b).
According to elemental compositions in Table 1, we calculated the content of SiO2, Al2O3, fluxing components and SiO2 + Al2O3 in the mixture of Ben and Rm with different ratios (1:1, 2:1, 3:1, 4:1, 5:1, 6:1 and 7:1) (Table 2). With the increase of proportion (Ben: Rm), the content of SiO2 and SiO2 + Al2O3 would increase, while the content of Al2O3 and fluxing components would decrease. Taking into account Riley three-phase diagram30 and the actual situation of adding as much Rm as possible to the raw materials, four ratios (3:1, 4:1, 5:1 and 6:1) were adopted to prepare Ben/Rm ceramsite.
To optimize the preparation of CFA/WS ceramsite and identify the critical factors of determining the ceramsite properties, an orthogonal experimental design of five factors (mass ratio of Ben: Rm, preheating temperature and time, calcining temperature and time) and four levels (L16(4)5) were conducted and bulk density of ceramsite was employed as the evaluation index. Relatively lower bulk density is preferable, which demonstrates higher porous ceramsite bodies31. The significance levels of different influencing factors on the ceramsite bulk density were clarified through the range analysis32. Table 3 summed up the results of L16(4)5 orthogonal design. The K value for each level of a parameter was the average of four bulk density values, and the range value (R) for each factor was the difference between the maximal and minimal K values of the four levels. The range analysis suggested Ben: Rm ratio was the most important factor and followed by preheating time and calcining temperature, while others factors were not of significance.
As depicted in Table 3, with the increase of Ben: Rm ratio, the bulk density of ceramic displayed a decline trend, which may be related to the change of sintering and volatile compositions. In addition, when the preheating time was within 15–25 min, ceramsite bulk density increased obviously with the increase of time. However, increasing the preheating time from 25 to 30 min, the bulk density showed a slightly decrease. Under certain conditions, increasing preheating time facilitated softening ceramsite, which ensured ceramsite produced enough gas in the roasting stage, thus reduced the bulk density. However, when preheating time is too long, organic matter and carbonate will decompose and volatilize to produce gas in the preheating stage, which will reduce the gas amount produced in roasting stage, then the bulk density increased.
Preparation and optimization of Ben/Rm/Ps ceramsite
Ps was characterized by ultimate analysis (Table 4) and TG (Fig. 2). The TG curve shows that the Ps mass nearly did not change below 260 °C, while a drastic decline occurred within 260–468 °C, and above 468 °C little Ps was residual (Fig. 2). Therefore, decomposition of Ps is expected to occur in the initial stage of ceramic calcination stage, which can improve the sintering performance and promote the formation of ceramic porous structure.
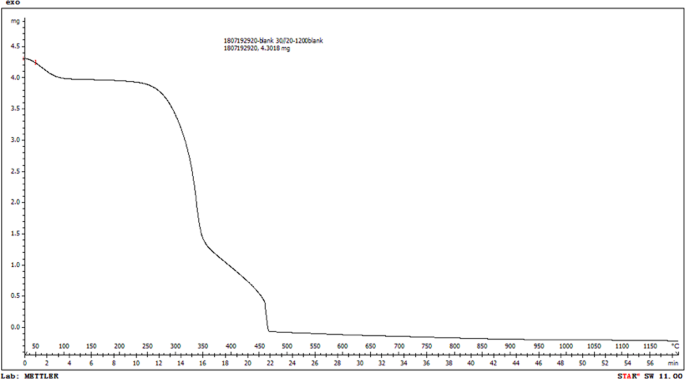
Thermogravimetric (TG) analysis of pine sawdust.
The aforementioned L16(4)5 orthogonal experimental design indicated the mass ratio of raw materials and preheating time were the most significant influence factors on ceramic sintering. Therefore, for the preparation of Ben/Rm/Ps ceramsite, the mass ratio of raw materials and preheating time were optimized by using one-factor experimental design, while the other fixed parameters were adopted the optimal ones based on L16(4)5 results, i.e., preheating temperature = 240 °C, calcining temperature = 1150 °C, calcining time = 14 min.
For the optimization of mass ratio of raw materials, the preheating time was fixed at 15 min, and four levels of Ben: Rm were employed, i.e., 3 g:1 g, 4 g:1 g, 5 g:1 g and 6 g:1 g. Different amounts of Ps (0.1–1 g) were added to the raw materials to sinter ceramsite. Apparent density, bulk density and compressive strength of ceramsite were determined to appraise the influence of raw materials ratio (Fig. 3a–c). Besides, a three-phase diagram based on the three parameters was presented in Fig. 3d, during which 19, 36 and 8 represent mass ratios of Ben: Rm: Ps = 4:1:0.9, 6:1:0.6 and 3:1:0.8, respectively. Combining the three-phase diagram (Fig. 3d) with apparent density, bulk density and compressive strength curves (Fig. 3a–c), 8, 19 and 36 displayed outstanding performance among all ratios. Besides, 19 and 36 have little difference in compressive strength and apparent density, while showed much more excellent than 8. In addition, comparing with 36, 19 exhibited smaller bulk density and possessed more red mud, which is conducive to waste utilization. Therefore, the Ben: Rm: Ps ratio of 4:1:0.9 was chosen for the follow-up experiment.
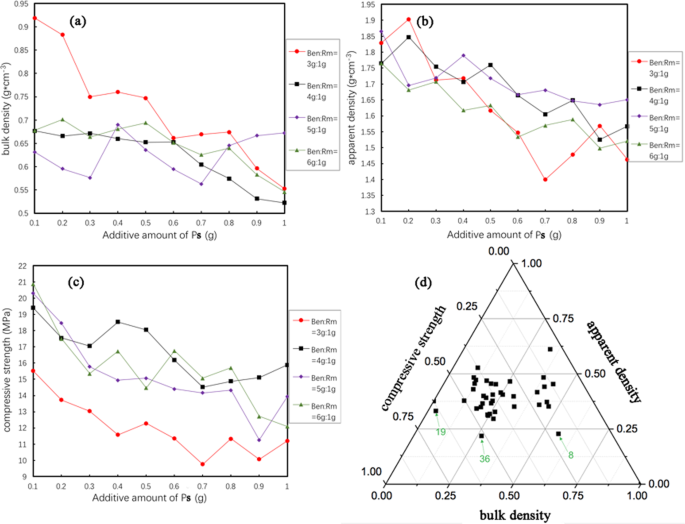
Optimizaiton of mass ratio of raw materials for preparation of Ben/Rm/Ps ceramsite. Bulk density (a), apparent density (b), compressive strength (c) and three-phase diagram based on the three parameters (d) of Ben/Rm/Ps ceramsite obtained at different raw materials ratio.
For the optimization of preheating time, the optimal ratio of Ben: Rm: Ps (4:1:0.9) was employed and the preheating time was varied from 10 min to 30 min. TC adsorption capacity of obtained ceramsite was assessed by static adsorption experiments. The TC adsorption capacity of ceramsite showed a trend of firstly increasing and then decreasing with the increase of preheating time (Fig. 4). From 10 min to 20 min, the TC adsorption capacity of ceramsite showed a steady increase, and reached the maximum value at 20 min. With the increase of preheating time, softening degree of ceramsite raises, which is conducive to ensuring enough gas producing in the roasting stage, thus reducing bulk density. Continuously increase the preheating time from 20 min to 30 min, the TC adsorption capacity of ceramsite displayed a quick decline. This can be explained that the organic matter and carbonate will decompose and volatilize to produce gas in the preheating stage for too long preheating time, which will reduce the amount of gas produced in the roasting stage and increase the stacking density.
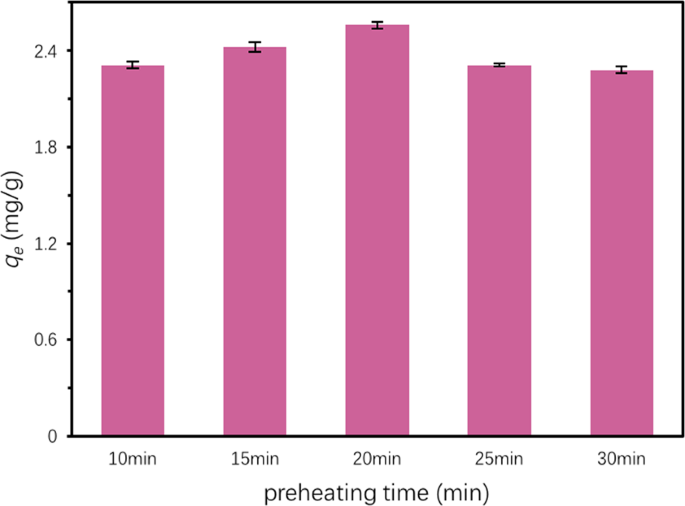
TC adsorption capacity of Ben/Rm/Ps ceramsite obtained at different preheating time. Adsorption condition: total TC = 80 mg/L, adsorbents dose = 20 g/L, T = 20 °C, pH = 7 and equilibrium time = 24 h.
To sum up, the optimal parameters for preparation of Ben/Rm/Ps ceramsite were determined as: Ben: Rm: Ps = 4:1:0.9, preheating temperature = 240 °C, preheating time = 20 min, calcining temperature = 1150 °C, and calcining time = 14 min. The Ben/Rm/Ps ceramsite prepared at this optimal condition (hereafter referred to as Ben/Rm/Ps-op) had an apparent density of 1.41 g/cm3, bulk density of 0.54 g/cm3 and compressive strength of 19.45 MPa.
SEM analysis (Fig. 5) showed that both the surface and cross-section of Ben/Rm/Ps-op was mainly distributed by macroporous and microporous structures with different sizes, indicating a large specific surface area and widely distributed adsorption sites. The SEM results demonstrated that ceramsite was a porous ceramsite and might be a good adsorbent for wastewater treatment. XRD detected the formation of several crystal phases in Ben/Rm/Ps-op including SiO2, Ca3Si2O7, Ca2Si2O5(OH)2 and Ca2SiO4 (Fig. 6). The crystal compositions are helpful to improve the strength of ceramsite; the active components such as SiO2, Si2O76−, Si2O5(OH)24− and SiO44− can be adsorption sites of TC via ion exchange. Since TC contain a positively charged group in the structure, regardless of the zero net charge or negative net charge, it is likely that the molecule arranges at the surface in such a way that the positively charged group is located very close to the surface. SiO2 is negatively charged at the solution of pH > 2.5, which could easily combine with TC. In addition, negatively charged groups Si2O76−, Si2O5(OH)24− and SiO44− also showed excellent binding ability with TC.
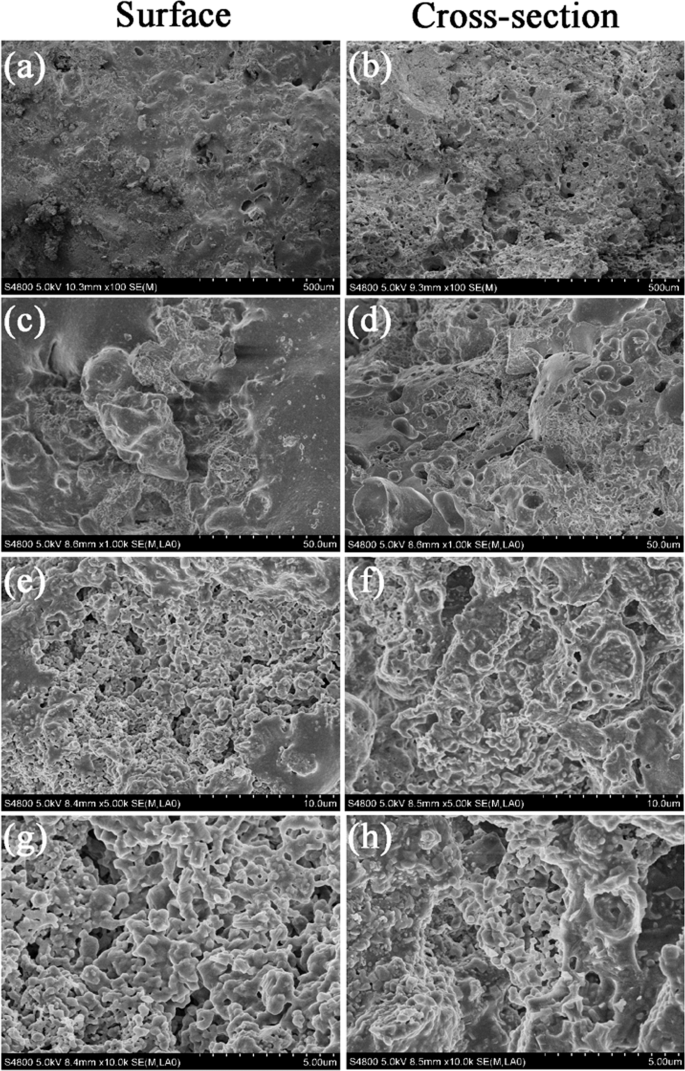
SEM images of Ben/Rm/Ps-op ceramsite surface at ×100 (a), ×1000 (c), ×5000 (e) and ×10000 (g); SEM images of Ben/Rm/Ps-op ceramsite cross-section at ×100 (b), ×1000 (d), ×5000 (f) and ×10000 (h).
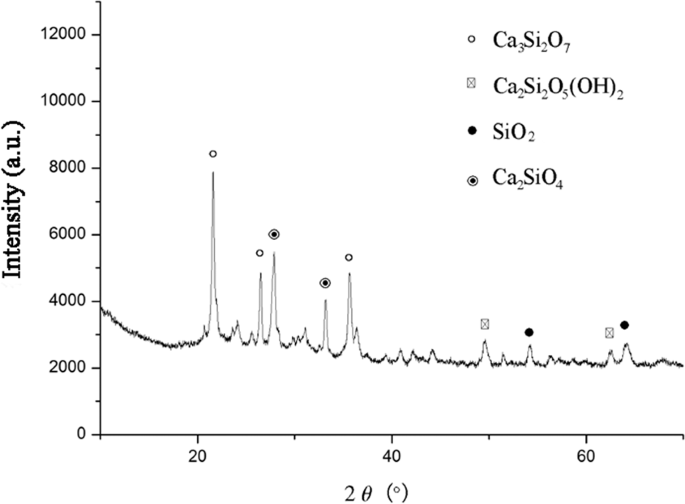
XRD profiles of Ben/Rm/Ps-op ceramsite.
Moreover, heavy metal leaching toxicity analysis (Table 5) revealed the concentrations of leached heavy metals from Ben/Rm/Ps-op were far below hazardous wastes standard (GB 5085.3-2007)29, and basically met the surface water quality of Class III (GB 3838-2002)28, recommending Ben/Rm/Ps-op will not cause secondary pollution to the aquatic environment. Therefore, Ben/Rm/Ps-op is a safe ceramsite with great mechanical strength and adsorption capacity.
Adsorption of TC
Adsorption kinetics
It is observed in Fig. 7 that Ben/Rm/Ps-op could catch most of TC from aqueous solution in the initial 180 min and reach equilibrium after 360 min. After calculation, 64% TC was removed at equilibrium and the equilibrium adsorption capacity was as high as 2.5602 mg/g.
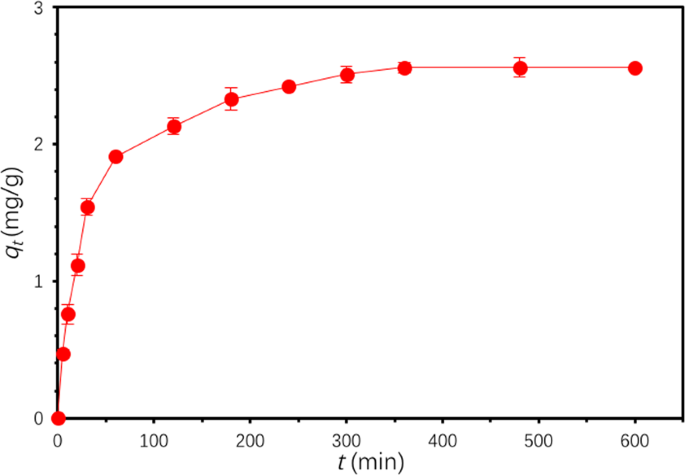
Adsorption kinetic of TC by Ben/Rm/Ps-op ceramsite. (C0 = 80 mg/L, V = 50 mL, speed = 160 rpm, adsorbent dose = 20 g/L, T = 20 °C, pH = 7).
Pseudo-first-order and pseudo-second-order models were tested to analyze the kinetics results, which are expressed as33,34:
Pseudo-first-order model:
$$mathrm{ln},{q}_{e}-{q}_{t}=ln{q}_{e}-{k}_{1}t$$
(5)
Pseudo-second-order model:
$$frac{t}{{q}_{t}}=frac{1}{{k}_{2}{{q}_{e}}^{2}}+frac{t}{{q}_{e}}$$
(6)
where qt and qe (mg/g) are the adsorption capacities of TC at time t (min) and equilibrium, respectively; k1(min−1) is the rate constant for pseudo-first-order model and k2(g/(mg∙min)) is for pseudo-second-order model, respectively. As a result, the pseudo-second-order model showed higher R2 = 0.9996, compared with R2 = 0.9789 for the pseudo-first-order model (Table 6, Fig. 8). Besides, qe,cal (2.6889 mg/g) of pseudo-second-order model was closer to qe,exp value (2.5602 mg/g) than qe,cal (1.7591 mg/g) of pseudo-first-order model did. Consequently, the adsorption of TC by Ben/Rm/Ps-op conforms to pseudo-second-order model, indicating that the rate controlling step for adsorption was a chemical interaction35.
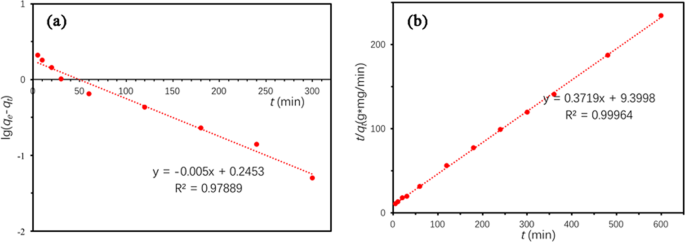
Kinetics plots for TC adsorption on Ben/Rm/Ps-op. (a) pseudo-first-order model; (b) pseudo-second-order model.
Adsorption mechanism
The pseudo-second-order model, including all processes of adsorption (external liquid film diffusion, surface adsorption, intraparticle diffusion and so on), could not accurately reflect the mechanism of this adsorption process36. For further exploring adsorption mechanism of TC on Ben/Rm/Ps-op, intraparticle diffusion model was employed to determine the type of rate-controlling step. This model can be delivered as follows:
$${q}_{t}={k}_{int}{t}^{0.5}+Const$$
(7)
where kint (mg/(g∙min0.5)) is the constants for the intraparticle diffusion model, and Const (mg/g) is a constant proportional to the extent of boundary layer thickness.
Figure 9 expressed the linear plots involving two adsorption stages with different slopes. kint1 refers to the external adsorption rate constant in first step, and kint2 indicates the internal adsorption rate constant of the second stage by diffusion between particles into the adsorbent. The value of kint1 was higher than that of kint2 owing to a rapid increase in adsorption during the initial phase, with increased active sites available. This result is related to changes in mass transfer rate during adsorption process. The linear portion did not pass through the origin, suggesting that the adsorption mechanism of the TC onto Ben/Rm/Ps-op is not only restrained by the intraparticle diffusion step37.
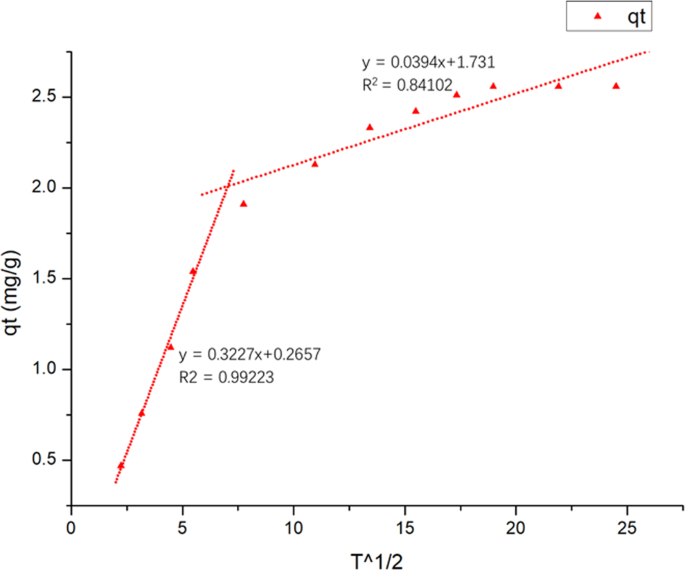
Intraparticle diffusion model for the adsorption of TC on Ben/Rm/Ps-op (kint1 = 0.3227, kint2 = 0.0394).
Adsorption isotherm
Adsorption isotherm result at 20 °C was presented in Fig. 10. With the increase of the initial concentration of TC, adsorption capacity of Ben/Rm/Ps-op for TC increased overtly, while TC removal rate significantly descended. The isotherm results were further analyzed using linear, Langmuir, Freundlich, Tempkin and D-R (Dubinin-Radushkevich) isotherm models, as expressed below38,39:
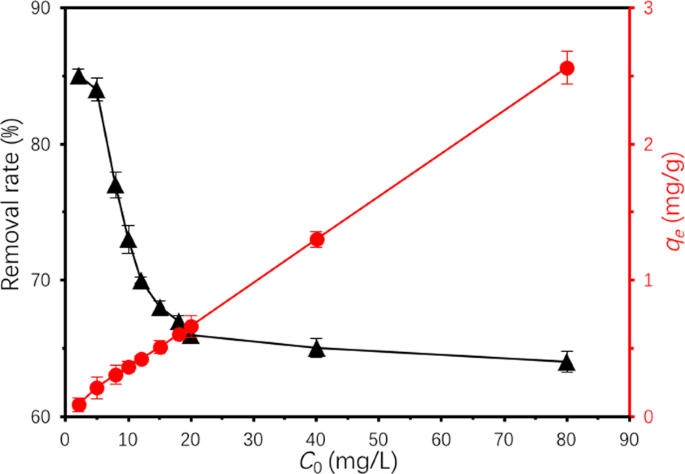
Adsorption isotherms of TC by Ben/Rm/Ps-op (C0 = 2–80 mg/L, V = 50 mL, speed = 160 rpm, adsorbent dose = 20 g/L, T = 20 °C, pH = 7, t = 12 h).
The linear isotherm model indicates that amount of adsorption is linearly proportional to the equilibrium solution concentration, which can be depicted as:
$${q}_{e}={K}_{d}{C}_{e}$$
(8)
The Langmuir isotherm model assumes that the adsorption sites on the surface of the monolayer are uniform and equivalent, with no interaction between adsorbate molecules at adjacent locations, which is expressed as40:
$$frac{{C}_{e}}{{q}_{e}}=frac{{C}_{{rm{e}}}}{{q}_{m}}+frac{1}{{q}_{m}{K}_{L}}$$
(9)
where qm (mg/g) is the maximum adsorption capacity, and KL (L/mg) is the Langmuir constant associatd with the affinity of binding site and is also a measure of the free energy of adsorption.
The Freundlich isotherm model is used to depict the adsorption on an energy heterogeneous surface, and could be expressed as41:
$$ln{q}_{e}=ln{K}_{F}+frac{1}{n}ln{C}_{e}$$
(10)
where n is the heterogeneity factor indicating the adsorption strength of the adsorbent, and KF (mg/g∙(L/mg)1/n) is the constant in connection with the adsorption capacity.
Tempkin and Pyzhev assumed that some indirect adsorbate/adsorbate interactions had effect on adsorption isotherms and suggested that the adsorption heat of all the molecules in the layer would decrease linearly with coverage due to these interactions. The Tempkin isotherm has been used as below:
$${q}_{e}=frac{RT}{b}lnA{C}_{e}$$
$${q}_{e}=frac{RT}{b}lnA+frac{RT}{b}ln{C}_{e}$$
$$B=frac{RT}{b}$$
A plot of qe versus lnCe could determine the constants A and B. The constant B is related to the adsorption heat42.
The D-R empirical equation put forward by Dubinin and Radushkevich, has been widely employed to depict the gases and vapours adsorption on microporous solids. In the case of liquid phase adsorption, several researches have indicated that the adsorption energy can be estimated via D-R equation. Assuming only monolayer adsorption occurs in micropores adsorption and the D-R equation is applicable, the adsorption capacity per unit surface area of the adsorbent at equilibrium, qe, can be described as43:
$${q}_{e}={q}_{0}exp (,-,B{varepsilon }^{2})$$
$$varepsilon =RT,mathrm{ln}(1+frac{1}{{C}_{e}})$$
where B is the constant related to the adsorption energy, q0 is the ultimate capacity per unit area of adsorbent micropores, and ε is the Polenyi potential. The most probable adsorption energy, E, has been shown as:
$$E={(2B)}^{-frac{1}{2}}$$
As Fig. 11 depicted, the linear, Langmuir, Freundlich, Tempkin and D-R isotherm models were used to fit TC adsorption data onto Ben/Rm/Ps-op. The parameter values were based on the regression of the isotherm equations and were summarized in Table 7. The results showed that Langmuir isotherm model was not suitable for the adsorption, demonstrating that the adsorption of TC by Ben/Rm/Ps-op was not monolayer adsorption, neither Tempkin nor D-R isotherm models. Whereas, linear isotherm model was suitable for the determination of data due to the higher correlation coefficient R2 (0.98689) than R2 (0.95035) of Freundlich. For linear model, the coverage of monolayer and the initial amount of multilayer adsorption appear to be superimposed. Since there is no platform in linear model, it indicates that the adsorption does not reach saturation, and the multilayer adsorption thickness seems to increase indefinitely.
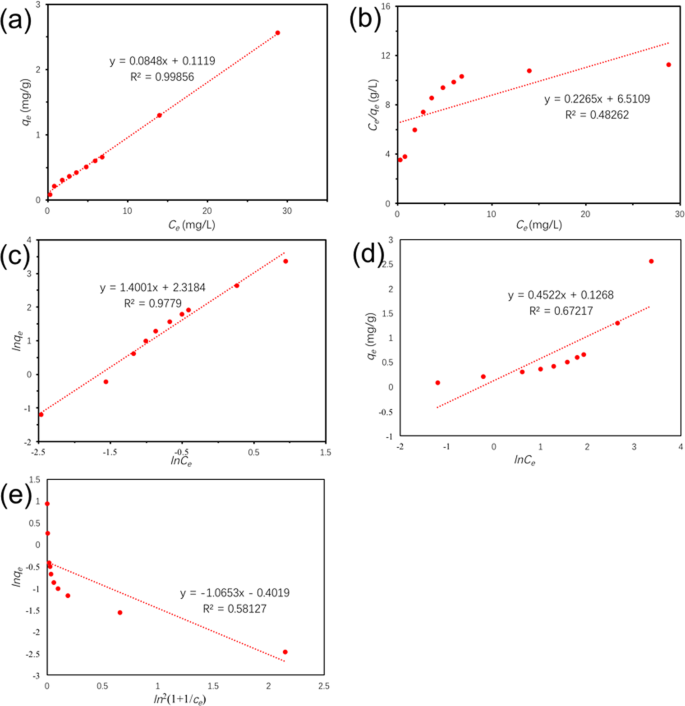
Linear (a), Langmuir (b), Freundlich (c), Tempkin (d) and D-R (e) plots of isotherms.
Adsorption thermodynamics
Thermodynamic properties of TC onto Ben/Rm/Ps-op were further investigated, which could be described via Gibb’s free energy (ΔG°), enthalpy (ΔH°) and entropy (ΔS°). The thermodynamic were estimated using the following relations38,44:
$${K}_{C}=frac{{C}_{Ae}}{{C}_{e}}$$
(11)
$$varDelta {G}^{^circ }=-,{rm{RT}}ln{K}_{c}$$
(12)
$$ln{K}_{{rm{c}}}=-,frac{varDelta {H}^{^circ }}{RT}+frac{varDelta {S}^{^circ }}{R}$$
(13)
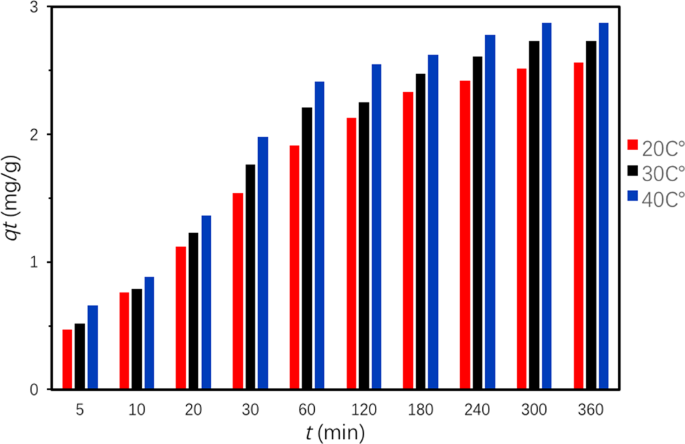
where R (8.314 J/K mol) is the gas constant; T (K) is temperature; Kc is the equilibrium constant; Ce is the equilibrium concentration of TC in the solution (mg/L); and CAe is the amount of adsorbed TC on the adsorbent at equilibrium (mg/L). CAe and Ce are obtained from qe values of the pseudo-second-order model (Fig. 12). ΔS° and ΔH° were acquired from the slope and intercept of linear plot of lnKc versus 1/T according to Eq. (13) (Fig. 13). Figure 14 described adsorption capacity of ceramiste at different temperatures, and demonstrated that increasing temperature would promote adsorption capacity of TC by ceramsite. Table 8 presented the thermodynamic parameters at different temperatures. The negative values of ΔG° (−1.751, −2.322 and −2.806 kJ/mol for 293.15, 303.15 and 313.15 K respectively) suggested that the adsorption of TC onto Ben/Rm/Ps-op was spontaneous and thermodynamically favorable. Besides, ΔG° value decreased with an increase in temperature, indicating that the spontaneous nature of the adsorption was inversely proportional to the temperature and higher temperature enhanced the adsorption45. Moreover, the positive value of ΔH° suggested that the adsorption of TC onto Ben/Rm/Ps-op was an endothermic process. The positive value of ΔS0 revealed increased randomness at the solid/solution interface during the adsorption of TC onto Ben/Rm/Ps-op46.
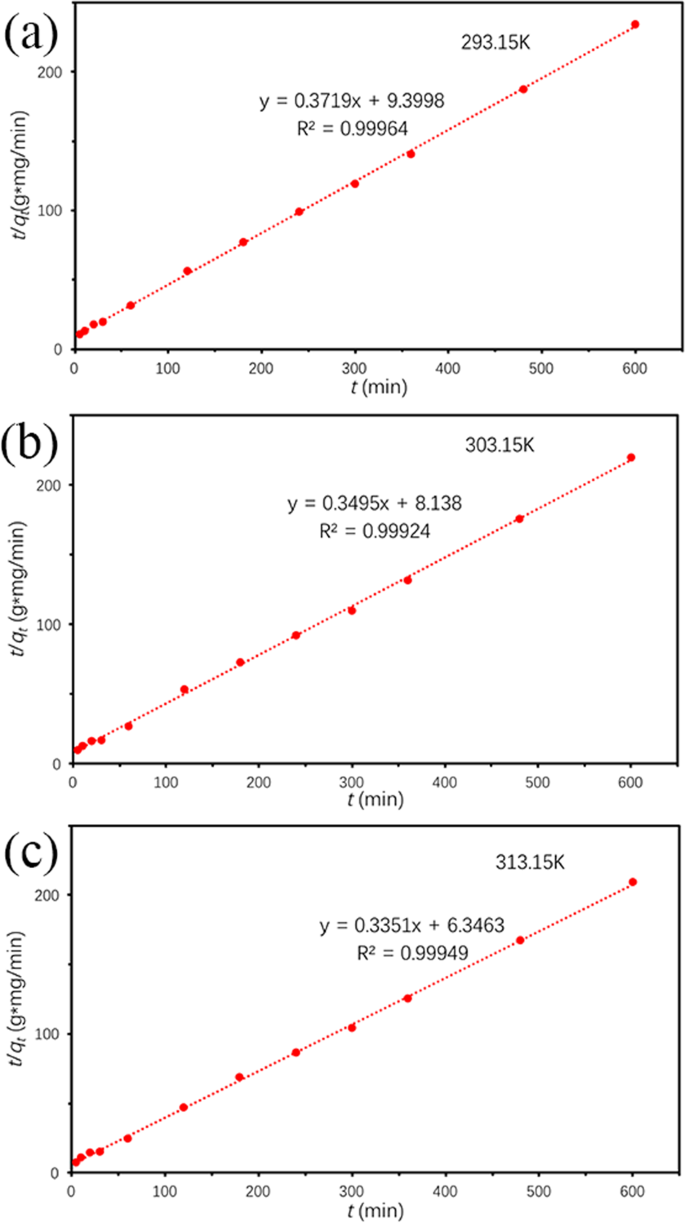
Pseudo-second-order model under 20 °C (293.15 K) (a), 30 °C (303.15 K) (b) and 40 °C (313.15 K) (c).
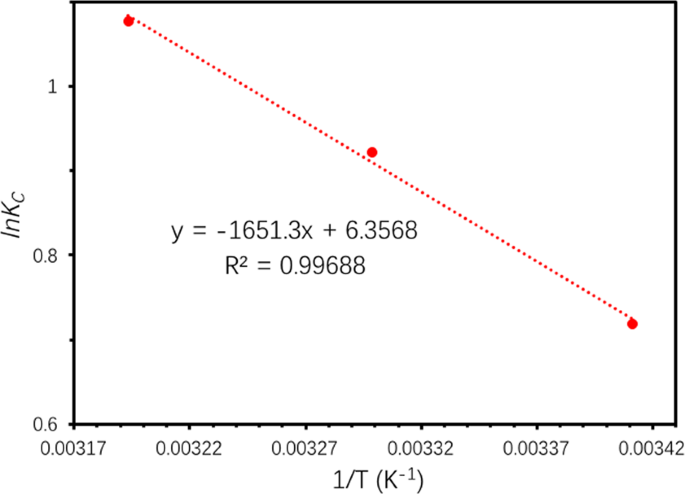
Plot of lnKc versus 1/T for TC adsorption.
Adsorption Kinetics at 20 °C (a), 30 °C (b) and 40 °C (c).
Effects of pH, Ben/Rm/Ps-op dosage and ionic strength
For the effect of pH on adsorption, the adsorption capacity and removal rate of TC increase within pH 2–7, and decrease during pH 7–10 (Fig. 15a). Under strong acid condition (pH 2–4), TCH3+ is the main form of TC, which could be combined with silicon dioxide with negative charge in ceramsite. While hydrogen ions in the solution are more competitive than TC in binding to the ceramisite voids at the same time. So the amount of TC adsorbed by ceramisite (from 1.86 to 1.94 mg/g) and removal rate (from 46.5% to 48.5%) did not increase significantly in the range of pH 2–4. With increasing pH from 4 to 7, the adsorption capacity of TC sharply increased by 0.62 mg/g and the removal rate climbed to 64% at pH 7. This because H+ decreased in an order of magnitude, and the adsorption of TC by ceramsite increased obviously. However, from pH 7 to pH 10, the removal rate of TC by a large margin reduced to 53% with an adsorption capacity of 2.12 mg/g. During this period, the morphology of TC gradually changed from TCH2° to TCH−, and the negative charge ratio on the surface of ceramsite increased, which were unfavorable to the adsorption of TC by ceramsite. This result indicates the adsorption capacity of Ben/Rm/Ps-op will be largely impacted by pH, and the adsorption performance was excellent at the neutral condition.
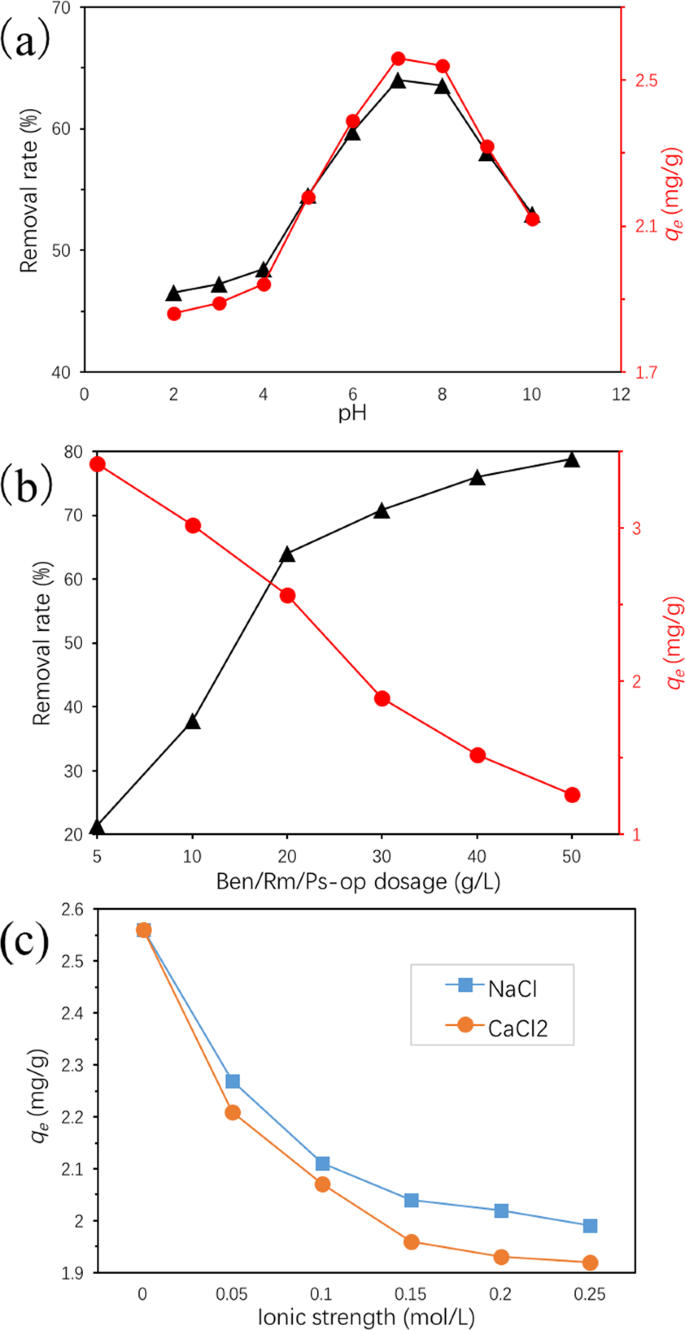
Effects of pH (2–10) (a), Ben/Rm/Ps-op dosage (5–50 g/L) (b) and ionic strength (0–0.25 mol/L) (c) on the adsorption capacity and removal rate of tetracycline (adsorption condition: C0 = 80 mg/L, V = 50 mL, speed = 160 rpm, T = 20 °C, pH = 7, t = 12 h).
Besides, the adsorption of TC was conducted in the presence of different dosage of Ben/Rm/Ps-op. As Fig. 15b described, the removal rate of TC significantly increased from approximately 21.38% to 78.75% with increasing Ben/Rm/Ps-op dosage from 5 to 50 g/L. However, the TC adsorption capacity gradually decreased from approximately 3.42 to 1.26 mg/g. Given the efficiency and economy of such operation, the optimum Ben/Rm/Ps-op dosage is 20 g/L, under which both the adsorption efficiency and capacity were kept high.
In addition, adsorption experiments on the effect of ionic strength were conducted using 80 mg/L TC solution containing 0–0.25 mol/L NaCl or CaCl2 at pH = 7 and the temperature of 20 °C. Figure 15c describes the adsorption behavior of TC versus ironic strength. The existence of NaCl (or CaCl2) decreases the adsorption capacity of TC onto Ben/Rm/Ps-op, which may be due to the competitive effect between Na+ (or Ca2+) and TC on the adsorption sites. Parolo et al. observed that it can be explained that metal cations in solution could easily chelate with TC47, and electrolyte can produce electrostatic shielding effect, thus affect adsorption48,49. In addition, increasing Na+ (or Ca2+) concentration can bring in the contraction of adsorbent pores, leading to that some adsorbate could not enter into pores, and the reduction of surface adsorption sites of Ben/Rm/Ps-op50,51,52. Further, it is clear that NaCl, a univalent electrolyte, had less negative impact on TC adsorption than a divalent CaCl2 under identical conditions. Thus, it can be concluded that coexisting ions had adverse effect for TC adsorption onto Ben/Rm/Ps-op.
Dynamic adsorption of TC
The effect of hydraulic retention time (HRT) and packing height on TC removal were investigated, and the result was shown in Fig. 16. It can be seen from the figure that HRT had a great influence on the removal of TC by Ben/Rm/Ps-op. When HRT = 5, 10 and 15 h, the average removal rates of TC by ceramsite got to 69.0%, 77.7% and 81.1% respectively. With the increase of HRT, the removal rate of TC by ceramsite increases. The reason is that the increase of retention time of solution through the packed column will lead to more sufficient contact reaction between ceramsite and TC, which makes the total amount of TC adsorbed by ceramsite increase. In addition, with the increase of HRT, the amount of TC adsorbed by ceramsite increases, but the degree of increase decreases (77.7–69.0% > 81.1–77.7%). This could be interpreted as that with the prolongation of adsorption time, the adsorption sites decrease and the adsorption difficulty increase. Since the HRT of a CWs system is usually longer than 3 days53 and the removal efficiency have already reached 81.1% at HRT = 15 h, the Ben/Rm/Ps-op has the high potential to effectively remove TC as the CWs substrate under a dynamic flow condition.
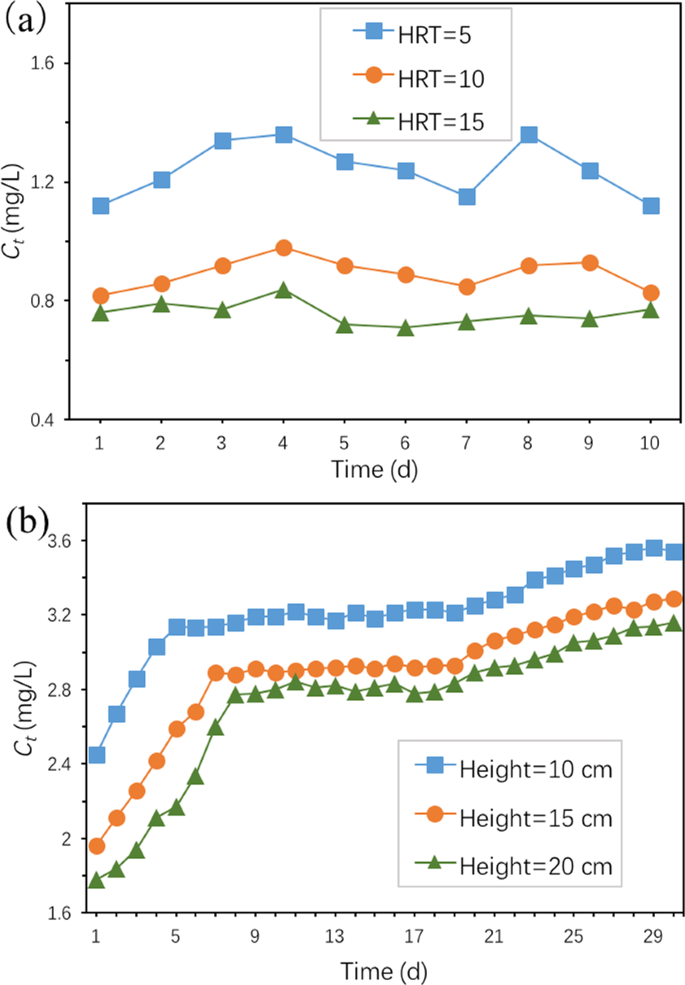
Dynamic adsorption of TC by Ben/Rm/Ps-op ceramsite packed column: (a) effect of HRT, (b) effect of packing height (adsorption condition: C0 = 4 mg/L, ceramic packing height = 30 cm, and HRT = 0.5 h for (b)).
Figure 16b presents TC concentration of Ben/Rm/Ps-op packed column at different packing heights. The TC concentration at different packing heights showed a similar change trend versus the operation time, i.e., rapidly increasing in the initial days, then reaching a relatively stable level, and gradually increasing in the late stage. However, the initial rapidly increasing takes different time. TC concentration quickly increase in the initial 5, 7 and 8 days, respectively for height = 10, 15, 20 cm. This may be attributed to that with the increase of the quality of adsorbent, the adsorption sites on the surface of adsorbent increase, which lead to prolonging the adsorption time of TC. We could also see in Fig. 16b, the lower section played the key role in the adsorption of TC, and it also arrive at saturation first during the continuously operation.
Regeneration of Ben/Rm/Ps-op
Seen in Fig. 17, good adsorption capability of the regenerated adsorbent was still retained after three rounds of sorption-desorption cycles. In addition, TC removal rates for repeated three times were 61.7%, 58.4% and 53.2% respectively. The decrease (2.3–5.2% in every cycle) of removal rate might have been owing to the loss of irreversible occupation of partial-adsorption sites54. Nevertheless, the adsorption amount of ceramsites still remained at a high value (2.13 mg/g, C0 = 80 mg/L) after three consecutive cycles, suggesting the high reusability capability and stability of Ben/Rm/Ps-op for TC removal.
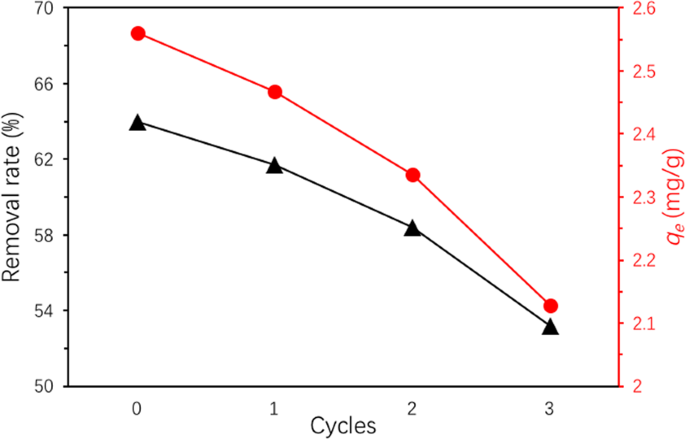
TC removal of recycled Ben/Rm/Ps-op ceramsite (adsorption condition: C0 = 80 mg/L, V = 50 mL, speed = 160 rpm, T = 20 °C, pH = 7, t = 12 h).
Source: Ecology - nature.com
