Tuvalu climate
The mean SST is 29.5 °C (with a range of 0.7 °C/yr). The mean precipitation is 3,493 mm/yr, and the climate is characterized by a rainy season with westerly winds from November to March and a dry season with easterly winds from April to October. The SST data was sourced from NOAA Coral Reef Watch21 (monthly mean SST for 2000–2009) and the Rainfall data was sourced from Taylor’s Atlas22 (the monthly mean precipitation for 1993–2008) (Fig. 3c). Strong El Niño events and/or South Pacific convergence zone (SPCZ) migration disturb the variability in the seasonal precipitation24.
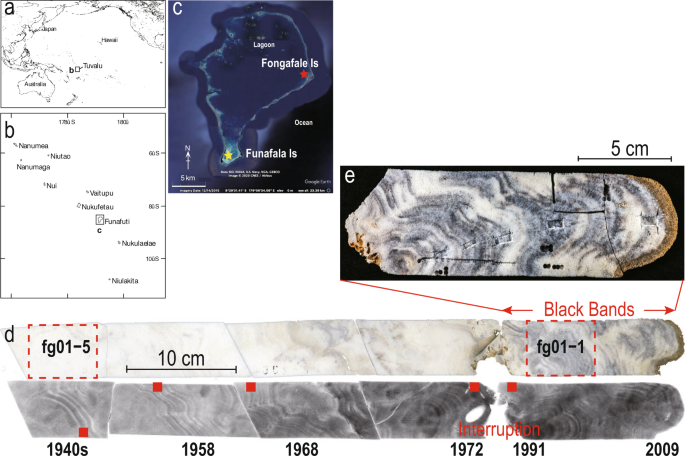
Sampling method and X-radiographs
In March 2009, five coral cores were obtained using an air drill30 from three living colonies of Porites lutea at two sampling sites, namely, Fongafale Island (TV09 fg01–03; 8°31′7.3″S, 179°11′43.9″E, Fig. 1c,d) and Funafala Island (TV09fh-11 and TV09fh-12; 8°37′48.4″S, 179°04′44″E, Figs. 1c and 2c). The TV09 fg03 core used for the DNA analysis comprises the same living colonies of Porites lutea as TV09 fg01 (Table S1). The surfaces of the colonies were found at depths of 1.5 m (fg-01) and 1.7 m (fh-11 and fh-12) in shallow water. The core was cut into a pair of 5-mm-thick slabs, X-radiographs were obtained to determine the annual density bands, and a line along the maximum growth axis was subsampled. A cabinet X-ray system (CMB-2, SOFTEX, Japan) at the Department of Earth and Planetary Science, University of Tokyo, was used to obtain the X-radiographs under the following exposure conditions: X-ray tube voltage of 38 kVp, cathode current of 3.7 mA, and irradiation time of 60 sec.
Chemical instrumental analyses were performed to identify the black contaminant in the fg01 CBBs.
Fluorescent bands
To identify the organic contamination, a photograph of the fluorescent bands was obtained under shortwave ultraviolet rays (excitation wavelengths of 254 and 365 nm, Fig. S2).
Coral organic δ13C analysis
The coral powder samples (20 mg) from the two sampling areas, namely, the top and bottom of each core [two red dotted frames in fg01 (Fig. 1d) and two blue dotted frames in fh11 (Fig. 2c)] were placed in silver containers and pretreated with hydrochloric acid to remove carbonates as described by Tanaya et al. (2018)18. Subsequently, 1 N HCl was added until bubbles were no longer observed, and the samples were dried overnight at 60°C and then for 1 h at 105 °C. The dried samples were wrapped in tin foil. We measured the stable carbon isotope ratio using an elemental analyzer-connected isotope ratio mass spectrometer (FLASH EA 1112/DELTAPlus Advantage, Thermo Electron, Inc.) at Port and Airport Research Institute. The δ13C value per million is reported as the relative deviation from the VPDB. The analytical precision of the isotope ratio mass spectrometer, which was based on the standard deviation of the δ13C values of internal reference replicates, was <0.2‰.
Coral ∆14C measurement (age determination)
We first constructed the ∆14C bomb calibration curve for the Funafuti atoll using the continuous coral annual bands (fh11) obtained from Funafala Island south of the Funafuti lagoon. The eight samples of the fh11 core used for the ∆14C measurement were obtained from eight positions, and the date of each position was determined by counting the continuous annual bands every 5 years from 2005 to 1945 (Fig. 2a,c). The plotting of the ∆14C values per calendar year yielded the ∆14C bomb calibration curve. Subsequently, the ∆14C values obtained for five samples, including both edges of the growth interruption reflected by the noncontinuous annual bands in fg01, were measured and analyzed using the above-mentioned ∆14C bomb calibration curve to obtain the calendar year (Figs. 1d and 2a).
The coupled tips and bases of seven dead branches of Acropora (each approximately 10 to 20 cm in length, Fig. 2b) were then measured. Their ∆14C values were correlated with the 14C bomb curve to obtain the time of death. The 14C measurements were conducted at the University of Tokyo, Japan. The ∆14C values (‰), along with their decay, were calculated according to the standards defined by Stuiver and Polach (1977)31.
Monthly coral δ18O analysis and the seasonal age model
After ultrasonic cleaning, the powdered samples (fg01–1, fh11) used for measuring the δ18O values were drilled from the core at 1.5-mm intervals (almost a monthly scale, Fig. 3b) using a microsampling machine along the maximum growth axis. The stable isotope analyses were performed using a Finnigan MAT252 isotope ratio mass spectrometer equipped with an automated carbonate reaction device (Kiel III) at the University of Tokyo. All isotope values were reported with respect to a Pee Dee Belemnite (PDB) standard. A laboratory working standard (JCp-1) was used to translate the raw measurement results into the PDB scale. The external precision of the δ18O values of the samples of the powdered carbonate standard was 0.03‰ (n = 5, 1 σ).
The seasonal age model was constructed from the monthly mean δ18O data obtained for fh11 from 1978–2009. The fh11 core was appropriate for the construction of the age model due to its continuous healthy state. The maximal (minimal) δ18O value in a seasonal cycle was anchored as September (March), which was the month with the lowest (highest) SST and precipitation in Tuvalu21,22 (Fig. 3c,d). The color of the coral skeleton at each subsampling position used for the δ18O measurement was identified by visual inspection (Fig. 3a,b). The information on the color and location for an annual band was superimposed with the seasonal δ18O age model (Fig. 3d).
XRD analysis
The minerals in the coral CBBs were examined by X-ray diffraction analysis. Ten grams of the CBB coral powder was decomposed in 400 mL of acetic acid (1.5 M) over 4 days, and a black residue was obtained. The sample (fg01–1 CH3COOH residue) was used for X-ray diffraction analysis [X’Pert PRO MPD (PANalytical) (Cu, 45 kV, 40 mA)] at an angle between 3 and 70° (2θ) at a rate of 2° per minute (Table S2).
ICP-MS
To determine the concentrations of heavy metals, 100 mg of coral powder from the two sampling areas, namely, the top and bottom of each core [two red dotted frames in fg01 (Fig. 1d) and two blue dotted frames in fh11 (Fig. 2c)], was dissolved in 2 mL of concentrated HNO3 (68%) overnight at 180°C. The black residue from fg01–1 was obtained and completely dissolved by the addition of 10 mL of 2% HNO3. The solution was evaporated, and the residue was redissolved in 2% HNO3. The elements were determined by ICP-MS (Agilent 7700) using indium as the internal standard element. The concentrations of the heavy metal elements included in JCp-1, which was used as a standard coral, were based on those reported by Inoue et al. (2004)32 (Table 1).
XANES and μ-XANES
In the analysis of the ICP-MS results, we focused more on the iron content than those of the other elements. We attempted to derive the relationship between the iron redox state and the color gradation in CBBs. A XANES analysis was performed to verify the iron redox state inside the microscopic CBB area.
Iron K-edge XANES analyses were conducted at two beamlines, BL-12C and BL-4A, using an incident X-ray with beam sizes of 0.6 (V) × 0.6 (H) m2 and 5 (V) × 6 (H) μm2, respectively, at the Photon Factory, KEK (Tsukuba, Japan)33,34. A thin section of the coral sample was prepared for the analyses. XANES at BL-12C was employed to estimate the average Fe species within the mm-size band at the surface of the coral sample (Fig. 4d–f). The beam position on the sample was adjusted using an infrared laser beam adjusted to the position of the X-ray beam on the sample to obtain the XANES in normal white areas and in the black and reddish-brown bands. The thin-section sample was fixed to a sample holder oriented at an angle of 45° to the orthogonal direction of the beam. The iron Kα fluorescence X-ray was measured with a 19-element Ge solid-state detector (Canberra, USA).
In contrast, μ-X-ray fluorescence (XRF) mapping and μ-XANES analyses were conducted at BL-4A to obtain the distribution of Fe at a 5-μm spatial resolution (Fig. S1a–e). The incident beam was focused on the above-mentioned size by a Kirkpatrick–Baez mirror system. The sample, which was fixed at an angle of 45° to the orthogonal direction of the beam, was scanned at steps of 5 μm to obtain the μ-XRF mapping data. The fluorescence X-rays of Fe and other elements were measured using a silicon drift detector (Amptek, Inc.). The XRF mapping data were employed to select specific spots in the white, black, and reddish-brown areas (bands) for measurement of the μ-XANES spectra.
SEM observations
To confirm the existence of pyrite in the CBBs, as indicated in the XAFS results, SEM observations were conducted. The residue after decalcification of the CBBs by acetic acid was prepared for SEM examination. The particles in the residue were coated with carbon tape and analyzed using a Hitachi S-4500 SEM with a cold-field emission gun. The iron sulfide was observed with secondary electron images at an acceleration voltage of 2–10 kV.
Microbial signatures and DNA analysis
The microbial signatures in the coral skeletons were analyzed based on the SSU rRNA gene sequences. We sampled four parts of the CBBs in the coral skeletons (fg03–1), and the sections were then stored at room temperature (RT) for several years. The four subsamples obtained from the top of the fg03–1 core and from depths of 1.5, 5, and 20 cm were named coral 1, coral 2, coral 3, and coral 4, respectively (Fig. S3a).
After the surfaces of the subsamples were flame-sterilized, the samples were fractured in an aseptic plastic bag with a vice. Environmental DNA was extracted from 0.2 g of the fractured samples using a commercial DNA extraction kit (Power Soil DNA, QIAGEN) according to the manufacturer’s instructions. For the evaluation of contamination during the analytical procedure, we extracted negative-reference DNA from autoclaved glass beads, as described above. The V4 and V5 regions of the SSU rRNA genes in the extracted DNA were amplified by polymerase chain reaction with Gflex DNA polymerase (Takara Bio) and the Univ 530 F and Univ 907 primers35, which are Illumina sequencing primers, using the following program: 30 cycles of 96 °C for 25 sec, 52 °C for 45 sec, and 72 °C for 1 min. After adaptor and index sequences were added by further PCR36, the purified SSU rRNA gene amplicons were sequenced by MiSeq using 300-bp paired-end reads. The prokaryotic sequences were combined with both P7 and P5 reads, qualified and searched for 97% OTUs using the USEARCH program37, and each OTU was classified based on the SILVA123 database38 using the QIIME program39. For all eukaryotes, only the P7 side sequences were used for the analysis, and after classification, the prokaryotic OTUs were removed. The microbial community structures were stoichiometrically analyzed with the vegan package40 in the R program41.
The MiSeq dataset was deposited in the DDBJ Sequence Read Archive (DRA) database with the access number DRA007783.
Source: Ecology - nature.com
