Bacterial strains and culture conditions
Bacterial strains are listed in Table 1. Fusobacterium nucleatum, Prevotella melaninogenica, Veillonella parvula, and Streptococcus parasanguinis were derived from the American Tissue Type Collection and obtained from Microbiologics (St. Cloud, MN). Rothia mucilaginosa was obtained from the Japan Collection of Microorganisms (Riken, Tokyo). Staphylococcus aureus, Escherichia coli and Pseudomonas aeruginosa were obtained from D.K. Newman (California Institution of Technology), and Burkholderia cenocepacia was obtained from C.H. Mohr (University of Minnesota). Achromobacter xylosoxidans and Stenotrophomonas maltophilia were isolated from individuals undergoing treatment at the UMN Adult CF Center. Aerobes were maintained on Luria-Bertani (LB) agar, while anaerobes were maintained on Brain-Heart Infusion (BHI) agar supplemented with a 5% vitamin K-hemin solution (Hardy Diagnostics #Z237) in an anaerobic chamber (Coy) under a 90% N2/5% CO2/5% H2 atmosphere. Bacterial growth curves were performed in triplicate in BHI broth containing either 6 mM L-azidohomoalanine (AHA) or 6 mM L-methionine (MET).
Clinical sample collection
Spontaneously expectorated sputum was collected from stable subjects with cystic fibrosis during routine outpatient visits to the Adult CF Center at the University of Minnesota. All subjects provided written informed consent prior to sample collection as approved by the UMN Institutional Review Board (Study #1403M49021). Upon consent, each subject provided a single sample that was collected in a sterile 50 mL conical tube. Cohort data are shown in Supplementary Table 1.
Bioorthogonal non-canonical amino-acid tagging (BONCAT)
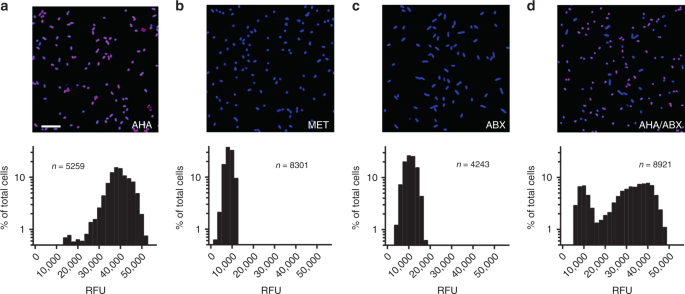
BONCAT labeling was performed as described by Hatzenpichler40 with modifications. Briefly, for imaging of lab-grown cultures (see below), P. aeruginosa, B. cenocepacia, A. xylosoxidans, S. maltophilia, R. mucilaginosa, E. coli, and S. aureus were grown aerobically in LB, while S. parasanguinis, V. parvula, P. melaninogenica, and F. nucleatum were cultured under anaerobic conditions in BHI broth supplemented with hemin and vitamin K. Cultures were grown overnight and diluted 1/100 in 10 mL of fresh medium. Upon reaching mid-log phase, cultures were supplemented with either 6 mM AHA or 6 mM methionine (MET) and incubated for 3 h at 37 °C. When indicated, an antibiotic cocktail consisting of chloramphenicol (30 µg mL−1), tetracycline (200 µg mL−1), and tobramycin (10 µg mL−1) was added 30 min prior to AHA addition to arrest protein synthesis. After incubation, cultures were pelleted via centrifugation (5 min at 10,000 × g), fixed in 4% paraformaldehyde (PFA) for 2 h at 4 °C, resuspended in phosphate buffered saline (PBS, pH 7.4) and stored at 4 °C. All growth curves were performed in triplicate (n = 3).
Sputum samples used for imaging were treated with cycloheximide (100 µg mL−1) upon expectoration and divided into three equal volumes. Aliquots were supplemented with either AHA (6 mM), methionine (6 mM), or AHA (6 mM) with chloramphenicol/tetracycline/tobramycin as described above, incubated at 37 °C for 3 h, followed by fixation in 4% PFA overnight at 4 °C. Samples collected for flow cytometry were divided into five 300−500 µL aliquots. One control aliquot was immediately frozen at −80 °C and later used for conventional 16 S rRNA gene sequencing. Cycloheximide (100 µg mL−1) was added to the remaining four aliquots, three of which were supplemented with AHA (6 mM). One was also supplemented with MET (6 mM), followed by incubation of all samples at 37 °C for 3 h. Labeled samples (and unlabeled controls) were then fixed in 4% PFA for 2 h, pelleted via centrifugation (5 min at 10,000 × g), resuspended in PBS, and stored at 4 °C.
Click chemistry
For each bacterial culture and sputum sample, strain-promoted azide-alkyne cycloaddition (click chemistry)63 was also performed as described previously40. Briefly, fixed biomass was pelleted, resuspended in freshly prepared 2-chloroacetamide (100 mM) and incubated for 1 h at 46 °C, shaking at 450 r.p.m. in the dark. Cy5-dibenzocyclooctyne (Cy5–DBCO) (Click Chemistry Tools) was then added to a final concentration of 10 µM followed by incubation for 30 min at 46 °C. Samples were washed three times in PBS and further processed for imaging and flow cytometry (see below).
SDS-PAGE
P. aeruginosa was grown to late-exponential phase as described above and supplemented with varying concentrations of AHA (100 µM–1 mM) for 1 h prior to fixation. Similarly, P. aeruginosa was grown in the presence of varying ratios of MET:AHA. Bacterial pellets were resuspended in extraction buffer (1% sodium dodecyl sulfate, 50 mM NaCl, 100 mM EDTA, 1 mM MgCl2 at pH 8.4) and boiled for 30 min. After boiling, samples underwent click chemistry as described above. A mixture of methanol:chloroform:water (12:3:8) was then added to each sample followed immediately by centrifugation for 5 min at 16,000 × g. The water/methanol phase was then carefully removed, and protein recovered from the interface was washed three times in 100% methanol. After the final wash, supernatant was removed and pellets were air dried. Protein was resuspended in 100 μl 1X LDS (lithium dodecyl sulfate) sample buffer and denatured at 70 °C for 10 min. Ten microliter of protein was run on an 8% Bis-Tris gel with MOPS (3-(N-morpholino)propanesulfonic acid)-sodium dodecyl sulfate (SDS) running buffer to which sodium bisulfite had been freshly added. Gels were run at 150 V, fixed for 30 min in a 1:2:7 acetate:methanol:water mix, and imaged with a Typhoon FLA 9500 scanner (GE Healthcare) using an excitation wavelength of 635 nm.
Fluorescence microscopy
BONCAT-labeled bacterial cultures and sputum were spotted on Superfrost Plus microscope slides and counterstained using 1.6 µM STYO64 in PBS. Slides were then washed twice in PBS, mounted using Prolong Diamond Antifade and imaged using an Olympus IX83 microscope with a transmitted Koehler illuminator and a ×60 oil objective lens (NA 1.42). Images were captured on a Hamamatsu ORCA-Flash4.0 V2 digital CMOS camera, and post-acquisition image analysis was performed using cellSens software (v.1.14, Olympus). SYTO64 and Cy5 were visualized using excitation/emission wavelengths of 562 nm/583 nm and 628/640 nm, respectively.
Image analysis was performed using FIJI64. Briefly, images were subjected to background subtraction using a rolling ball radius of 150 pixels. Individual cells were identified by adjusting thresholds of SYTO64 images using Huang’s fuzzy thresholding method65. Images were also segmented using a watershedding algorithm that assumes each maximum belongs to a discrete particle. The Analyze Particles operation was used to detect and record locations of individual bacterial cells in a given image. For clinical samples, particles were constrained between 100 and 1000 pixels to minimize detection of host cells and sputum debris. Mean pixel intensity at 647 nm (Cy5) was then quantified for each assigned particle. Imaging experiments were performed in triplicate for each bacterial species, and ten images for each sample were captured (n > 1000 particles per sample).
Flow Cytometry
Prior to sorting, Cy5–DBCO-labeled sputum was collected by centrifugation and counterstained with 1.6 µM SYTO9 (Invitrogen) in PBS for 30 min. Sputum samples were also stained with 1 µg ml−1 of phycoerythrin (PE) anti-human CD45RO in PBS (BioLegend) for 30 min to stain activated and memory T cells, some B-cell subsets, activated monocytes/macrophages, and granulocytes. All samples were washed in PBS containing 1% BSA and 1 mM EDTA, homogenized using 16- and 22-gauge needles and filtered through a 40 μm cell strainer. To separate AHA + and AHA- bacterial populations, clinical samples were analyzed and sorted on a FACSAriaIIu Cell Sorter (Beckton Dickinson) with a 70μm nozzle at 70 psi. Contaminating human leukocytes staining positive for PE anti-human CD45RO were excluded from bacterial populations of interest in the initial sorting gate (Supplementary Fig. 9). An AHA- control was then matched to each sample to determine the level of non-specific Cy5–DBCO binding and was used to establish Cy5+ (i.e., active) and Cy5− (i.e., inactive) sorting gates. Forward scatter and side scatter gates were then applied to remove large particulates and debris, and liberal doublet discrimination was used to minimize loss of bacterial aggregates. Collected samples were stored at 4 °C and processed within 24 h. FlowJo software (v.10.5.0) was used for data analysis and presentation.
Cy5+ and Cy5− sorted populations were assessed for post-sort purity by flow cytometry, while collected fractions were visualized by anti-Cy5 immunostaining. To do so, BONCAT-labeled sputum samples were spread across Superfrost Plus microscope slides using a sterile pipette tip and allowed to air dry for 30 min. Slides were washed 3X in PBS and blocked using 1% goat serum in PBS for 1 h, followed by treatment with an anti-Cy5 monoclonal antibody (C1117, Sigma–Aldrich) (1:100 dilution) in incubation buffer (1% goat serum, 0.3% Triton X100 and 10 mg mL−1 bovine serum albumin) overnight at 4 °C. Slides were washed 3×, and incubated with Cy3 goat anti-mouse secondary antibody (1:250) in incubation buffer for 45 min. Slides were washed 2×, counterstained using 0.1% Hoescht in PBS and mounted using Prolong Diamond Antifade. Slides were imaged as described above.
DNA extraction
Genomic DNA (gDNA) was extracted using a modified phenol-chloroform method previously described66. Briefly, FACS-sorted samples were collected onto 0.22 µm polycarbonate membranes (EMD Millipore), which were then transferred to 1 mL of TENS buffer (50 mM Tris-HCl [pH 8.0], 20 mM EDTA, 100 mM NaCl, 1% SDS) containing lysozyme (0.2 mg mL−1) and lysostaphin (0.02 µg mL−1) and incubated at 37 °C for 30 min. Sodium dodecyl sulfate (SDS) and proteinase K were added to final concentrations of 1% and 1.2 mg mL−1, respectively, and samples were incubated overnight at 55 °C. Enzymes were deactivated by incubating samples at 90 °C for 30 min, and sample liquid (including membrane) was transferred to a 5 mL conical tube containing an equal volume of phenol:chloroform:isoamyl alcohol (P:C:I, 25:24:1, pH 7.9), which dissolved the membrane. The resulting sample was then split into two Lysing Matrix E tubes (MP Biomedicals) and processed twice by bead beating for 30 seconds. Contents of both tubes were recombined and centrifuged at 3200 × g for 20 min. The aqueous layer was transferred to a new tube and P:C:I extraction was repeated, followed by a chloroform:isoamyl alcohol (24:1) extraction. A 1/10th volume of sodium acetate (3 M, pH 5.2) was then added and nucleic acid was precipitated using one volume of isopropanol followed by centrifugation at 21,130 × g for 20 min. Supernatant was removed, the pellet was washed with 80% ethanol, and centrifuged at 21,130 × g for 10 min. Finally, the gDNA pellet was air dried, resuspended in 10 mM Tris buffer (pH 8.0), and stored at −80 °C until sequencing.
DNA sequencing and analysis
gDNA derived from sputum samples was submitted to the University of Minnesota Genomics Center (UMGC) for 16 S rRNA gene library preparation using a two-step PCR protocol67. The V4 variable region was amplified using V4_515F and V4_806R primers with common adapter sequences (5’-TCGTCGGCAGCGTCAGATGTGTATAAGAGACAGGTGCCAGCMGCCGCGGTAA-3’, 5’-GTCTCGTGGGCTCGGAGATGTGTATAAGAGACAGGGACTACHVGGGTWTCTAAT-3’), followed by the addition of dual indices and Illumina flow cell adaptors in a secondary amplification using primers 5’-AATGATACGGCGACCACCGAGATCTACACXXXXXXXXTCGTCGGCAGCGTC-3’ and 5’-CAAGCAGAAGACGGCATACGAGATXXXXXXXXGTCTCGTGGGCTCGG-3’. Amplicons were sequenced on an Illumina MiSeq using TruSeq (v.3) 2 × 300 paired-end technology. FACS sheath fluid and DNA extraction reagent control samples were also submitted for sequencing. These control samples did not pass quality control steps due to DNA content below detection thresholds but were incorporated into downstream analyses. An average of 67,793 sequences per sample were obtained. Sequence data are available at NCBI sequence read archive under Bioproject ID PRJNA604587.
Sequence quality was assessed using the DADA2 R package (v.1.2.1)55. Cutadapt68 was used to remove primer and Illumina adapter sequences, with size filtering set to a minimum and maximum of 215 bp and 285 bp, respectively. DADA2 functions were used to trim and filter sequences, model and correct Illumina sequence errors, align paired-end sequences, and filter chimeric reads. Specifically, forward and reverse sequences were trimmed to 250 bp and 200 bp, respectively, and a post-trimming minimum length filter of 175 bp was applied. All other DADA2 pipeline parameters were run using default options. Resulting amplicon sequence variants (ASVs) were assigned taxonomy using RDP classifier69 and the SILVA SSU database (Release 132, December 2017)70,71. Species-level taxonomy was assigned using the DADA2 addSpecies function only if an ASV unambiguously matched a sequence in the SILVA-132 database. A phylogenetic tree was approximated using the phangorn R package72 and sequences were aligned using DECIPHER. The phangorn package was then used to construct a neighbor-joining tree, which was then used to fit a GTR + G + I maximum likelihood tree.
The Decontam package (v.1.2.0)73 was used to reproducibly filter out contaminant sequences. The function isContaminant was used with method = “either” and a probability threshold set to 0.5. Frequency was determined from 16 S qPCR data obtained from UMGC. A total of 28 taxa were removed from the dataset based on frequency and prevalence in the sample when compared with DNA extraction control. An average of 40,773 sequences were recovered from DADA2/Decontam analysis corresponding to 357 ASVs. 79.55% of ASVs were assigned to the genus level, and 22.97% had an unambiguous species assignment.
ASV count data, taxonomic assignment, and the phylogenetic tree were used within the analysis framework of the Phyloseq R package (v.1.26.0)74,75,76,77,78,79,80. ASVs were filtered when they did not belong to the domain Bacteria, or when not assigned taxonomy at the phylum level. Phyla that had low prevalence and abundance (including Acidobacteria, Chloroflexi, Dependentiae, Planctomycetes, and Synergistetes) were removed from the dataset, as were singleton ASVs or those that did not belong to the original or input samples. Finally, ASVs at a relative abundance below 0.001 (0.1%) were removed. After filtering there remained 45 unique taxonomic assignments with 22 assigned at the species level. Fold-change in relative abundance for each ASV were calculated between sort input and sort-positive fractions for each study subject. For all figures, a specific epithet was used when assigned exactly from the SILVA database
Reporting summary
Further information on research design is available in the Nature Research Reporting Summary linked to this article.
Source: Ecology - nature.com
