Water withdrawal
In the year the system transformation began (1989), total water withdrawal in the Oder River basin was 6.21 km3, including 4.55 km3 for production purposes, 1.03 km3 for the exploitation of water supply systems, and 0.63 km3 for the purposes of agriculture and forestry. In successive years, a statistically significant downward trend in water consumption was found. The directional coefficient of the built-in linear regression model indicates that each year there was an average decrease in water consumption of 57.484 million m3. In 2017, water consumption was only 61% of the 1989 volume (Fig. 1).
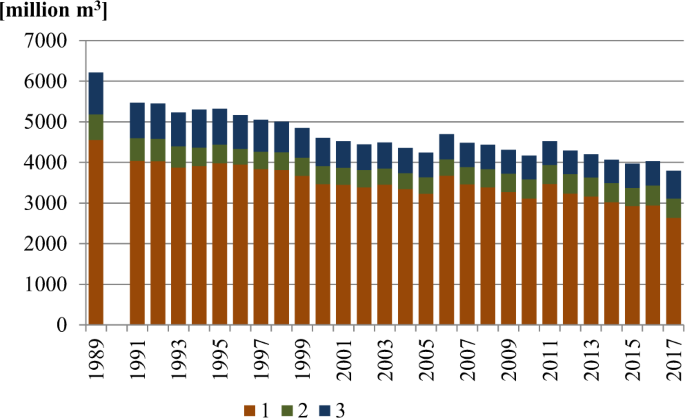
Water withdrawal for the needs of the national economy and population in the Oder River basin for the purposes of: 1 – production, 2 – agriculture and forestry, 3 – exploitation of the water supply system.
In the years 1989–2017, water withdrawal was reduced particularly for production purposes – from 4.55 to 2.63 km3, i.e. by 42%, as well as for the exploitation of the water supply system (from 1.03 to 0.69 km3, i.e. by 33%). Changes in water withdrawal for agriculture and forestry, in spite of its overall reduction from 0.63 to 0.48 km3 (i.e. by 24%), were not uniform. In the years 1989–2006, water withdrawal decreased (to 0.40 km3), and in the following years it slowly increased to 0.48 km3.
Industrial and municipal sewage treatment
Approximately a dozen main possibilities of water use have been recognised so far8. A strong dependency was also determined between the amount of water withdrawn and the amount of sewage. The highest amount of sewage originates from the production and municipal sector. The amount of agricultural sewage is difficult to determine because a considerable portion constitutes so-called non-point source pollution. Not all uses of water, however, directly contribute to generating sewage (e.g. sprinkling irrigation and watering, preservation of aquatic life). Moreover, a portion of water is subject to evaporation. Due to this, the amount of sewage is considerably smaller than the amount of withdrawn water. In the case of the Oder River basin, the volume of sewage introduced to rivers in the years 1989–1991 constituted 26.9–24.3% of the volume of water withdrawal, and in the years 2015–2017 approximately 21.5%. Like water consumption, the amount of wastewater in the analysed period showed a downward trend. However, this was less than half the size, at an average of 20.7 million m3 per year (Fig. 2). For the environment, however, the degree of treatment of sewage is a more important parameter than its amount. It depends on the technologies applied in sewage treatment plants. The technologies changed depending on the level of development of science and technology, as well as on the available financial resources.
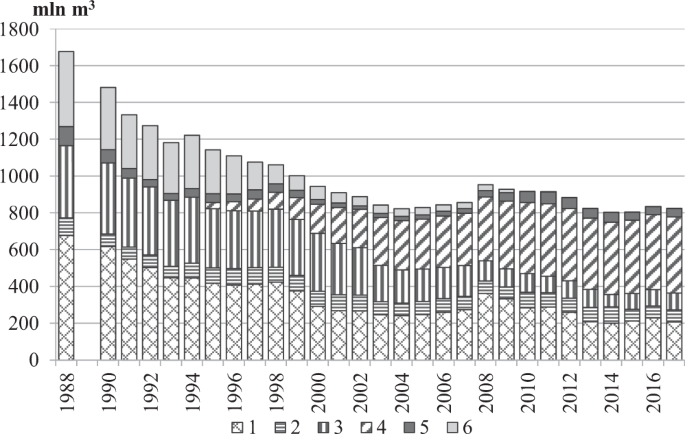
Changes in the amount of sewage discharged to rivers in the Oder River basin, and types of its treatment. Explanation: treated sewage (1 – mechanically, 2 – chemically, 3 – biologically, 4 – with increased nutrient removal); untreated sewage (5 – from production plants, 6 – from sewage networks).
In the Oder River basin, three methods of sewage treatment had been applied up until 1994, namely: physical, chemical, and biological. In 1995, the introduction of the modern method with increased biological nutrient removal commenced. Throughout the period 1989–2017, several characteristic tendencies of changes in sewage treatment were observed (Fig. 2):
a strong decrease in the amount of sewage subject to physical treatment (from 0.68 to 0.21 km3).
a strong decrease in the amount of sewage subject to biological treatment (from 0.39 to 0.09 km3).
a slight decrease in the amount of sewage subject to chemical treatment (from 0.10 to 0.07 km3).
a strong increase in the amount of treatment with increased nutrient removal from 1995 (from 0.03 to 0.41 km3).
In the years 1988–2017, the amount of untreated sewage was considerably reduced, from 510 to 50 million m3, with sewage from sewage networks constituting the majority of al sewage. Currently, almost 100% is treated, and only 0.04 km3 of sewage from production plants remains untreated (Fig. 2).
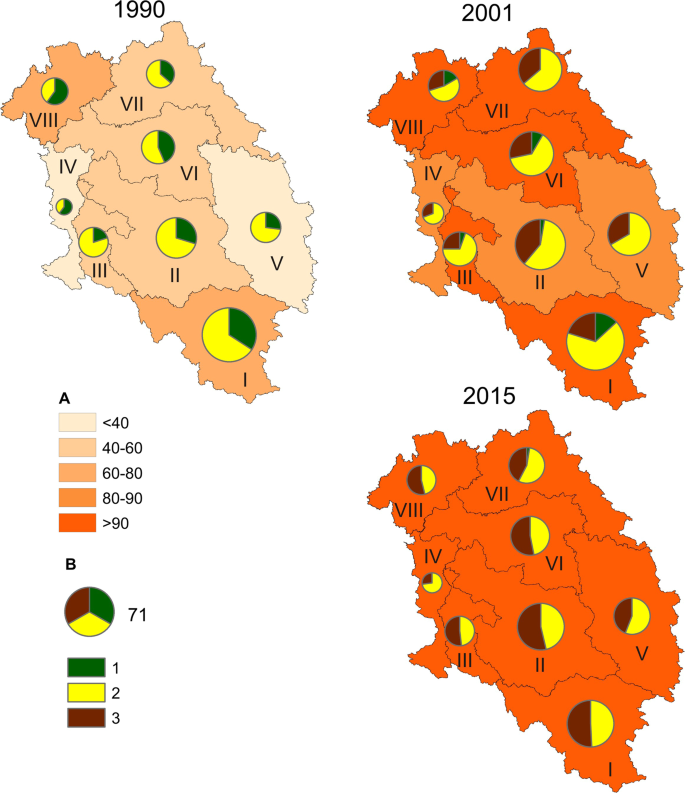
Changes in the amount and types of sewage treatment occurred in different ways in particular parts of the Oder River basin, where eight main hydrographic regions were designated. The names and numbers of the regions (from 1 to 8), as well as the most important data regarding them are presented in Table 1.
In 1990, particular hydrographic regions of the Oder River basin had a high variability of contribution of treated sewage in the total amount of sewage: from <60% in region 5 to 80–90% in regions 2, 3, and 4 (Table 1, Fig. 3). Physical sewage treatment was predominant in all regions. Its contribution in region 6 was as much as 80.5%. Biological sewage treatment was predominant in region 2 (62%), and was applied to the lowest degree in regions 8 and 4 (14% and 17%).
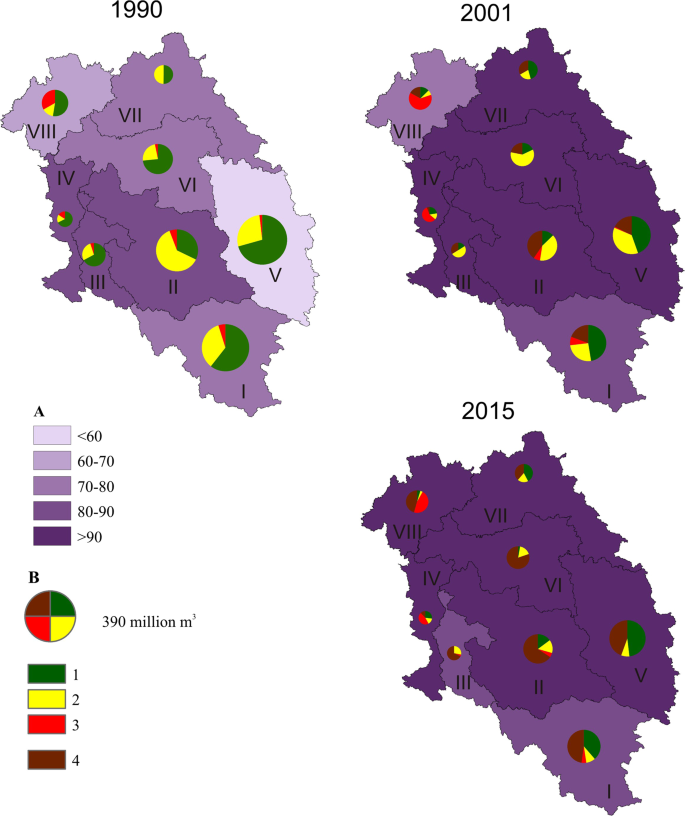
Changes in the amount of treated sewage and types of sewage treatment in hydrographic regions of the Oder River basin. (A) Percent of treated sewage; (B) amount of treated sewage and type of treatment: 1 – mechanical treatment, 2 – biological treatment, 3 – chemical treatment, 4 – treatment with increased nutrient removal.
In the years 1990–2001 in the analysed regions, the contribution of treated sewage in the total amount of sewage levelled off. In six regions, the share of treated sewage increased by >90%. It was lower only in regions 1 and 8, where it equalled, respectively, 80–90% and 70–80% (Fig. 3). In all regions, the amount of sewage subject to physical treatment considerably decreased (by half on average), as well as the amount of sewage subject to biological treatment. Mechanical and biological sewage treatment was replaced with treatment with increased nutrient removal. In some regions (e.g. 3 and 2), this modern treatment method covered more than 40% of sewage already in 2001.
In 2015, the share of treated sewage in the total amount of sewage averaged 94.6%, and only in two regions (1 and 3) was it somewhat lower than 90%. Sewage treatment with increased nutrient removal was dominant almost everywhere. In regions 2, 3 and 6, it was, respectively, 66, 68 and 83%.
Sewage treatment in cities
The Oder River basin currently includes 386 cities within the territory of Poland (19 more than in 1990). The vast majority (more than 60%) are small cities with a population of <10,000. The total number of residents of all the cities, however, is high, at 8.4 million. Due to this, sewage treatment in the cities of the Oder River basin is a very important element of sewage management.
In the years 1990–2017, the number of cities with sewage treatment plants increased considerably. The technology, and therefore efficiency of sewage treatment, also substantially changed. In 1990, waste treatment plants supported only 190 out of the 367 cities existing at the time. In 2017, almost all cities (99.2%) had treatment plants (Fig. 4). The fastest increase in launching new sewage treatment plants (on average 13 cities per year) occurred in the years 1992–2002. It is worth emphasising that irrespective of the increase in the number of cities with sewage treatment plants, in the majority of the remaining cities the treatment plants were modernised. This, however, is a separate issue not discussed in this paper. These positive changes occurred despite a decrease in total number of treatment plants. Mechanical treatment plants and outdated biological treatment plants were closed. They were replaced by modern treatment plants with enhanced nutrient removal and much higher throughputs.
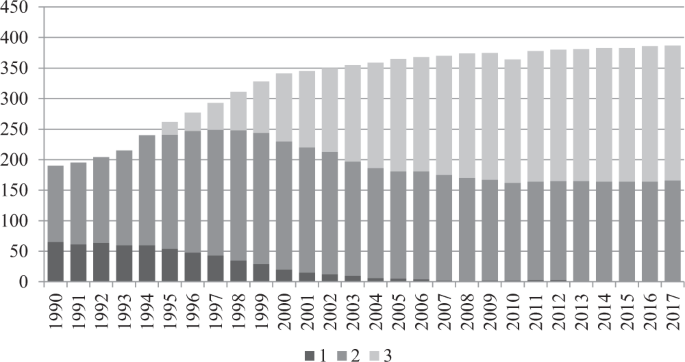
Changes in the number of cities with sewage treatment plants and types of sewage treatment technology in the years 1990–2017. Explanation: 1 – mechanical treatment plants; 2 – biological treatment plants; 3 – treatment plants with increased nutrient removal.
In the years 1990–2017, three main tendencies concerning cities were observed, depending on the sewage treatment technology (Fig. 4):
a decrease in the number of cities with physical sewage treatment plants from 65 (1990) to 1 (2013) as a result of launching new treatment plants in cities and introducing new technologies.
an increase in the number of cities with biological treatment plants in the period 1990–1997, followed by a decrease (in the years 1998–2017).
an increase in the number of cities with treatment plants with increased nutrient removal in the period 1995–2017.
The aforementioned changes had a different course in particular hydrographic regions of the Oder River basin. In 1990, the share of cities supported by sewage treatment plants was variable, from <40% in regions 4 and 5 to 60–80% in regions 1 and 8 (Fig. 5). In almost all regions (except for 4 and 8), the largest single group of cities was those with biological sewage treatment plants.
Changes in the number of cities with sewage treatment plants and types of treatment plants in hydrographic regions of the Oder River basin. (A) Percent of cities supported by sewage treatment plants; (B) number and type of sewage treatment plants: 1 – physical treatment plants, 2 – biological treatment plants, 3 – treatment plants with increased nutrient removal.
In 2001, the number of cities supported by sewage treatment plants increased considerably throughout the analysed area. In regions 1,3,6,7 and 8, the share of such cities constituted more than 90% of their total number. In cities of all regions, biological sewage treatment was predominant, and 37% of cities were supported by treatment plants with increased nutrient removal. The role of physical treatment substantially decreased. It did not occur at all in several regions (4, 5, 7).
In 2015, almost all cities were equipped with treatment plants (Fig. 5). The highest number of cities (219) had treatment plants with increased nutrient removal or biological treatment plants (163). A physical treatment plant functioned in only one city.
Effect of water and sewage management changes on Oder River and Baltic Sea water quality
A decrease in the amount of sewage and increase in the reduction of contaminants in sewage improved the quality of rivers. The concentration of all chemical and biological substances decreased, and physical parameters monitored in National Environmental Monitoring studies improved. The changes were (and still are) very evident not only in the lower section of the Oder River before its inflow to the Szczecin Lagoon, but also in all its tributaries. The lower section of the Oder River is recognised as the most representative, however, especially since water quality along this section determines the load of contaminants introduced to the Baltic Sea from the entire basin.
Since the early 1990s, nutrient concentrations have decreased significantly. Regression analysis of nitrogen and phosphorus values show a statistically significant downward trend. In the municipality of Krajnik (59 km before the inflow of the Oder to the Szczecin Lagoon), the mean annual value of total nitrogen concentration decreased from 4 l.82 to 2 l.78 mg·dm−3 (Fig. 6).
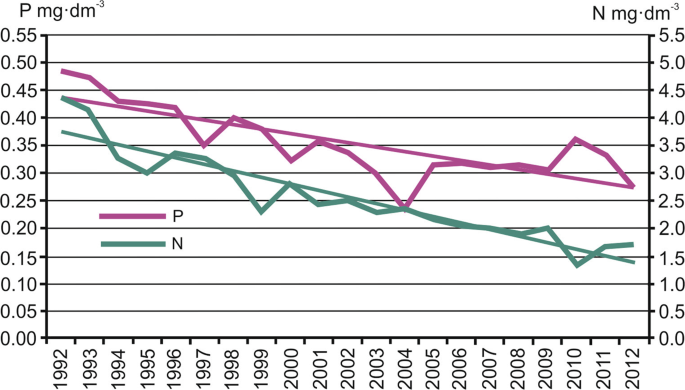
Changes in mean nitrogen and mean phosphorus concentrations in the Oder River in the municipality of Krajnik. Data according to the National Environmental Monitoring (2015).
Nitrogen concentration did not decrease evenly over the period. It was considerably faster in the first part of the period, and in the years 1992–2004 averaged 0.184 mg·dm−3. After 2005, nitrogen concentrations stabilised.
A similar tendency of changes was also observed for phosphorus. Its concentration decreased from 0.434 to 0.169 mg·dm−3 in the years 1992–2012 (Fig. 6). As with nitrogen, the fastest decrease in phosphorus concentration occurred in the first years of the water and sewage management being improved. In the period 1992–1999, phosphorus concentration decreased every year by an average of 0.026 mg·dm−3, and in the next period by only 0.008 mg·dm−3.
The decrease in total phosphorus and total nitrogen concentrations was not systematic in each consecutive year. It was largely dependent on the discharge volume of the Oder River in a given year.
As mentioned above, the pollution of rivers was reduced throughout the basin. An example is a decrease in the concentration of biochemical oxygen demand (BOD) – an indicator of water pollution with municipal sewage – in the Oder River in Wrocław. In the 1980s, BOD concentration averaged 9.2 mg O2·dm−3 annually. In 1992–2016 there was a statistically significant downward trend in BOD concentration; during this period, the total BOD decrease was over 6 mg O2·dm−3 (from 9.10 to 2.00 mg O2·dm−3). As in previous cases, the fastest decrease in BOD concentration occurred at the beginning of the analysed period, i.e. in the years 1992–2001, when it averaged 0.72 mg O2·dm−3 per year. Notice also that from 2005, BOD concentration in the Oder River (Wrocław) was lower than the threshold value determined for class I and abiotic type 21 signifying a great lowland river (according to the EU Water Framework Directive).
Pollutant loads depend both on their concentration and on water volume. Due to this, a decrease in concentrations has not always been accompanied by a reduction in pollution load. In the case of total nitrogen load, years of considerable reduction alternated with years of high loads (Fig. 7).
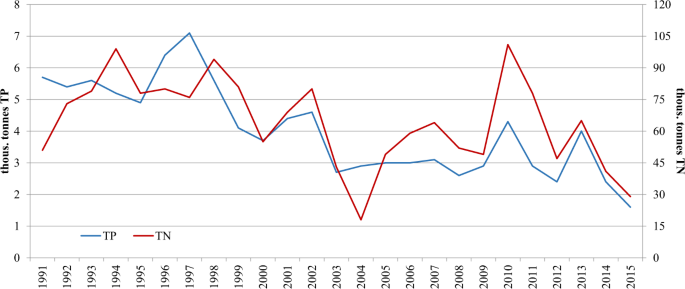
Total nitrogen and total phosphorus load introduced to the Baltic Sea through the Oder River in the years 1990–2015. Elaboration based on data of the Central Statistical Office and IMGW-PIB.
In spite of an evident tendency for a decrease in total nitrogen load introduced in the Baltic Sea in the years 1990–2015, there were years in which the load was highest and did not correspond with the general direction of changes. Such a situation occurred in 2010, when water outflow in the Oder River was the highest in 30 years, at 25.54 million m3, i.e. more than 8 million m3 more than the mean annual value (according to data of IMGW-PIB). It is therefore not surprising that the total nitrogen load introduced to the Baltic Sea in 2010 was more than 100,000 tonnes, and was among the highest in history. The lowest TN load (26,880 tonnes) was introduced to the sea in 2015.
The rate of decrease in total phosphorus load introduced to the sea was faster and more uniform (Fig. 7). The highest TP load was introduced in 1997 (7,110 tonnes), although water outflow was approximately 12% lower than in 2010. In this case, phosphorus concentration was of crucial importance. In 1997 it was more than double what it was in 2010 (Fig. 6). The lowest amount of total phosphorus (1,520 tonnes) was introduced to the Baltic Sea in 2015.
Similar changes occurred in the biochemical oxygen demand load (BOD). The rate of decrease in the BOD load, however, was lower than the course of changes in TN and TP loads. The highest BOD load (118,230 tonnes) occurred in 1997, and the lowest (28,950 tonnes) in 2015. The mean rate of decrease in the BOD load introduced to the Baltic Sea was 1,730 tonnes year−1.
Source: Ecology - nature.com
