Termite collection
R. speratus colonies were collected from secondary forests in Kyoto and Shiga Prefectures, Japan, from April 2018 to April 2020 (colonies A–L). Colony E was collected from Kutsuki, Takashima City, Shiga Prefecture. Colonies A and B were collected in Kita-ku, Kyoto City, Kyoto Prefecture. Colony H, I, and J were collected in Amarube-cho, Kameoka City, Kyoto Prefecture. The remaining colonies were collected in Ukyo-ku, Kyoto City, Kyoto Prefecture.
Ethics
No specific permits were required for the described field activities. No specific permissions were required to access or sample termite colonies, as these colonies were collected from unprotected public lands. This study did not involve endangered or protected species.
Extraction and isolation
To extract chemical compounds from the bodies of termite workers, 2,000 individuals per colony were extracted in a 100 mL glass vial containing 10 mL n-hexane (FUJIFILM Wako Pure Chemical Corporation, Osaka, Japan) for 24 h. Four samples were derived from four colonies (A, B, K, and L). The hexane crude extracts (equivalent to 200 workers/mL) were transferred into new glass centrifuge tubes for further processing and were preserved in a freezer (−30 °C) until use in further analyses.
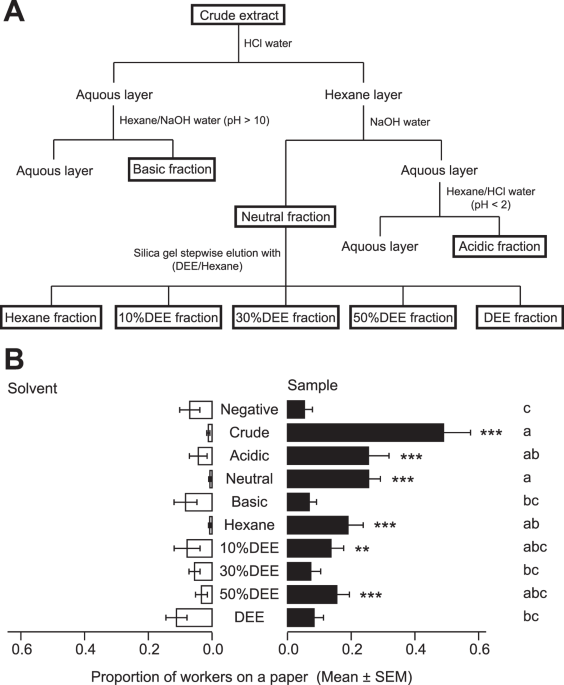
Fractionation of the crude worker extract was performed using the following procedure (Fig. 1A). First, 2 mL of crude extract was extracted with 1 M hydrogen chloride (HCl, 3 × 4 mL) and then fractionated into hexane and aqueous layers. The aqueous layer was alkalised (pH 10) with 1 M sodium hydroxide (NaOH, 18 mL), then extracted with hexane (3 × 4 mL). This extract was concentrated without desiccation using a rotary evaporator to obtain the basic fraction (2 mL). The hexane layer was added to 2 mL of hexane, extracted with 1 M NaOH (3 × 4 mL), and then fractionated into a 4-mL hexane layer (hereafter, the neutral fraction) and an aqueous layer. This aqueous layer was acidified (pH 1) with 1 M HCl (18 mL) and extracted with hexane (3 × 4 mL). This extract was then concentrated without desiccation using a rotary evaporator to obtain the acid fraction (2 mL). The neutral fraction (1 mL) was chromatographed on a silica gel column (0.5 g, Wako gel C-200; FUJIFILM Wako Pure Chemical Corporation). The column was successively eluted with hexane, three concentrations of DEE (FUJIFILM Wako Pure Chemical Corporation) in hexane (2 mL each of 10% DEE, 30% DEE, and 50% DEE), and DEE (2 mL). Resulting 100-μL aliquots from each fraction were concentrated to 10-μL aliquots using a gentle nitrogen steam and then subjected to GC-MS analyses for identification. The remainder of each fraction was preserved in a freezer (−30 °C) for later use in bioassays and further chemical analyses.
Preparation of shelter paper extracts
To elucidate substances excreted by worker termites, we used a shelter paper approach. Groups of 200 workers were placed in 35-mm plastic dishes that were lined with 30-mm filter papers (Advantec No. 2; Toyo Roshi Kaisha, Ltd, Tokyo, Japan) (Fig. S2). We prepared 26 and 18 dishes from the colonies C and F, respectively, because total number of workers included in the nest wood was different between colonies. The papers were moistened with 150 μL of distilled water and the dishes were incubated at 25 °C. Shelter papers were collected from each dish every 24 h for 3 days, then preserved in a freezer at −20 °C for use in later analyses.
Chemical compounds were obtained from shelter papers by extraction with hexane in a 200-mL glass jar for 24 h (colony C: 78 papers/78 mL; colony F: 54 papers/54 mL). The resulting crude extract (500 μL) was chromatographed on a silica gel column (0.5 g, Wako gel C-200, FUJIFILM Wako Pure Chemical Corporation). The column was successively eluted with hexane, three concentrations of DEE in hexane (1.5 mL each of 10% DEE, 30% DEE, 50% DEE), and DEE (1.5 mL). All fractions (1.5 mL each) were concentrated to 100-μL aliquots using a gentle nitrogen steam. Aliquots were then subjected to GC-MS analyses for identification.
GC-MS analysis
GC-MS analyses were performed on a JMS-Q1500GC (JEOL Ltd., Tokyo, Japan) combined with an Agilent Technologies 7890B GC system (Agilent Technologies, Santa Clara, CA, USA) equipped with a DB-1MS column (30 m × 250 μm × 0.25 μm, Agilent Technologies). Column temperatures were set at 50 °C for 5 min, followed by 20 °C for 1 min, and then 300 °C for 5 min. A 1-μL hexane solution was then injected into each sample. The injector used was in splitless mode, with helium as the carrier gas (1.2 mL/min), and the injection port temperature was maintained at 250 °C. MS data were obtained under the following conditions: 50 μA ionisation current, 70 eV ionisation energy, 2 kV accelerating voltage, and a 40–500 m/z scan range. Both GC and MS systems were controlled using a msPrimo System Controller ver. 1.06 (JEOL Ltd.). We used the software Escrime ver. 2.04 (JEOL Ltd., https://www.jeol.co.jp/en/products/detail/JMS-Q1500GC.html) for data analysis. Candidate compounds were predicted from the Mass Spectral Library (NIST11). Compounds were identified according to retention time and mass spectra, in comparison with commercial standards and synthesised racemic 2-phenylundecane standards (see Text S1).
Methyl esterification of vaccenic acid
To determine the geometrical isomer of vaccenic acid derived from worker extracts, a fatty acid methyl ester was prepared prior to GC analysis. The 50% DEE fractions (each equivalent to 0.5 workers), and 1 μg each of authentic cis– and trans-vaccenic acid standards (Funakoshi Co., Ltd., Tokyo, Japan) were individually resuspended in 500 μL of 5% HCl methanol solution (FUJIFILM Wako Pure Chemical Corporation) in a 10-mL glass centrifuge tube. Each tube was then heated at 50 °C for 30 min. After the tube had cooled, the product was extracted with hexane (500 μL) three times. Combined hexane layers (1.5 mL) were concentrated using a gentle nitrogen steam (15 μL), then subjected to GC analyses. GC analyses were performed on a GC-2014 (Shimadzu Corporation, Kyoto, Japan) with a flame ionisation detector (220 °C). Fractions (1 μL each) were injected in splitless mode. The injection port temperature was 210 °C. The column used was an HP-88 (30 m × 250 μm × 0.25 μm, Agilent Technologies). The carrier gas was helium, with a flow rate of 20 mL/min. The oven was programmed as follows: 1 min at 120 °C, followed by 10 min at 175 °C, and then 1 min at 210 °C, in accordance with the manufacturer’s recommended protocol (Agilent Technologies Inc., 2014)57. The geometrical isomer of methyl vaccenate was identified by comparing its retention time with those of the methyl-esterified commercial standards.
Bioassay
Prior their use in bioassays, approximately 2,000 termites were placed in a 140-mm plastic dish with a moistened filter paper (90 mm in diameter) in darkness at 25 °C for 2 days. Following acclimation, 30 workers each were placed into 90-mm plastic dishes that contained two pieces of filter paper (30 mm in diameter). Filter papers were placed on opposite sides of the dishes, which had polished surfaces. The ‘sample’ paper had an extract (or authentic standard) solution applied to it, whereas the ‘solvent’ paper had a solvent applied. Both papers were dried for approximately 5 min to remove solvents before the dish was covered. To record the number of workers on the sample and solvent papers, vertical photographs of each dish were taken using a digital camera (EOS Kiss Digital N + EF 50 mm f/2.5 Macro, Canon, Tokyo, Japan). Numbers of workers present on each paper were recorded after 5 min in all behavioural experiments, excluding those otherwise specified. All bioassays included 10 replications per colony per treatment, and workers from two colonies were used in each treatment.
Aggregation pheromone components were identified and the optimal ratio and dose were determined through the following three steps:
- (1)
Comparison of attraction activities among fractions
To examine aggregation activity among fractions (acidic, neutral, basic, hexane, 10% DEE, 30% DEE, 50% DEE, and DEE), workers from two colonies (C and D) were used. Worker crude extract derived from Colony A was used as a positive control. In the negative control treatment, sample and solvent papers were impregnated with hexane. For each replicate, a fraction solution (equivalent to 1 worker) was added to the sample paper (negative control: 10 μL; crude: 5 μL; acid and basic fraction: 5 μL; neutral fraction: 10 μL; hexane, 10% DEE, 30% DEE, 50% DEE, and DEE fractions: 20 μL). The same amount of solvent was added to the solvent paper in each treatment.
- (2)
Determination of pheromone components and effective mixture ratios.
To determine pheromone components and their optimal ratio, bioassays were performed in multiple steps. First, candidate compounds were identified in the hexane, 10% DEE, 50% DEE, and acidic fractions. Attractant activities of various combinations of the candidate compounds were tested using authentic standards. Various mixture ratios of these compounds were then tested. Experimental process details are provided in Text S3.
- (3)
Dose response of artificial aggregation pheromone
The activity of the Mix solution [(±)-2PhC11: C25: C27: tVA: PA: Ch = 60:1340:860:4000:20000:1160 (unit: ng per 10-μL hexane)] was compared with the activities of four dilutions (Mix × 0.1, Mix × 0.01, Mix × 0.001, and Mix × 0.0001). Workers from Colonies I and J were used in these experiments. In each replicate of each treatment, excluding the positive control, 10 μL of solution were added to the sample paper, and the same volume of hexane was added to the solvent paper. In the positive control, 5 μL of crude extract derived from colony I (equivalent to 1 worker) were added to the sample paper. In the negative control treatment, hexane was applied to both filter papers. The numbers of workers present on the sample and solvent papers were recorded after 5, 60, 120, and 240 min to confirm the arrestant activities of pheromone components.
Statistical analyses
Statistical analyses and graphical visualisations were performed in R software ver. 3.3.358. For the behavioural assessment, the total numbers of workers on sample papers were compared with the total numbers of workers on solvent papers in each treatment, using a binomial test with a Bonferroni correction. All replicates were pooled for each treatment. Also, we compared the mean proportion of workers on sample papers among treatments, using a generalised linear mixed model (GLMM) followed by Tukey HSD test (P < 0.05). The proportion of workers on sample papers was regarded as the response variable, assuming a binomial distribution. Treatments were used as an explanatory variable and colonies and replicates were treated as randam effects.
For the bioassay experiments used to test dose-dependency and arrestant activity, the proportions of workers on sample papers were compared among treatments and time exposure periods using a GLMM approach. The proportion of workers on sample or solvent papers was regarded as the response variable, assuming a binomial distribution. Interactions between treatments and exposure times were used as explanatory variables and colonies and replicates were treated as random effects. Multiple pairwise-comparisons using a χ2 test were performed for post hoc comparisons interaction terms and a sequential Bonferroni correction was applied to evaluate pairwise significance.
Source: Ecology - nature.com
