Study site and sample collection
The study site was a mixed forest of P. densiflora, a coniferous tree, and broad-leaved deciduous trees at an elevation of ~1,300 m in the Sugadaira Research Station (N36°31′17″, E138°20′60″), University of Tsukuba. According to the Japan Meteorological Agency, statistical data for 1981−2010, the average annual temperature of this area is 6.4 °C, the lowest and highest monthly average temperatures are −6.2 °C in January and 19.5 °C in August, respectively, and the snow season is from October to April. In this forest, two 60 × 60 m plots were established, Plot 1 (~45 years old) and Plot 2 (~70 years old), and in each plot, one of the authors (T. Shirouzu) collected the fruiting bodies of Dacrymycetes and the decaying branches (1−5 cm in diameter) of P. densiflora four times per year (in May, July, September, and November) from 2016 to 2018. Dacrymycetous fruiting bodies appearing on the decaying branches (1−5 cm in diameter) of P. densiflora were surveyed for 1 h in each plot, and all fruiting bodies found were collected. Some of the obtained fruiting bodies were separated from the substrate, soaked in DMSO buffer38 containing 100 mM Tris-HCl (pH 8.0) and 0.1 M sodium sulphate (Na2SO3), and stored at −20 °C until DNA extraction. The remaining fruiting bodies were dried using a food dehydrator (at 55 °C for 24 h) and deposited in the National Museum of Nature and Science (Supplementary Table 1). The obtained decaying branches of P. densiflora were divided into three decomposition stages, i.e. solid, decayed, and fragile (II, III, and IV, respectively)39, and four branches were collected for each decomposition stage at each plot (24 branches/sampling event). The collected branches were placed in paper bags and brought to the laboratory, air-dried at room temperature (24−26 °C) for two days, and used for culture isolation and DNA extraction.
Culture isolation from decaying branches
Culture isolation was performed using a dilution-to-extinction method40 modified for wood-decaying fungi4. Collected branches were debarked and washed in running tap water. A 10-g segment was cut from each branch, converged with samples in the same decomposition stage from the same plot, and pulverised with 500 mL of distilled water in a blender (7011HS, Waring Commercial, Torrington, CT, USA) for 1 min at the high speed setting. The pulverised sample was passed through four sieves (mesh sizes: 500, 300, 212, and 106 µm) with running distilled water by using an electric sieve shaker (M-3T, Tsutsui Scientific Instruments Co., Ltd., Tokyo, Japan), and the particles that aggregated in the 106-µm sieve were collected. Next, a 2-mg sample of the particles was transferred into a 50-mL centrifuge tube, and the remainder was dried and stored with silica gel at −20 °C and used for DNA extraction. For washing particles, 20 mL of distilled water were added to the centrifuge tube and centrifuged at 2,200 × g for 3 min in a tabletop centrifuge (Model 4000, KUBOTA, Tokyo, Japan). The supernatant was then removed from the tube and 20 mL of fresh distilled water were added. This washing process was repeated 10 times. The washed particles were diluted with a 1% solution of CMC (carboxymethyl cellulose, No. 1190, Daicel FineChem Ltd., Tokyo, Japan) to a concentration of 1−2 particles/50 µL, and a 50-µL aliquot of the CMC solution including the wood particles was dispensed into each well of a 48-well microplate containing 500 µL/well of malt agar medium (45 g of 2.5% MA [Nissui, Tokyo, Japan], 1 g of yeast extract, 10 mg of chloramphenicol, and 1 L of distilled water). Eight microplates were prepared for each particle composite. The microplates were placed in polyethylene bags and incubated at room temperature (24−26 °C) under a 12/12-h light/dark cycle for 2 months. The plates were examined weekly under a stereomicroscope, and the colonies that presented Dacrymycetes characteristics (coloured white, purple, or yellow to orange and thin lanate or velvety in texture) were isolated and preserved in sealed vials containing 0.1% cornmeal agar (0.2% CMA; Nissui) + 1.25% malt agar (2.5% MA) medium (8.5 g of 0.2% CMA, 22.5 g of 2.5% MA, 1 g of yeast extract, and 1 L of distilled water). The isolated cultures are available from the Culture Collection of National Institute of Agrobiological Science (MAFF; Supplementary Table 1).
DNA extraction/PCR/sequencing: fruiting bodies and cultures
Genomic DNA was extracted from fruiting bodies and cultured mycelia by using a Genomic DNA Extraction Kit Mini (Plant, RBC Bioscience, New Taipei City, Taiwan). The primers LR0R/LR5 (https://sites.duke.edu/vilgalyslab/rdna_primers_for_fungi/)41 were used to amplify a partial sequence of LSU rDNA. Each PCR mixture (10 µL) contained 1 µL of genomic DNA, 5 µL of EmeraldAmp PCR Master Mix (Takara Bio Inc., Shiga, Japan), 0.25 µL of each primer (10 µM), and 3.5 µL of Milli-Q water. The following thermocycling protocol was used: one cycle of 3 min at 94 °C, followed by 35 cycles of 30 s at 94 °C, 30 s at 51 °C, and 1 min at 72 °C, and a final 5-min cycle at 72 °C. The resulting PCR products were directly sequenced by SolGent (Daejeon, Korea). The obtained sequences were identified based on BLAST searches.
DNA extraction/PCR/eDNA metabarcoding: decaying branches
A 50-mg sample of the dried wood powder obtained during implementation of the dilution-to-extinction method was placed in a 2-mL screw-tube containing zirconia beads (∅ 3 and 1 mm), and the beads were crushed by shaking at 2,500 rpm for 5 min in a bead crusher (µT-12, TAITEC, Saitama, Japan). DNA was extracted from the crushed wood powder by using the Genomic DNA Extraction Kit Mini (RBC Bioscience), and the extracted DNA was further purified using a MagExtractor (Toyobo, Osaka, Japan). The purified DNA was used as a template for the 1st PCR, which was performed in four technical replicates per sample by using the following primers: ITS2D-Deg-TN 5′-ACACTCTTTCCCTACACGACGCTCTTCCGATCTNNNNNNTAGGRNTACCCGCTGAACTTAAGC-3′, designed for Dacrymycetes; and LR22-TN 5′-GTGACTGGAGTTCAGACGTGTGCTCTTCCGATCTNNNNNNCCTCACGGTACTTGTTCGCT-3′, based on the fungal universal primer LR22 (https://sites.duke.edu/vilgalyslab/rdna_primers_for_fungi/). The italicised and regular letters denote sequencing primers of MiSeq (Illumina, San Diego, CA, USA) and fungus-targeting primers, respectively. The six random bases (“N”) were used to enhance cluster separation on the flow cell during the initial base-call calibrations on MiSeq. Each PCR mixture (10 µL) contained 1 µL of DNA template, 5 µL of 2 × KAPA HiFi HS ReadyMix (KAPA Biosystems, Woburn, MA, USA), 0.25 µL of each primer (10 µM), and 3.5 µL of Milli-Q water. To suppress the production of chimeric sequences during PCR, we adopted a condition that combined slow temperature change (1 °C/s)42, high annealing temperature, and a small number of PCR cycles43. The thermocycling protocol was as follows: one cycle of 3 min at 95 °C, followed by six cycles of 20 s at 98 °C, 15 s from 67 to 62 °C, and 15 s at 72 °C, followed by 24 cycles of 20 s at 98 °C, 15 s at 62 °C, and 15 s at 72 °C, and a final 5-min cycle at 72 °C. The 1st PCR product was purified using Agencourt AMPure XP (Beckman Coulter, Brea, CA, USA).
The 2nd PCR amplified the 1st PCR amplicons by using the prime rs (forward) 5′-AATGATACGGCACCACCGAGATCTACACXXXXXXXXTCGTCGGCAGCGTCAGATGTGTATAAGAGACAG-3′ a nd (reverse) 5′-CAAGCAGAAGACGGCATACGAGATXXXXXXXXGTCTCGTGGGCTCGGAGATGTGTATAA AGACAG-3′. The italicised and regular letters denote the MiSeqP5/P7 adapter and sequencing primers, respectively. The eight bases denoted by “X” represent dual-index sequences inserted to identify distinct samples44. The 2nd PCR was performed using a 12-µL reaction mixture containing 1 µL of DNA template, 6 µL of KAPA HiFi HS ReadyMix, 1.4 µL of each primer (2.5 µM), and 2.2 µL of Milli-Q water. The following PCR conditions were used: one cycle of 3 min at 95 °C, followed by 12 cycles of 20 s at 98 °C, 15 s at 72 °C, and a final extension for 5 min at 72 °C.
The indexed 2nd PCR amplicons were pooled to prepare a library for MiSeq sequencing. The volume of each sample added to the library was adjusted to normalise the concentration of each 2nd PCR product. The pooled library was purified using Agencourt AMPure XP, and then target-sized DNAs in the purified library (~500 bp) were excised using E-Gel SizeSelect (Thermo Fisher Scientific, Waltham, MA, USA). The double-stranded DNA concentration of the library was adjusted to 4 nM by using Milli-Q water, and the DNA sample was applied to the Illumina MiSeq platform at Ryukoku University, Japan, by using MiSeq Reagent Kit V2 (500 cycles). Sequence data were deposited in the Sequence Read Archive of the DDBJ under an accession number: DRA008716 (ftp://ftp.ddbj.nig.ac.jp/ddbj_database/dra/fastq/DRA008/DRA008716/).
The procedures used for bioinformatics and data analyses followed those described previously45. By using the bcl2fastq programme provided by Illumina, the raw MiSeq data were converted into FASTQ files, which were demultiplexed using the commands implemented in Claident pipeline (https://www.claident.org/)46. The forward and reverse sequences were then merged. The total 6,918,978 reads (n = 288) were assembled using Claident v0.2.2016.07.05. Subsequently, short reads (<150 bp) were removed, and sequencing errors were removed using algorithms in CD-HIT-OTU47. The remaining sequences were assembled at a threshold similarity of 97%4, and the resulting consensus sequences represented molecular OTUs. For OTUs of clustered eDNA, sequences obtained from fruiting bodies and isolated cultures were mapped with a similarity of 97%. In preliminary analyses, we confirmed that the results of mapping were the same as those of de novo clustering. Following this process, an OTU table (i.e. a matrix of OTUs and samples with sequence reads in each cell entry) was generated. To eliminate putative contaminations, cell entries of the OTU table with ≤ 9 reads were removed. For each sample, only the OTUs found in all four technical replicates were used for the following analysis to reduce the possibility of false-positive detection. To eliminate chimeric OTUs, the obtained sequences were tested based on the results of the chimera-finding algorithm UCHIME48 by using reference sequences in the SILVA database, BLAST search after dividing the sequences into the first half and second half24, and preliminary phylogenetic analyses. Subsequently, the suspected chimeric sequences were removed from further analysis.
Molecular phylogenetic analysis
The dataset of LSU rDNA sequences was assembled to include the representative sequences of each OTU obtained using each detection method and the sequences of Dacrymycetes downloaded from the National Center for Biotechnology Information (NCBI, 30 June 2019) regarding previous studies4,29,32,49,50. Multiple alignments were generated using MAFFT 7 (https://mafft.cbrc.jp/alignment/server/)51 with the G-INS-i option. Ambiguously aligned sequence regions such as significant gaps were manually removed before subsequent analysis. Phylogenetic trees were estimated using RAxML v. 8.2.1052 under a GTRGAMMA model. Maximum-likelihood bootstrap percentages (MLBPs) and a tree were obtained by concurrently running rapid bootstrap analyses of 1,000 pseudoreplicates followed by a search for the most likely tree. The sequences determined in this study and used for the phylogenetic analysis were deposited in the DDBJ (Supplementary Table 1). The aligned dataset was uploaded to TreeBASE under ID: S24901 (http://purl.org/phylo/treebase/phylows/study/TB2:S24901).
Statistical analyses
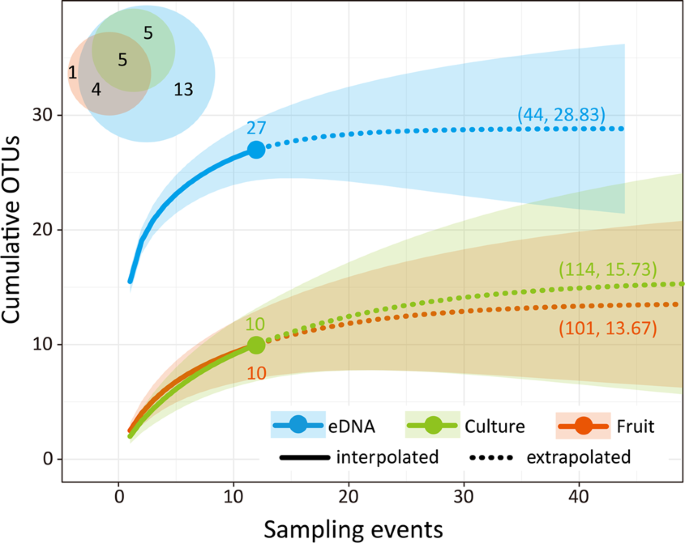
All statistical analyses were performed using R 3.5.353. Statistical significance, α, was set as 0.05. Based on the presence/absence data of the OTUs detected using each method at each sampling event, sample-based rarefaction curves were generated using “iNEXT” package54 with the first Hill number (q = 0). We analysed the effects of the following explanatory variables that were likely to affect the richness and composition of OTUs: the detection method (fruiting-body collection, culture isolation, or eDNA analysis), forest age of plots (45 or 70 years), decomposition stage of branches (II, III, or IV), season of sampling events (May, July, September, or November), and year (2016, 2017, or 2018). A GLM with a Poisson distribution was applied to determine the factors affecting the OTU richness. To test the differences in detection methods, multiple comparisons of the OTU richness between methods were performed using the post-hoc Tukey’s test by using the “multicomp” package55. Additional GLMs were implemented to evaluate the effects of the other explanatory variables on OTU richness and phylogenetic diversity in each method. A model selection procedure was implemented based on AICc. To evaluate the phylogenetic diversity, SESs were calculated for MPD and MNTD56 by using the “picante” package57. This was only performed for the eDNA metabarcoding data as the other methods detected only 0–1 OTU in most samples and the phylogenetic diversity could not be calculated. Subsequently, model selection was performed using a Gaussian distribution. To evaluate the effects of explanatory variables on OTU composition, a PERMANOVA was performed using two dissimilarity indices calculated for the complete dataset: the Raup-Crick metric with the “vegan” package58 and the Unifrac metric with the “picante” package. The Raup-Crick metric is weakly affected by the species-richness gradient among sampling units, and the Unifrac metric quantifies the relative relatedness of OTUs by incorporating phylogenetic distances. As the number of OTUs detected using the culture method was small, dissimilarity was not reliably calculated.
Source: Ecology - nature.com
