Sampling sites
Core samples were collected from basaltic basement at Sites U1365, U1367, and U1368 in the South Pacific Gyre during Integrated Ocean Drilling Program (IODP) Expedition 329 (October 9 through December 13, 2010; Supplementary Fig. 1 and Supplementary Table 1). Although surface heat-flow data from Sites U1365 and U1367 were consistent with those expected for conductive crust in the absence of advection, data from Site U1368 showed substantially low heat flow, indicating apparent heat loss and advective circulation of overlying seawater within the oceanic crust (Expedition 329 Scientists, 2011d). The thickness of sediment cover ranged from 6 m to 71 m (Supplementary Table 1). Molecular oxygen (O2) and nitrate penetrate through the sediment column from the overlying seawater to the basaltic basement, because sediment accumulation rates are so low that detrital organic matter is largely oxidized at the seafloor and O2 diffusion rate outpaces organic oxidation rate in more deeply buried sediment (Supplementary Fig. 1 and Supplementary Table 1).
Drilling and petrological description of basaltic cores
Basalt samples were obtained using a rotary core barrel (RCB) coring system from boreholes U1365E, U1367F, and U1368F. Although contamination of RCB cores from seawater-based drilling fluids is unavoidable, its extent can be carefully monitored. After each core recovery, all core sections were immediately transferred from the catwalk deck to the cold room on the hold deck of the drilling research vessel JOIDES Resolution. Prior to microbiological sampling, preliminary description of petrological characteristics was visually performed. Approximately 8 h to 18 h passed until subsequent microbiological sampling of the rock samples in the cold room. Drilling fluids and seawater were collected at each site and stored at −80 °C for DNA analysis.
Mineralogical and microbiological characterizations of thin sections of basalt cores
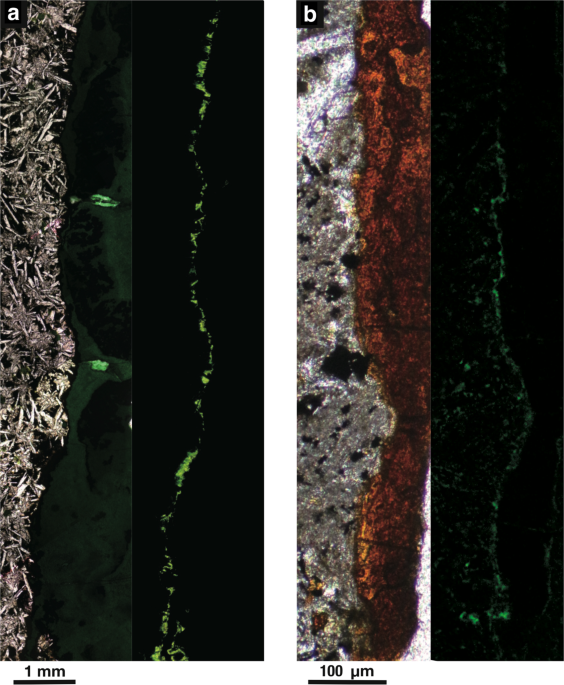
To clarify mineral composition and microbial distribution within rock fractures, thin sections were prepared according to a protocol established for the localization of endosymbiotic cells in chemosynthetic animals39. Fracture-bearing core samples were dehydrated twice in 100% ethanol for 5 min, and core samples were infiltrated four times with LR white (London Resin Co. Ltd., Aldermaston, England) for 30 min and solidified in an oven at 50 °C for 48 h. Solidified blocks were trimmed into thin sections and polished with corundum powder and diamond paste. For the staining of microbial cells embedded in LR white, TE buffer with SYBR Green I (TaKaRa) was mounted on thin sections. After dark incubation for 5 min, thin sections were rinsed with deionized water, mounted with the antifade reagent VECTASHIELD (Vector Laboratories, Burlingame, CA, USA) and then observed using a confocal laser scanning microscope (IX71 with the FLUOVIEW 300 system; Olympus) or an epifluorescence microscope (BX51; Olympus). Two ranges of fluorescence between 540 nm and 570 nm and 570 nm and 600 nm were used to discriminate microbial cells from mineral-specific fluorescence signals.
Mineral assemblages and textures were observed using an optical microscope (BX51; Olympus) and a charge-coupled device (CCD) camera (DP71; Olympus). Carbon-coated thin sections were characterized using a scanning electron microscope (S4500; Hitachi, Ibaraki, Japan) at an accelerating voltage of 15 kV. Back-scattered electron imaging coupled to energy-dispersive X-ray spectroscopy (EDS) was used to analyze the chemical compositions of mineral phases according to image contrasts.
To analyze microbial cells found in rock fractures by nanoscale secondary ion mass spectrometry (NanoSIMS) at Kochi Institute for Core Sample Research, JAMSTEC (NanoSIMS 50 L; CAMECA; AMETEK Co. Ltd., Gennevilliers, France), 3-μm-thick sections were fabricated using a FIB sample-preparation technique using a Hitachi FB-2100 instrument (Hitachi) with a micro-sampling system. The thin-section sample was locally coated with the deposition of W (100–500-nm thick) for protection and trimmed using a Ga ion beam at an accelerating voltage of 30 kV.
The elemental images of C, O, and N as CN, Si, P, S, and FeO from the FIB thin-section sample were obtained by an ion imaging using NanoSIMS 50 L ion microprobe. A focused primary Cs+ ion beam of ~1.0 pA (100-nm beam diameter) was rastered over 12 × 12 μm2 for U1365-12R2 and 16 × 16 μm2 for U1365-8R4 on the samples. Secondary ions of 12C, 16O, 12C14N−, 28Si−, 31P−, 32S−, and 54Fe16O− were acquired simultaneously with multidetection using seven electron multipliers at a mass-resolving power of ~4500. Each run was initiated after stabilization of the secondary ion-beam intensity following presputtering of <~2 min with a relatively strong primary ion-beam current (~20 pA). Each imaging run was repeatedly scanned (20 times) over the same area, with individual images comprising 256 × 256 pixels. The dwell times were 10,000 μs/pixel for the measurements, and total acquisition time was ~3 h. The images were processed using the NASA JSC imaging software for NanoSIMS developed by the Interactive Data Language program40.
After NanoSIMS 50 L analysis, 3-μm-thick sections were further thinned to 100-nm thick for examination using a JEOL JEM-ARM200F transmission electron microscope (JEOL, Tokyo, Japan) operated at an accelerating voltage of 200 kV at the Kochi Institute for Core Sample Research of JAMSTEC. X-ray elemental maps were obtained using EDS with a 100-mm2 silicon drift detector and JEOL Analysis Station 3.8 software (JEOL) in scanning transmission electron microscopy (STEM) mode. A JEOL 2010 transmission electron microscope equipped with EDS at the University of Tokyo was also used to obtain EDS spectra from the 100-nm-thick sections.
Contamination check
To monitor contamination, fluorescence microspheres (0.5 µm in diameter) were used. This approach is not quantitative, but provides evidence of the occurrence of participle contamination, even in interior structures of basaltic samples (e.g., microfractures and veins). For the first step, a bag of fluorescence microspheres was placed on the core-catcher of each core, and after core retrieval and sampling, all microbiological samples were checked for the presence of microspheres.
Procedures involved in the evaluation and reduction of drilling-fluid contamination are schematically illustrated in Supplementary Fig. 1. Contamination was initially examined on the untreated exterior by removing small pieces of rock using a flame-sterilized hammer and chisel. The removed rock exterior was soaked in 25 mL 3% NaCl solution, and microspheres suspended in the NaCl solution were pooled in a 50-mL centrifuge tube. This procedure is necessary to confirm exposure of the cores to microspheres during drilling. The rock surface was washed twice with 25 mL 3% NaCl solution in a sterile plastic bag. Small pieces of the washed exterior were removed with a flame-sterilized hammer and chisel, and wash solutions were pooled in a 50-mL centrifuge tube. After the washing step, the rock surface was flamed with a propane torch in a consistent manner (i.e., constant exposure time and distance between flame and core surface). The flamed rock was cracked open using a flame-sterilized hammer and chisel, and small pieces from the interior and exterior were separately soaked in 25 mL 3% NaCl solution, followed by pooling of the solutions in a 50-mL centrifuge tube. To enumerate microspheres, 3 mL of the aliquots were filtered using 25-mm black polycarbonate filters (0.22-µm pore size) and examined under epifluorescence using an Olympus BX51 microscope (Olympus, Tokyo, Japan). The minimum detection limit was determined to be ~100 microspheres/cm3 rock based on the mean ± standard deviation (SD) of five replicate measurements of blank counting (n = 5).
Community composition analysis
Prokaryotic DNA was extracted from 0.1 g of the powdered inner core41, which had been frozen at −80 °C for storage. Drilling fluids collected at each drilling site and stored at −80 °C were also subjected to DNA extraction. In 300 μL of alkaline solution (pH 13.5; 75 μL of 0.5 N NaOH and 75 μL of TE buffer), powdered core samples were incubated at 65 °C for 30 min, and the aliquots were then centrifuged at 5000 × g for 30 s. After centrifugation, the supernatant was transferred to a new tube and neutralized by the addition of 150 μL 1 M Tris–HCl (pH 6.5). The DNA-bearing solution (pH 7.0–7.5) was concentrated using cold ethanol precipitation, and the DNA pellet was dissolved in 50 μL TE buffer and stored at −4 °C or −20 °C for longer storage. DNA extraction from subsamples was performed in parallel with one extraction negative control, to which no sample was added. The negative control was also subjected to pyrosequencing.
378-bp 16S rRNA gene region was amplified using the primers Uni530F and Uni907R for pyrosequencing using the GS FLX System sequencer42 (Roche Applied Science, Penzberg, Germany). The primers were extended with adaptor sequences (Uni530F: CCATCTCATCCCTGCGTGTCTCCGACTCAG; and Uni907: CCTATCCCCTGTGTGCCTTGGCAGTCTCAG). The forward primer Uni530 was barcoded with 8-mer oligonucleotides to obtain sequences from multiple samples in a single run43. Thermal cycling was performed with 30 cycles of denaturation at 95 °C for 30 s, annealing at 54 °C for 30 s, and extension at 74 °C for 30 s. A polymerase chain reaction (PCR) amplicon with the expected size was excised from 1.5% agarose gels after electrophoresis and purified using a MinElute gel extraction kit (Qiagen, Valencia, CA, USA). DNA concentrations of the purified PCR amplicons were measured using a Qubit fluorometer with the Quant-iT dsDNA HS assay kit (Invitrogen, Carlsbad, CA, USA). The concentration of total dsDNA in each sample was adjusted to 5 ng/μL. Emulsion PCR was performed using the GS FLX Titanium emPCR kit Lib-L (Roche Applied Science) to enrich DNA library beads for the GS FLX System sequencer. Amplified DNA fragments were sequenced according to manufacturer instructions (Roche Applied Science).
Raw reads were demultiplexed, trimmed, and filtered based on their 8-bp sample-specific tag sequences, and quality values and lengths were assigned using the “clsplitseq” command in the MOTHUR program44. Filtered sequences were denoised based on sequence clustering, and possibly chimeric sequences were detected and eliminated using the MOTHUR program. The screened reads were aligned using the Greengenes reference dataset or the SILVA 128 database and the Needleman-Wunsch algorithm in the MOTHUR program. To assign sequences into phylotypes as operational taxonomic units (OTUs), the neighbor-clustering algorithm was employed using the MOTHUR program with a cut-off of 97% sequence similarity. Using the “vegan” package in R45, nonmetric multidimensional scaling plots were obtained for phylotypes clustered with 97% similarity. Additionally, clustering and heatmap analysis of microbial communities were analyzed using the “vegan” package in R45. The phylogenetic affiliations of the phylotypes were analyzed along with closely related sequences retrieved from GenBank (http://www.ncbi.nlm.nih.gov/genbank/) through BLASTn searches (somewhat similar sequences) using the neighbor-joining method in the ARB software package46. The rapid bootstrapping algorithm (500 bootstrap replicates) in the ARB software package was then used to score the branching patterns in neighbor-joining trees.
μ-Raman spectroscopy
Raman spectra from fracture-filling minerals were obtained using a 50-cm single polychromator imaging spectrograph (Bruker Optics, Osaka, Japan), which was equipped with an optical microscope (BX51; Olympus), an Ar+ laser (514.5 nm, 5500 A; International Light Technologies, Peabody, MA, USA), and a CCD camera (1024 × 256 pixels; DU401A-BR-DD; Andor Technology, Belfast, Ireland). The incident laser was operated at 20 mW, and the spatial resolution was ~1 μm. An edge-cut filter was used to remove the Rayleigh line. Raman lines of naphthalene at 513.6 cm−1, 763.5 cm−1, 1021.3 cm−1, 1147.3 cm−1, 1382.3 cm−1, 1464.3 cm−1, and 1576.3 cm−1 were used to calibrate Raman shift. Analytical uncertainty typically ranged at ~1 cm−1. To analyze iron-bearing phases, a non-dispersive filter was inserted to reduce the intensity of the laser beam by ~10% in order to avoid beam-induced transformation from goethite to hematite.
Organic carbon characterizations of clay fractions of basalt cores
The portions of rock cores examined as described above were powdered using a mortar and pestle. Clay-sized fractions in powdered samples were suspended in distilled and deionised water, centrifuged at 3000 rpm for 5 min, and then the supernatant was collected. Next, the clay fraction was collected from the supernatant by centrifugation at 10,000 rpm for 10 min and dried at 50 °C and then subjected to organic carbon characterizations. KBr pellets made of the clay fractions were analyzed with Fourier transformed infrared-ray (FT-IR) spectrometry (Perkin Elmer Spectrum 2000, Tokyo, Japan) to clarify lipids in extant microorganisms. The pellets in the specimen chamber filled by N2 gas were analyzed by infrared rays through KBr beam-splitter with the MCT detector. Representatvive FT-IR spectra were obtained by averaging 100 individual spectra. The contents of organic carbon in the clay fractions were measured using a mass spectrometer (Thermo Electron DELTAplus Advantage; Thermo Fisher Scientific Inc., Waltham, MA) connected to an elemental analyzer (EA1112, Thermo Electron DELTAplus Advantage) through a Conflo III interface. The clay fractions were heated at 100 °C in 3% HCl to eliminate carbonate minerals, washed twice with distilled, deionized water, and dried.
Reporting summary
Further information on research design is available in the Nature Research Reporting Summary linked to this article.
Source: Ecology - nature.com
