Study site
We evaluated different communities in the region to determine the most appropriate location for an isotopic mark-capture study design (Fig. 2). We based our study site selection on the ability to have access to freely discarded containers (those found in public property), willingness of community members to participate in the sampling efforts, and isolation from other communities. The study took place from September 5th to December 7th, 2017, in the communities of La Piñata (LP) and Tierra Bella (TB) (26°7′43.78″ -98°3′19.63″) in Donna, Hidalgo County, Texas (Fig. 2). The study area consisted of a total of 23.4 ha (LP = 15 and TB = 8.4) with 180 houses (LP = 136 and TB = 44). Housing density (mean ± S.E.: 7.15 ± 2.7) by community was LP = 9.1 houses/ha and TB = 5.2 houses/ha. Each occupied house in the study area was georeferenced using an eTrex20x GPS (Garmin, USA). In 2017, the city of Donna had a population of 16,638, 92% of whom were Hispanic or Latino. Thirty five percent of the population lives below the poverty line, 30% of the people under 65 years have no health insurance and 19% are foreign born individuals35. Geographically, the communities of LP and TB are surrounded by agricultural fields, which were not cultivated during the study period. The two communities are divided by a 25-meter-wide canal. The temperature in the region is considered cold/dry from November to February (7–21 °C), and hot/dry from March to October (22–40 °C), with a rainy season starting in April, peaking in September and finishing in October (average annual: precipitation 63.5 cm and relative humidity 75%)36.
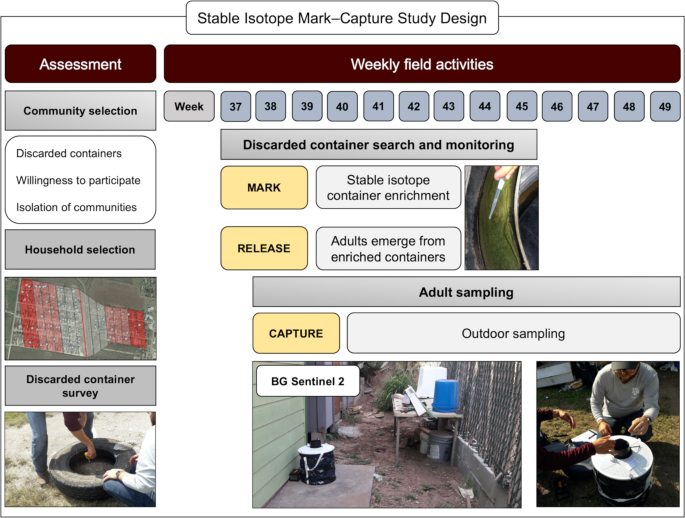
A mark–capture study design for the isotopically enrichment of naturally occurring Ae. aegypti. We carried out an initial assessment of communities located in Hidalgo County, based on the presence of discarded containers in public property, willingness of community members to participate and isolation of the communities. Houses were selected based on distance to the discarded container larval habitats of enrichment. Isotopic enrichment of larval habitats was carried out on a weekly basis from the 37 to the 45th week of 2017. Weekly adult sampling was done using BG Sentinel 2 traps, set outside of the house from week 38 to 49th of 2017. The map was developed using QGIS 3.4.4 (https://qgis.org/en/site/) with Map data: Google, Maxar Technologies.
Discarded container search and monitoring
We performed a preliminary assessment of discarded containers on the west and east banks of the canal that separated the communities (Fig. 3), no containers were found on the east bank of the canal. We estimated the average ±SD no. of pupae/container was 1.65 ± 0.6 a number similar to that observed in communities in Mexico37. Monitoring and marking of containers were done on a weekly basis from September 11th to November 8th, by the same team members. Container counting and marking started one week before (week 37) adult mosquito sampling (week 38). We sampled a transect of 400 m of public property next to a canal that divides the communities of LP and TB and searched for all containers capable of holding water (Fig. 3). Each container was uniquely labelled with an oil-based marker. Records were kept for the type of container, amount of water found, presence of larvae/pupae, amount of isotope added and GPS coordinates. The labelling of containers allowed us to track if containers were removed, needed enrichment or if new ones arose. We had four isotopically marked containers that were removed during the first week of isotopic marking. These containers were not taken into consideration for the dispersal analysis given insufficient time to generate marked adults.
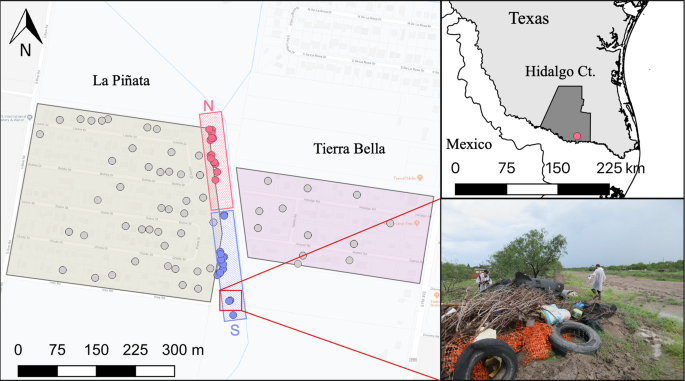
Location of the communities of La Piñata and Tierra Bella, Donna, in the County of Hidalgo, Texas. The boundary of La Piñata is enclosed by the beige area to the left and the boundary of Tierra Bella is enclosed in the pink area to the right. Gray dots = houses with weekly surveillance of mosquitoes, blue dots = larval habitats with 13C isotope enrichment, and red dots = larval habitats with 15N isotope enrichment. The red square with the above N= north transect and the blue square with lower S= south transect. The map was developed using QGIS 3.4.4 (https://qgis.org/en/site/), Map data: Google Maps, and with publicly available administrative boundaries (https://gadm.org/license.html).
Household selection for adult sampling
The communities were divided into three sectors (1st: 0–150 m; 2nd: 151–300 m; and 3rd: 301–400 m) based on parallel proximity to the discarded container transect enriched with stable isotopes for mosquito marking (Fig. 4). The number of houses for weekly sampling was based on housing density and distance to the isotopically marked larval habitat transect. We randomly selected 28 houses from LP (1.8 house/ha) and 12 from TB (1.5 house/ha), to have a similar sampling effort in each community6. We deployed 50% of all traps in the 1st sector (0–150 m), 30% in the 2nd (151–300 m) and 20% in the 3rd (301–400 m) for LP. The distribution of traps in TB was 30% in the 1st sector, 50% in the 2nd, and 20% in the 3rd; the selection constrained by household participation. Our trap distribution was designed to maximize our capture success based on previous MRR studies of Ae. aegypti (0.35% to 8% recaptures) were over 80% of recaptures happened in the first 100 m6,21,23,24. In the statistical analysis section, we further explain how we took into consideration trap density for our different models.
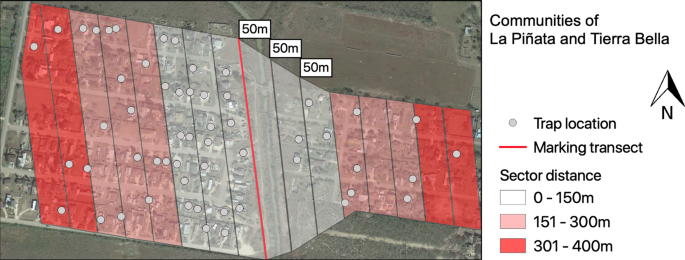
Communities of La Piñata and Tierra Bella divided into sectors for BG2 surveillance. Sectors were divided based on the distance to the isotopically marked larval habitat transect. The map was developed using QGIS 3.4.4 (https://qgis.org/en/site/) with Map data: Google, Maxar Technologies.
Stable isotope enrichment and adult marking
The isotopically marked larval habitat transect was divided into two sections of 200 m each (Fig. 2). All of the containers with water in the south transect were enriched with D-Glucose (U-13C6, 99%) (13C) (Cambridge Isotope Laboratories, USA) and in the north transect with Potassium Nitrate (15N, 99%) (15N) (Cambridge Isotope Laboratories, USA). This step corresponds to the marking and releasing in an MRR study but the current study design marks larval mosquitoes naturally occurring in the field which remain marked as adults. Isotopic marking was done using a concentration of 0.002 g/L for both isotopes which was based on previous studies marking larval habitats of Culex mosquitoes15,20 as well as, optimal isotopic marking concentrations based on laboratory-reared Ae. aegypti38. During the first isotopic marking, each container received a full dose of isotopes. Subsequently only half doses were added to each container, unless a rain event occurred that added water to the containers in which case a full isotope dose was used again. For quality assurance and to guide our enrichment procedures, on a weekly basis we randomly selected one container that had pupae from both transects, collected three individuals and allowed them to emerge as adults in the laboratory in Weslaco, TX. These mosquitoes were then transported in coolers with dry ice to our laboratory in College Station, TX, to be processed for the stable isotope analysis.
Adult sampling
We carried out weekly outdoor collections in LP (week 38) and TB (week 39) using BG Sentinel 2 traps baited with BG-Lure (Biogents, Germany) (artificial skin odor based on a mixture of ammonia, lactic acid and caproic acid) which was replaced every 60 days. Trap deployment was done between 9:00 and 10:00 am, traps were left for about 23 h, picked up the next day from 8:00 to 9:00 am. To prevent mosquito damage, collection bags were placed in a plastic container inside a cooler with icepacks. Mosquitoes were classified by sex (male or female), physiological state (unfed or gravid) and identified to species39,40 (see Supplementary Dataset S1). We separated the mosquito samples in pools with a maximum of five (male and unfed female) and four (gravid females) mosquitoes for each given species or groups17. Blood-fed females were excluded from the samples for this study, since they were used for bloodmeal analysis in a different study. All samples were stored at −80 °C and transported in coolers with dry ice to our main laboratory in College Station, Texas, for further analysis.
Stable isotope analysis
Collected adults were analyzed to identify which specimens were uniquely enriched with stable isotopes. Male and female (unfed and gravid) Ae. aegypti samples were placed in tin capsules (Tin capsules, Costech, Valencia, CA, USA) arranged in a 96-well cell culture plate, desiccated at 56 °C for 18–24 h, and then sealed by hand into spherical balls. Plates with samples were submitted to the Stable Isotope Geosciences Facility, Texas A&M University, College Station, Texas, for dual 15N and 13C analysis using a procedure previously described15. Briefly, the analysis was carried out using a Carlo Erba NA 1500 Series 2 Elemental Analyzer (EA) attached to a Thermo-Finnigan Conflo III and a Thermo Finnigan Delta Plus XP isotope ratio mass spectrometer (IRMS). The process consists of combusting the samples at 1,200 °C which will pass through two reactors to convert the nitrogen oxides generated in the oxidation reactor to N2 gas. The CO2 and N2 gases generated are separated chromatographically and analyzed on the IRMS.
Statistical analysis
Isotopically enriched discarded containers were tested for a correlation between precipitation and the presence of larvae/pupae in these isotopic enriched larval habitats using Spearman’s ρ. To evaluate the capture rates of isotopically marked Ae. aegypti pools we calculated the Maximum (Max ER; No. positive pools/Total pools tested) and Minimum Enrichment Rates (Min ER; estimated using PooledInfRate (Biggerstaff, CDC, www.cdc.gov/ncidod/dvbid/westnile/software.htm)). The Max ER assumes that all mosquitoes in an enriched pool were isotopically marked, while the Min ER assumes that only one mosquito was isotopically marked. To estimate the Mean Distance Travelled (MDT) and the probability of detection of an isotopically enriched mosquito, we measured the distance (mean, min, max and standard error) between the geographic coordinates of each enriched larval habitat and each BG Sentinel 2 trap. Distances were measured using the distance matrix function in QGIS 3.4.4 (QGIS development team 2019). For this, we assumed that isotopically marked mosquitoes had the same probability of emerging from any larval habitat with the same isotopic enrichment.
We estimated the MDT using three different and independent approaches which we called Net, Strip and Circular15,20. The Net approach estimates MDT as the linear dispersion of a given mosquito from any possible source of isotopic marking to the trap where it was captured, without accounting for indirect flight patterns and trapping effort (Fig. 5A,B)23. The Strip and Circular approaches follow a procedure based on Morris9, where the area contiguous to the release is divided in sectors and annuli with 50 m increments. These area divisions account for indirect flight patterns and compensate for unequal trapping efforts20,41. For both the Strip and Circular approaches we also made the assumption that adult Ae. aegypti movement from the isotopically marked larval habitats was isotropic with similar movement where we sampled and where we did not (the adjacent agricultural fields)42. The Strip approach assumes a one-dimensional diffusion43 from the enriched larval habitats to the trap where the marked pool was detected, taking into consideration the area of each sector (Fig. 5C,D). The Circular approach (standard procedure) adapted the annuli method, which assumes a two-dimensional diffusion43. For this, we defined five clusters of enrichment (13C = 3 and 15N = 2) –for the larval habitats in the transect– using the k-means clustering method in R3.2 (Vienna, Austria)44. K-means method uses the nearest mean distances between larval habitats to identify high-density regions that allows the choice of an optimal number of clusters45. The Circular approach uses the distance between marked pools and clusters of larval habitats, taking into account the area of each annuli (Fig. 5E,F).
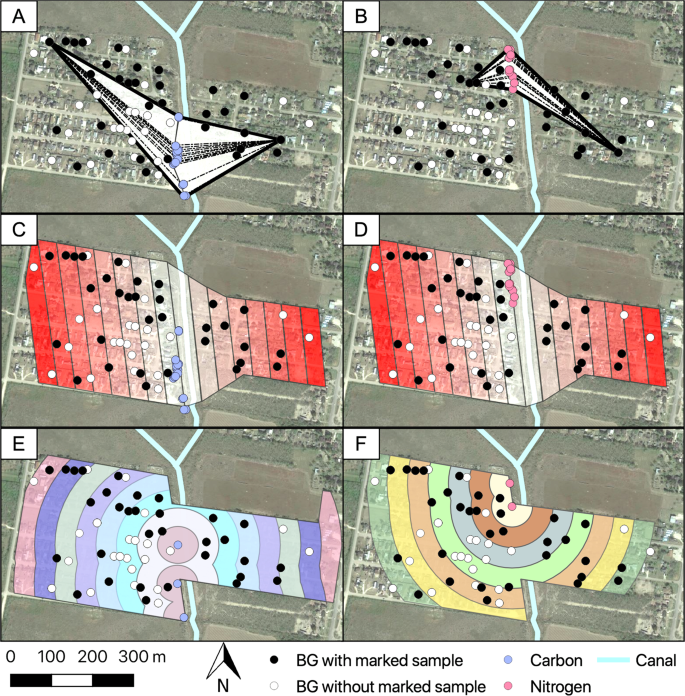
Mean distance traveled approaches used for the estimation of the natural dispersion of isotopically marked mosquitoes. (A,B) Net approach measurements were based on the mean distance of the house with a marked sample to every larval source enriched. (C,D) Strip approach and (E,F) Circular approach averages the max and min distance for all houses per sector, taking into account indirect flight patterns and trap densities. Dotted lines = distance from larval enriched source to house with marked sample. The map was developed using QGIS 3.4.4 (https://qgis.org/en/site/) with Map data: Google, Maxar Technologies.
We estimated the probability of detecting isotopically marked Ae. aegypti pools using binomial generalized linear mixed models46. Briefly, we started by considering a full model described by the following equation:
$$Log(pi /1-pi )=mu +{alpha }_{i}+{gamma }_{j}+{beta }_{1}{x}_{k}+{beta }_{2}({alpha }_{i}{gamma }_{j})+{beta }_{3}({alpha }_{i}{x}_{k})+{beta }_{4}({gamma }_{j}{x}_{k})+{beta }_{5}({alpha }_{i}{gamma }_{j}{x}_{k})+{pi }_{l}+{tau }_{m}+{{epsilon }}_{ijlmk}$$
(1)
Where fixed factors included: μ the intercept, a parameter (alpha ) accounts for the community where adult mosquitoes were sampled, and had two i levels (LP or TB), mosquito condition (denoted by (gamma )) had three j levels (male, gravid, or unfed), the mean distance from the enriched larval habitats was a covariate for each k observation, whose effect was measured by parameter ({beta }_{1}). Parameters ({beta }_{2},{beta }_{3},{beta }_{4}) accounted, respectively, for the interaction between community and condition; community and distance, condition and distance, while parameter ({beta }_{5}) accounted for the three-way interaction between community, condition and mean distance travelled. Meanwhile, the model considered a categorical variable with unique ids for each l trap ((pi )) and a variable for the m weeks ((tau )) when mosquitoes were sampled as random factors. These random factors were included to account for spatial effects associated with trap location and the repeated sampling over the study period. The random factors were assumed to follow an identical and independent normal distribution:
$$pi sim N(O,{sigma }_{pi }^{2})$$
(2)
And
$$tau sim N(O,{sigma }_{tau }^{2})$$
(3)
where ({sigma }_{pi }^{2}) and ({sigma }_{tau }^{2}) are the variance for the trap and sampling week random factors, ({epsilon }) was the model error.
Models were fitted using the Laplace estimation method implemented in SAS 9.4 (GLIMMIX, SAS Institute Inc., NC, USA)47. The model presented in (1) was then simplified through a process of backward elimination48, where parameters accounting for the three-way interaction between variables, then the two-way interactions and single parameters were sequentially removed. The reduced model was selected based on the Akaike information criterion (AIC), a metric for model selection that trades off goodness of fit and parameter number48,49. The goodness of fit of the final model was evaluated using the conditional and marginal R2 values26 and a Chi2 test for GLMMs goodness of fit50.
Source: Ecology - nature.com
