Distribution of 16s sequences among samples
More than 2.5 million sequence reads were obtained from 60 samples, with 15 samples from each type of the following sources: soils, roots, leaves, and phloem. All the raw data of samples were submitted to the SRA database with the submission number of SUB6069689. Specifically, 639,200 (24.90%) were from soils, 688,345 (26.81%) from roots, 639,373 (24.91%) from leaves, and 599,685 (23.4%) from phloem. Among the total sequence reads, 1,454,442 (56.7%) were assigned to chloroplast and mitochondrial reads, 1,085,802 (42.3%) assigned to other classifiable reads, and 26,359 (1.0%) were unclassifiable reads. Among the chloroplast and mitochondrial reads, 42.81%, 37.09%, 19.89%, and 0.21% were from leaf, phloem, root, and soil samples, respectively. Most other classifiable reads, 57.00%, and 36.17%, respectively, were from soil and root samples, and only 1.39 and 5.44% were from leaf and phloem samples (Tables 1 and S1).
Distribution of OTUs
After excluding chloroflexi and mitochondrial reads and unclassifiable unique reads, the remaining reads were assembled into OTUs. The distribution of total OTUs were 4733, 3520, 421, and 583, respectively, for soil, root, leaf, and phloem samples. Based on our technical reproducibility, we set the criterion for ‘measurable OTUs’ as ≥20 reads in at least three samples of the same type. Based on this criterion, the measurable OTUs were 2245, 1034, 55, and 111 for soil, root, leaf, and phloem samples (Fig. 1).
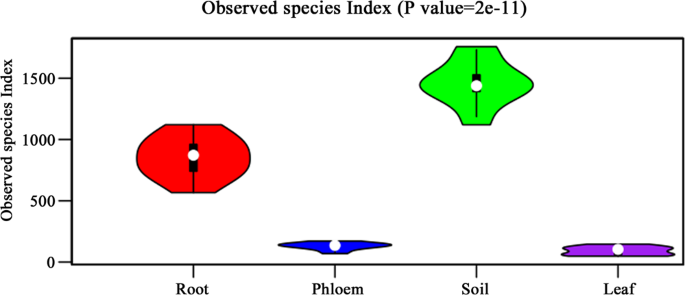
The measurable OUT number of microbial species from different tissues of citrus trees. R stands for root samples, P stands for phloem samples, S stands for soil samples and L stands for leaf samples.
β diversity analysis of samples
Principal co-ordinates analysis (PCoA) of samples from different parts of citrus trees were performed. The samples with the closer distance of Unweighted Unifrac indicated higher similarity between microbial communities. As shown in Fig. 2A, the microbial community in soil samples was more similar to that in root samples with all samples clustered together. The microbial communities in leaf and phloem samples differed significantly. The microbial communities differed significantly among the groups of samples from leaves and phloem. Canonical analysis of principal coordinates (CAP) yielded results similar to PCoA results. CAP analyses might reflect sample-to-sample variation between different sample groups, and the results indicated that all samples were divided into three clusters: 1) soil and root, 2) leaf, 3) phloem (Fig. 2B). The compositions of microbiota among different samples correlated among groups, with major species including Burkholderia Paraburkholderia, Streptomyces, Bryobacter, Acidothermus and Rhizomicrobium for the soil and root groups; Methylobacterium and Amnibacterium for phloem groups; and Ralstonia, Bacteroides, and Candidatus Liberibacter for leaf groups (Table 2).
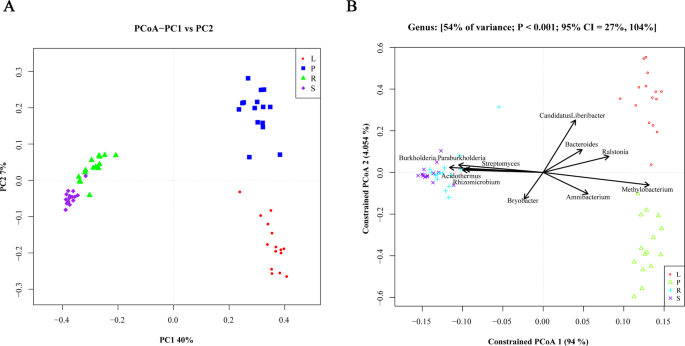
The results of PCoA and CAP analyses in all the samples. (A) The PCoA analysis of microbial species among the total samples. The abscissa (x) represents the first principal component, the percentage represents the contribution of the first principal component to the sample difference; the ordinate (y) represents the second principal component, and the percentage represents the contribution of the second principal component to the sample difference. Each point in the figure represents a sample, and samples of the same group are represented by the same color. (B) The CAP analysis of microbial species among the total samples. The numbers at the top of the figure represent the variance contribution of these factors, P value, and the confidence interval (95% CI) of the variability, respectively. Species with a higher degree of association with the group are indicated by arrows. The length of the line represents the degree of correlation between an environmental factor and the distribution of the community and the distribution of the species. The longer the arrow, the greater the correlation.
Core microbial communities
Twenty-three phyla of microbes were identified from all samples. The dominant phyla were Proteobacteria, Actinobacteria, and Acidobacteria. The core microbial community, defined as the shared microbial species among all independent samples within the same group, is shown in Fig. 3. Ten of the most abundant microbial species in the root and soil groups were from Proteobacteria, Actinobacteria, Acidobacteria, Bacteroidetes, Firmicutes, Chloroflexi, Gemmatimonadetes, Verrucomicrobia, Saccharibacteria, and Thaumarchaeota. However, the proportion of microbes from different phyla showed significant differences between these two groups. For the phloem groups, the major phyla were similar to those from root and soil groups except for Gemmatimonadetes. Core microbial species in the leaf group were Proteobacteria, Actinobacteria, Acidobacteria, Bacteroidetes, Firmicutes, Chloroflexi, Cyanobacteria, and Fusobacteria. Proteobacteria contained the majority of microbial species in both the phloem and leaf samples, representing more than 80% of identified species. The core families and genus of microbial communities were shown in Supplemental Fig. 1.
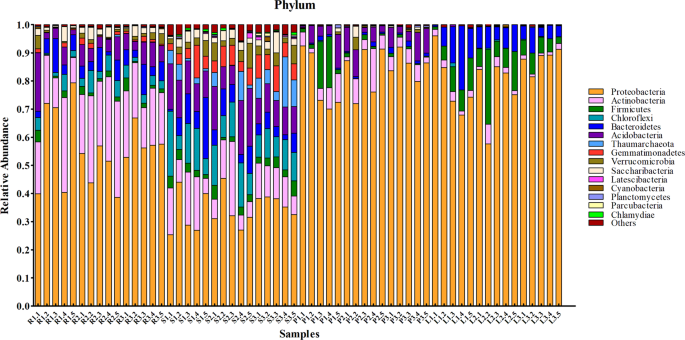
The core phylum of microbial communities in different tissues of citrus trees.
Similarity and difference among microbial community structures
The analytical methods Anosim and Multi-Response Permutation Procedure (MRPP) were used to compare potential similarities and differences among community structures of different sample groups. ANOSIM analyses (analysis of similarities) revealed that all R-values were greater than 0 and all P-values were 0.001, indicating significant differences between microbial community structures among different sample groups (Table 3). MRPP analyses also revealed significant differences with values of expecting delta ranged from 0.08305 to 0.3433 and values of significance 0.001 (Table 4).
Microbial species analyses
The metastat software based on Fisher exact test was used to analyze the differences in microbial species between different sample groups. The species with significant differences between different groups were filtered out according to the P and Q values (Table S2). Rhodopila was unique in the phloem group. Halomonas and Ralstonia were enriched in the leaf and phloem groups (P < 0.01). The abundance of these two microbes in the leaf group was significantly higher than that in the phloem group (P < 0.01). Methylobacterium and Sphingomonas were also very abundant in both the leaf and phloem groups (P < 0.01), with higher abundance in the phloem group. Streptomyces, Burkholderia–Paraburkholderia, and Acidibacter were mainly in the root and soil groups with higher abundance in the root group between the two (P < 0.05). Nitrosopumilus was enriched in the soil group compared to the other three groups (P < 0.01). Rhizobium was more abundant in the root group (P < 0.01).
Identification of microbial indicators
Indicator-values were used as criteria to access the uniqueness of microbial species in each group. As shown in Fig. 4, microbes specific to different groups were found. Among the unique microbes, Dyella, Rhizobium, Kribbella, Streptomyces, Granulicella, Actinospica, Amycolatopsis, Nocardia, Burkholderia. Paraburkholderia and Novosphingobium were identified as the indicators for the root group; Nitrosopumilus, X11.24, Polycyclovorans, OM27clade, Neochlamydia, Gemmatimonas, Cellulosilyticum, Actinomadura, Actinoallomurus and H16 were indicators for the soil group. Bacteroides, Cellulophaga, Vibrio, Prevotella9, Ruegeria, Ralstonia, Faecalibacterium, Erythrobacter, Bosea, and Candidatus Liberibacter were indicators for the leaf group; and Rhodopila, Terriglobus, Amnibacterium, Methylobacterium, Bryobacter, Singulisphaera, Roseomonas, and Hymenobacter were indicators for the phloem group.
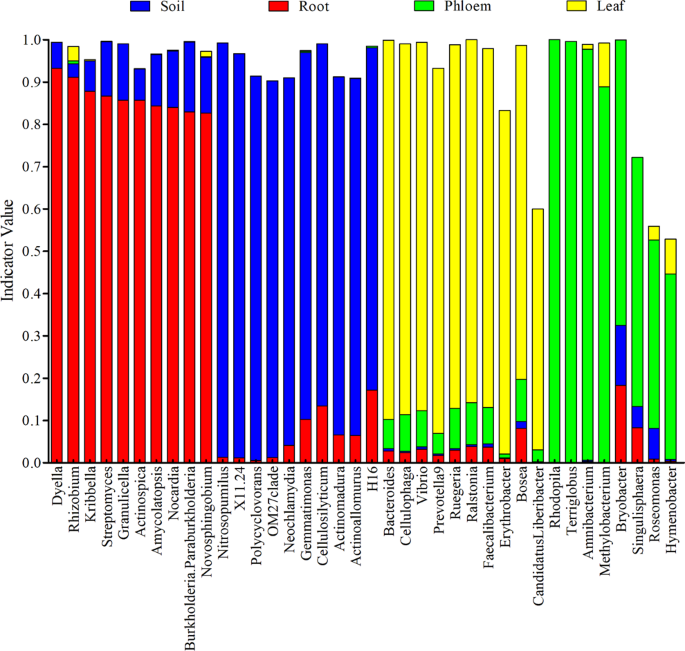
The microbial indicators and indicator-values in different tissues of citrus trees. Different colors in the figure represent different groups. The indicator value of a species in a single group ranges from 0 to 1. When the indicator value is closer to 0, the species classification is almost non-existent in the group; while is closer to 1 indicates that the species is unique to the group and exists in almost all samples.
Source: Ecology - nature.com
