Site description, sampling and bacterial isolation
Different samples were collected from a copper mine located in the city of Canaã dos Carajás, in the state of Pará, Brazil, (06°23′14.9″S–50°03′19.5″W, 238 meters above sea level). In 2018, Sossego Mine produced around 92 thousand tons of copper concentrate51. In the mine, copper is obtained from chalcopyrite ores (CuFeS2) and the raw material is crushed before being processed in a ball mill. After milling, the mineral is recovered in serial floaters using propylene glycol and methyl isobutyl as frothers and amyl xanthate and xanthate ester as collectors. In the sequence, the material passes through a dewatering process, retaining a 30% copper concentrate. The waste generated during floatation, dewatering, thickening, and filtration procedures is discharged in the tailing dam. After self-depuration, water is pumped from the opposite edge of the tailing dam for being reused in the industrial processes.
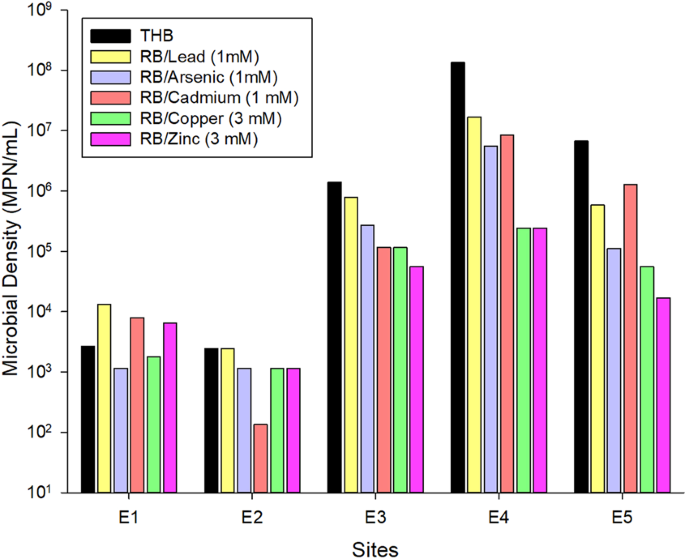
The samples were collected in five different sites (Supplementary Fig. 1) and consisted of three 150 mL subsamples mixed in sterile plastic bottles, which were stored on ice for 48 h until being processed in a laboratory. The five collecting points were: process water (E1); floater surfaces, (E2); the discharging point where the ore processing wastes are thrown in the tailing pond (E3); the edge of the tailing pond where the waste particles are sedimented (E4); the soil close to the edge of the tailing pond affected by the discharged waste (E5). The water of the tailing pond contained low concentrations of Cu (0.006 mg L−1), Ni (<0.001 mg L−1), Pb (<0.001 mg L−1), As (0.01), Al (0.21 mg L−1), Cr (<0.01 mg L−1), Cd (<0.01 mg L−1), Zn (<0.10 mg L−1), Fe2+ (0.13 mg L−1), and Fe3+ (0.1 mg L−1), which do not exceed the maximum values established in the Brazilian guidelines for framing water bodies within quality standards52. Sulfate concentration was higher, corresponding to 263 mg L−1. The site showed a pH of 7.9, a temperature of 27 °C, turbidity of 0.69 NTU, DO of 7.6 mg L−1, BOD < 3 mg L−1, COD of 8.7 mg L−1, P of 0.02 mg L−1, K of 33.1 mg L−1, ammoniacal nitrogen of 0.2 mg L−1, Na of 156 mg L−1, sulfite <2 mg L−1, and sulfide 0.002 mg L−1.
Most probable number (MPN) technique was performed to quantify metal-resistant bacteria and total heterotrophic bacteria (THB) in each sample53. To determine THB density, 180 µL of BHI broth (Difco, Detroit, MI, USA) and 20 µL of the diluted samples (10−1 to 10−7) were added in quadruplicate into the wells of 96-well polystyrene microplates (Sigma, St. Louis, MO). The plates were incubated for seven days at 37 °C and the bacterial respiratory activity, an evidence of microbial growth, was determined by adding to each well 50 μL of 2,3,5-triphenyl chloride tetrazolium (Sigma, St. Louis, MO) at 3.0 g L−1. After 24 h incubation at 37 °C, the pink color in the wells, resulting from reagent reduction, was quantified at 485 nm. After determining the number of positive and negative wells for each dilution, the MPN, represented by the value x, was calculated using Microsoft Excel software and the equation described by Briones Jr and Reichardt54:
$$frac{{a}_{1}.{p}_{1}}{1-{e}^{-{a}_{1}.x}}+frac{{a}_{n}.{p}_{n}}{1-{e}^{-{a}_{n}.x}}={a}_{1}.{n}_{1}+{a}_{n}.{n}_{n}$$
where a is the volume added to each well, p is the number of positive wells, and n is the number of inoculated wells.
To determine the density of the heavy metal resistant HB in the samples, the same procedure was performed, but adding lead, arsenic, and cadmium to the BHI broth at a concentration of 1 mmol L−1, or copper and zinc at a concentration of 3 mmol L−1. The salts used to achieve the desired metal concentrations were Pb(C2H3O2)2·3H2O, Na2HAsO4·7H2O, CdCl2, CuSO4, and ZnSO4 (Sigma, St. Louis, MO). Samples were also grouped, considering the most probable number of heavy metal resistant HB, through PCA using PAST software version 3.04.
To develop the enrichment cultures, 10 mL of each sample were inoculated in 100 mL of BHI broth with lead, arsenic, and cadmium added at an initial concentration of 1 mmol L−1, or copper and zinc at a concentration of 5 mmol L−1. The 25 flasks were incubated for 7 days at 37 °C, and after this period, 10 mL of these cultures were inoculated in a new media containing lead, arsenic, and cadmium at 2 mmol L−1, and copper and zinc at 10 mmol L−1. A new re-inoculation was performed after 10 days under the same incubation conditions in flasks containing lead, arsenic, and cadmium at 3 mmol L−1, and copper and zinc at 15 mmol L−1, which were cultivated for another 15 days. Then, culture aliquots were serially diluted in saline solution (0.85% NaCl), and 100 µL of each dilution from 100 to 10−6 were plated in BHI agar and incubated at 37 °C for 24 h. After growth, all different morphotypes were characterized and counted to determine microbial density. Different colonies were then cultivated and stored at −80 °C on BHI broth plus 20% glycerol.
Bacterial identification
Genomic bacterial DNA was extracted using the guanidine thiocyanate method described by Pitcher et al.55. The concentration and purity of the products were quantified in a NanodropTM 1000 spectrophotometer (Thermo Scientific, Wilmington, Delaware USA) at 260 and 280 nm, respectively. To amplify the 16S rDNA region partial sequences, the universal bacterial primers 8 F (5′-AGAGTTTGATCCTGGCTCAG-3′) and 907R (5′-CCGTCAATTCCTTTRAGTTT-3′) were used56. The amplification reaction was performed in a final volume of 50 µL, containing 10 µL of Taq IVB (5X) buffer, 2.5 U of Taq DNA polymerase buffered with KCl (Phoneutria, Brazil), 200 µmol L−1 of each deoxyribonucleotide (dATP, dCTP, dGTP, and dTTP), 0.3 pmol L−1 of each primer, and 40 to 240 ng of DNA. Amplification was performed in a thermocycler (Veriti, Applied Biosystems, Foster City, Califórnia, USA) under the following conditions: initial denaturation at 94 °C for 5 min, followed by 21 cycles with denaturation at 94 °C for 1 min, annealing at 57 °C for 1 min in the first three cycles, then a decrease of 1 °C for each two cycles until a temperature of 49 °C in the last two cycles, and extension at 72 °C for 3 min, ending with a final extension at 72 °C for 10 min57. The amplification product concentration and purity were also quantified in a NanodropTM 1000 spectrophotometer and the integrity of fragments of roughly 900 bp was analyzed through 10 g L−1 agarose gel electrophoresis.
The amplification products were purified with EDTA plus ethanol absolute, and the concentration and purity were evaluated in the NanodropTM 1000 spectrophotometer. The sequencing reaction was performed in 96-well plates using a final volume of 10 µL. Twenty ng of the purified amplification product were added to the reaction along with the reaction buffer, BigDye® Terminator v3.1 cycle (Applied Biosystems, Foster City, Califórnia, USA), and the same amplification primers at a concentration of 5 µmol L−1. An initial denaturation was performed at 95 °C for 1 min, then 35 cycles were completed with denaturation at 96 °C for 15 s, annealing at 50 °C for 15 s, and extension at 60 °C for 5 min, and a final cooling at 4 °C. The sequencing reaction product was purified using EDTA plus ethanol absolute and the purification product was suspended in Hi-DiTM formamide for analysis in the ABI Prism 3100 sequencer (Applied Biosystems, Foster City, Califórnia, USA).
The nucleotide sequences obtained were trimmed using the Sequencher 4.1.4 software, and, when possible, the reaction products using the different primers were aligned to generate the consensus sequence. Phylogenetic affiliations of these sequences were initially estimated using the GenBank database BLAST tool. When compared, bacterial isolates were considered the same species as the highest score database sequence when the value was greater than 97%58. The reference sequences of all found genera (preferably ATCC, CIP, or NCRB) were downloaded from the GenBank database and aligned with the 16S rDNA bacterial isolates’ sequences using the multisequence alignment program ClustalW59. Phylogenetic affiliations were additionally inferred from this multiple alignment using the maximum-likelihood method60 in the MEGA (Molecular Evolutionary Genetics Analysis 7) software61, and topologies of the resulting trees were evaluated using bootstrap analysis62 based on 1,000 replicates. Methanobacterium ferruginis AB542743.1 16S rDNA gene sequence was used as an out-group. Sequences were deposited in GenBank library and access numbers are provided at Supplementary Table S2.
After bacterial isolates identification, the absolute and relative frequencies of each genera were estimated for the different samples subjected to enrichment. The absolute frequency corresponds to the sum of the count of the same genera colonies in UFC mL−1 in each sample. Relative frequency was calculated by dividing the absolute frequency of each genera by the sum of all the absolute frequencies in the sample.
A NMDS analysis was employed to assess the effect of metal enrichments on the general structure of bacterial isolates from the five mining sites, according to the identified genera and using the Jaccard metric in PAST software version 3.04.
Characterization of exopolysaccharide producing morphotypes
Assays were performed in differential growth media for detecting the production of exopolysaccharides by each morphotype. Each one was inoculated in Congo Red Agar (37 g L−1 BHI, 50 g L−1 sucrose, 10 g L−1 agar, and 0.8 g L−1 Congo Red dye), in which producing colonies present dark pigmentation63, and in BHI agar supplemented with 0.02 g L−1 Calcofluor White M2R (Sigma, St. Louis, MO, USA), in which exopolysaccharide producing colonies fluoresce.
Characterization of the production of bacterial surface active extracellular polymeric substances
Bacterial strains able to synthesize exopolysaccharides were inoculated at an initial concentration of OD600nm 0.1 in 50 mL of minimum mineral media containing 0.5 g L−1 urea, 0.5 g L−1 yeast extract, 0.2 g L−1 ammonium sulfate, 0.1 g L−1 sodium chloride, 0.2 g L−1 magnesium sulfate heptahydrate, 5 g L−1 potassium phosphate dibasic, and 2 g L−1 potassium phosphate monobasic, supplemented with 25 g L−1 glucose. Bacterial cultures were incubated for up to 7 days at 37 °C under agitation of 180 rpm. Finally, each culture was centrifuged at 5,000 g for 15 min, supernatants were evaluated for surfactant and emulsifying activities, and exopolysaccharides extraction was performed.
The capacities of cell-free culture supernatants to reduce the surface tension of growth media were assessed using a K100C-MK2 tensiometer (Kruss, Hamburg, Germany). Measures were performed at room temperature employing a platinum plate.
Supernatant emulsifying activity was quantified according to Cameron et al.64. In screw cap test tubes, 1 mL of the supernatant was mixed with 1.5 mL of toluene (Sigma, St. Louis, MO, USA) and vortexed for 2 min. After 24 h, the emulsifying index (E24) was determined by dividing the emulsified layer height by the total mixture height, and expressing the result as a percentage. Bacterial isolates were grouped in exclusive clusters using the k-means clustering algorithm in PAST software (version 1.90) considering E24 (%) and surface tension (mN m−1) values.
At last, four volumes of ethanol absolute at 4 °C were added to the supernatants for precipitating EPS from cell-free culture media. The precipitate was removed through centrifugation at 5,000 g for 15 min, and after discharging the liquid phase, it was dried at 37 °C for 72 h and weighed to calculate production in g L−1.
Source: Ecology - nature.com
