Field site description
The study site is part of the Loma Ridge Global Change Experiment situated near Irvine, California, USA (33°44′N, 117°42′E, 365 m elevation). The climate is Mediterranean with mean annual temperature of 17 °C and mean annual precipitation of 325 mm. Most precipitation falls between November and April, stimulating plant growth, and a summer drought lasts from May to October. The vegetation at the site includes annual grassland adjacent to coastal sage shrubland which correspond to the two litter types used in the experiment [7, 13]. The grassland plots (6.7 × 9.3 m) consisted of exotic annual grasses such as Avena, Bromus, and Lolium and forbs such as Erodium, whereas the shrub plots (18.3 × 12.2 m) consisted of crown-sprouting shrub species such as Salvia mellifera, Artemisia californica and Malosma laurina. This shrub litter is known to have higher C:N ratio, higher proportion of lignin and other recalcitrant compounds and lower proportion of cellulose, hemicellulose and cell solubles than the grass litter [17]. For our experiment, we used a subset of plots with field precipitation manipulations that have been established since February 2007. Reduced precipitation treatment involved ~40% reduction in precipitation compared with ambient which was achieved by covering plots with clear polyethylene during a subset of rain events each winter. The design was replicated to have four plots per treatment (grassland ambient, grassland reduced, shrubland ambient and shrubland reduced) for a total of 16 plots.
Experimental design and sampling
Litter was collected in summer on 30 August 2017 from all four replicated plots within a treatment and homogenized by hand-mixing. Note that litter from each treatment was kept separate. Litter consisted of freshly fallen dry leaves in shrubland and dry senescing sheath and blade in grassland from leaf fall or grass senescence earlier in the year. Intact shrub leaf litter was used, whereas grass sheath and blade were cut to a length of ~10 cm. Litter bags were made by placing 6 g dry litter mass into 15 cm × 15 cm bags made from 1 mm mesh window screen. Bags were deployed on 12 September 2017. They were placed on top of the soil surface under the canopy. It was a particularly dry season and no substantial precipitation fell until December 2017. An in situ pulse wetting was performed on 30 November 2017 to simulate a discrete rainstorm of ~13 mm using previously collected rainwater (Fig. S1). Litter bags were collected before wetting (Sampling 1) and another batch of bags was collected the following day (Sampling 2). There was no precipitation in the following days and therefore the litter dried to pre-wetting moisture levels (Fig. S1). We collected another batch 12 days after wetting (Sampling 3). The in situ wetting treatment was either too small or too short to elicit a wet-up response (Figs. S2 and S3) [18]; hence we chose not to focus on the effect of wet-up and dry-down on microbial physiology but instead use all three sampling points to study the impact of vegetation type and long-term precipitation treatment on microbial community composition and physiology [12]. Sixteen litter bags were sampled at each time point (two vegetation types × two precipitation treatments × four replicates). Retrieved litter bags were immediately transported to the lab at room temperature. A subsample of leaf litter was ground in a mixer (a quick whirl for 5 s) and used for RNA and metabolite extraction.
RNA extraction and sequencing
We carried out RNA extraction on a coarse-ground litter aliquot of 0.2 g for shrub and 0.5 g for grass using RNeasy PowerSoil Total RNA Kit following manufacturer instructions (Qiagen, Hilden, Germany). Due to a high amount of organic compounds co-extracted from shrub litter, a lower amount of starting material was used in the extraction protocol to increase the RNA yield. After resuspending the RNA pellet in solution SR7 in the final step, purity and concentration of total RNA was assessed using a Bioanalyzer 2100 (Agilent, Santa Clara, CA, USA), Qubit fluorometer (LifeTechnologies, Carlsbad, CA, USA) and Nanodrop 2000 Spectrophotometer (Thermo Scientific, USA). Bioanalyzer-derived abundances of 18S and 16S rRNA in total RNA extracts were used to calculate fungal:bacterial (F:B) ratios. 200–500 ng of total RNA was used for subsequent steps. Ribosomal RNA was removed using a Ribo-Zero rRNA Removal Kit (Illumina, San Diego, CA, USA) according to the manufacturer’s instructions with a modification that included combining magnetic beads from the yeast and bacteria kit as follows: 0.5× Yeast Removal Solution, 0.25× Gram Negative Bacteria Removal solution, and 0.25× Gram Positive Bacteria Removal Solution. Strand-specific and barcode indexed RNA-seq libraries were then generated using the Kapa RNA-seq Hyper kit (Kapa Biosystems, Cape Town, South Africa) following the instructions of the manufacturer. The fragment size distribution of the libraries was verified via micro-capillary gel electrophoresis on a Bioanalyzer 2100. The libraries were quantified by fluorometry on a Qubit fluorometer and pooled in equimolar ratios. The pool was quantified by qPCR with a Kapa Library Quant kit (Kapa Biosystems) and sequenced on one lane of an Illumina HiSeq 4000 (Illumina, San Diego, CA, USA) with single-end 100 bp reads. The sequencing was carried out at the DNA Technologies and Expression Analysis Cores at the UC Davis Genome Center.
Resulting sequences from metatranscriptomic analysis were annotated with the Metagenomics Rapid Annotation using Subsystems Technology (MG-RAST) server version 4.0.3 [19]. Functional classification was performed using the SEED Subsystems database and taxonomic annotations up to genus level were performed using the RefSeq database with a maximum e value cut-off of 10−5, minimum identity cut-off of 60% and minimum length of sequence alignment of 15 nucleotides. Abundance tables derived from MG-RAST (Data S1) were imported into R for downstream analyses. Some samples were excluded from further analyses as we either could not extract good quality RNA (extraction from shrub litter was difficult) or the quality of sequences obtained was poor (due to poor quality RNA or bad sequencing runs). Number of replicates (n) for each treatment combination was: grass ambient sampling 1: 4, grass ambient sampling 2: 3, grass ambient sampling 3: 4, grass reduced sampling 1–3: 4, shrub ambient sampling 1: 4, shrub ambient sampling 2: 2, shrub ambient sampling 3: 3, shrub reduced sampling 1: 4, shrub reduced sampling 2: 2, and shrub reduced sampling 3: 3.
Metabolite extraction and analysis
Coarse-ground leaf litter samples (1 g) were placed in 50 mL tubes with the addition of LC–MS grade water (20 mL, Honeywell Burdick & Jackson, Morristown, NJ, USA). Two extraction controls were included at this step by adding 20 mL of water to empty tubes. All samples were extracted for 1 h on an orbital shaker (Orbital-Genie, Scientific Industries, Bohemia, NY, USA) at 200 rpm at 4 °C followed by centrifugation for 15 min at 3220 × g at 4 °C. Supernatants (8 mL) were filtered through 0.45 um syringe filters (Pall Acrodisc Supor membranes) into 15 mL tubes, frozen then lyophilized. Dried extracts were resuspended in 1 mL LC–MS grade methanol (Honeywell Burdick & Jackson, Morristown, NJ, USA) on ice, vortexed for 10 s, sonicated for 10 min in an ice bath and placed at 4 °C overnight. Samples were centrifuged for 15 min at 3220 × g at 10 °C and further cooled at −20 °C for 10 min. Supernatants (850 µL) were transferred to 1.5 mL Eppendorf tubes and dried down with a Savant SpeedVac SPD111V (Thermo Scientific, Waltham, WA, USA) for 1 h with a final resuspension in ice-cold methanol containing internal standards (200 µL) and filtered through 0.22 µm centrifugal membranes (Nanosep MF, Pall Corporation, Port Washington, NY, USA) by centrifuging at 10,000 × g for 5 min. Samples (50 µL) were transferred to LC–MS vials for metabolomics analysis.
Extracts were analyzed using normal-phase LC–MS using a HILIC-Z column (150 mm × 2.1 mm, 2.7 μm, 120 Å, Agilent Technologies, Santa Clara, CA, USA) on an Agilent 1290 series UHPLC. The two mobile phases for metabolite separation were 5 mM ammonium acetate in 0.2% acetic acid (A) and 95% acetonitrile with 5 mM ammonium acetate in 0.2% acetic acid (B) at a flow rate of 0.45 mL/min with the following gradient: 100% B for 1 min, decreased to 89% by 11 min, down to 70% by 15.75 min and 20% by 16.25 min, held until 18.5 min then back to 100% B by 18.6 min for a total runtime of 22.5 min. The column temperature was maintained at 40 °C. MS data were collected on a Thermo Q Exactive (Thermo Fisher Scientific, Waltham, MA, USA) and MS–MS data were collected using collision energies of 10–40 eV. Metabolomics data were analyzed using Metabolite Atlas [20] with in-house Python scripts to obtain extracted ion chromatograms and peak heights for each metabolite (Data S2). Metabolite identifications were verified with authentic chemical standards and validated based on three metrics (accurate mass <15 ppm, retention time within 1 min, and MS/MS fragment matching). Data from internal standards and quality control samples (included throughout the run) were analyzed to ensure consistent peak heights and retention times. One sample from grass reduced precipitation treatment was lost during the extraction process, otherwise n = 4 for each treatment combination.
Ordination analysis and diversity indices
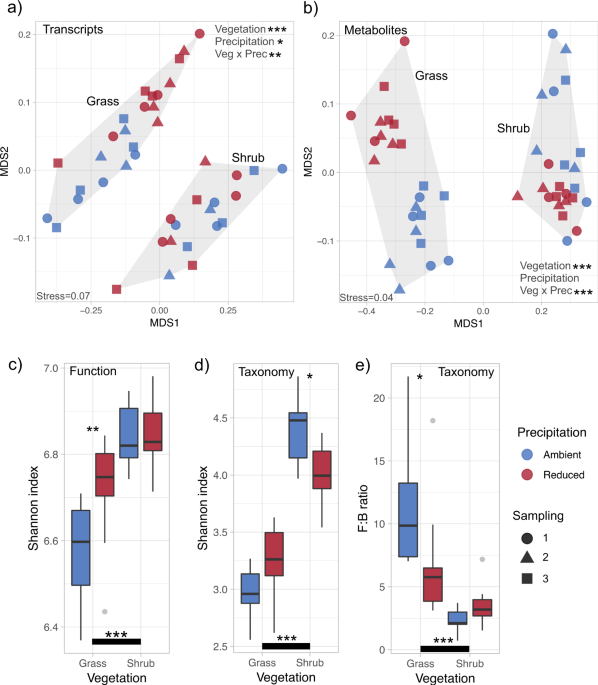
Rarefaction, ordination and diversity analyses of metatranscriptomics-derived functions and taxonomic units as well as metabolites were performed using the vegan package [21], and NMDS plots were generated using the ggplot2 package [22] under the R software environment 3.4.2 [23]. Treatment effects were estimated using permutational multivariate analysis of variance (PERMANOVA) based on Bray–Curtis dissimilarity distance between samples with the R-vegan function adonis. Shannon diversity index was calculated with rarefied functions and taxonomic units. Two-way factorial ANOVA and post hoc Tukey honest significant differences tests were performed to ascertain the effect of treatments on functional and taxonomic α diversity.
Treatment effect size and indicator analysis
We used samples from three time points to measure the impact of vegetation type and long-term field precipitation manipulation on community physiology. The effect of reduced precipitation on the abundances of metatranscriptomics-derived functions at the upper level of SEED Subsystems classification was measured as the ratio of sum-normalised transcript abundance in level 1 classes in reduced and ambient precipitation treatments. One-way ANOVA was used to ascertain if this effect was significant. We did not perform p value correction for multiple comparisons and kept the interpretation of shifts at level 1 classes to the minimum. To identify those transcripts that were significantly enriched in either reduced or ambient precipitation treatments in the two litter types, we used pairwise indicator species analysis as implemented within the R library labdsv [24]. The indval score for each transcript is the product of the relative frequency and relative average abundance within each treatment, and significance (p) was calculated through random reassignment of groups (1000 permutations). This indval score ranges from 0 to 1; maximum score of 1 for a transcript denotes that it is observed in all samples of only one treatment group. Transcripts above a threshold indval score of 0.65 and with a p value smaller than 0.05 were considered significant (Data S3). Indval score was chosen to have enough stringency while also aiming to obtain a manageable and meaningful number of functional indicators. To identify vegetation-specific transcript indicators, we performed the indicator analysis on transcripts from ambient grass and ambient shrub treatments. We observed thousands of grass and shrub specific indicators. The threshold indval score for significance was raised to 0.7 for grass–shrub pairwise comparison to reduce the number of vegetation-specific indicators (Data S4). The frequency of indicator transcripts in level 1 functional classes was obtained using the R plyr package [25].
Heatmap visualisations
Metabolite abundances were visualised using the heatmap function in R. Metabolites that were significantly higher in either ambient or reduced precipitation treatments across both litter types were identified using pairwise indicator species analysis as described above. Here, we did not separate samples from grass and shrub litter in order to reduce choosing litter-specific plant-derived metabolites as indicators. Metabolites above a threshold indval score of 0.6 and with a p value smaller than 0.05 were considered significant. A lower indval score was used here because a higher stringency gave very few indicators.
Correlation analysis and visualisation
Correlations between metabolite abundances were performed to quantify the identified trade offs between traits related to growth and stress tolerance. We tested for negative bivariate correlations between significantly enriched metabolites in either reduced or ambient precipitation treatments across both litter types. Correlation matrix visualization was done using ggcorrplot package in R [26], separating samples from grass and shrub litter. Pearson correlation coefficient was used as a measure of the linear dependence between metabolites. From this correlation analysis, we chose key relevant metabolites that represent the clusters of significantly enriched metabolites to further visualize the metabolic trade offs across and between treatments. These key metabolites were aspartic acid and adenosine (growth indicators), and ectoine and 5-oxo-proline (stress indicators). The psych package in R [27] was used to obtain bivariate scatter plots with linear model fits, correlation coefficients (r) and p values denoting the strength of relationships among the representative metabolites, separately for samples from grass and shrub litter.
Source: Ecology - nature.com
