Animal cultures
Chaoborus larvae hatch from eggs deposited in freshwater and pupate into adult midges after processing through four larval stages that are increasing in body size. Due to the gape limitation of their catching basket, they are size selective in their prey choice, and the smaller instars feed on smaller prey items like ciliates, while the larger instars feed on copepods and cladocerans like D. pulex23. To rule out size selection effects, we choose 4th instar larvae as a representative instar, as these have been well investigated for preying on D. pulex in the 2nd juvenile instar36,37,38. This predator-prey system has been well established in the past36,37,38. We anticipate that the results of this instar are well transferable to the other instars. These instars have the same predator capabilities, with the only exception that they prey on smaller items.
All experiments were conducted between September and December of 2018. Chaoborus obscuripes larvae of the 4th juvenile instar were caught in the ponds of the Ruhr University’s botanical gardens maximally 5 days prior to the experiments. During this season the ponds have a depth-dependent temperature range of 4 °C to 17 °C. During the summer, when larvae are most active, temperatures can reach up to 25 °C. To acclimate larvae to laboratory conditions, we gradually increased temperature by transferring the larvae from 4 °C via 15 °C to 22 °C in temperature-controlled rooms.
In detail, larvae were isolated from the ponds and twenty individuals were transferred into 1.5 L glass beakers (WECK, Germany) filled with artificial M4 media ((pH 8.0, with a pCO2 of ~1,200 µatm, at 4 °C) see Table 3 39), and fed with 50 D. pulex juveniles daily. Larvae were first transferred to a cold room at 4 °C ± 1.0 °C for 24 h (16:8 day:night cycle). Subsequently, they were transferred to a room of 15 °C ± 1.0 °C for 48 h, where the medium warmed gradually to carefully acclimate the larvae. They were then transferred to a climatized laboratory set to 22 °C ± 1.0 °C again for gradual acclimation for 48 h. Larvae were not fed 24 h prior to the experiment.
As prey, we used age- synchronized D. pulex (also collected from the botanical gardens, but had been in the department’s animal culture already since 2017). Daphnia were also kept in 1 L beakers in M4 at 20 °C ± 0.1 °C (16:8 day:night cycle) in densities of 30 animals per litre. D. pulex were fed every 48 h with the green algae Acutodesmus obliquus. Beakers were cleaned and water was exchanged on a weekly basis. To match 4th instar Chaoborus larvae’s prey spectrum, all experiments were conducted with D. pulex that had reached the second juvenile instar22,38.
PCO2 conditions and experimental set-up
We set control conditions to a pCO2 of ~1,300 μatm (Table 4) with a pH of ~8.0 and elevated pCO2 conditions ~12,000 µatm (Table 4) with a pH of ~6.6 as published earlier3. These, in comparison to the ocean, high values in the control condition were selected based on the global mean pCO2 in freshwater habitats9. Similarly, we selected the treatment condition of ~12,000 µatm based on currently observed pCO2 maxima of ~10,000 µatm, resulting from the diel and seasonal fluctuations40. The elevated pCO2 condition was achieved via bubbling and setting the pH to 6.6 prior to the experiments using pH and temperature probes (by Aqua Medic, Germany), documenting temperature levels alongside being stable at ~22 °C. 200 mL of all media were titrated using a Titrino (Methrohm, Switzerland) after the experiments to validate pCO2 and temperature conditions. We determined temperature, pH as well as acid and base capacity for pCO2 calculation via Phreeqc3,41 (see Table 4). The control and the elevated pCO2 condition were both tested on the same day but consecutively. To rule out day-time and circadian rhythm dependent effects, we randomized the sequence in which the two treatments were measured. Each experimental trial started between 9 and 10 a.m. for the first condition and between 12 and 1 p.m. for the alternative condition with the exposure of three Chaoborus larvae to control and three Chaoborus larvae to elevated pCO2 conditions for 24 h in custom made water tanks (12.5 cm × 2 cm × 10.5 cm). Tanks were covered airtight by sealing the lid with parafilm to prevent outgassing. All experiments were performed at a constant temperature (see Table 4) in a temperature-controlled room in above mentioned water tanks. On the following day, i.e. 24 h post exposure (i.e. between 9 and 10 a.m. and between 12 and 1 p.m.), the experiments started with the addition of 100 second juvenile instar D. pulex. Predator and prey were allowed to acclimate for 10 min. Subsequently, larvae predation parameters were monitored for 1 h. During this monitoring period we additionally recorded 5 film sequences of 10 min using an iPhone 7 (Mac iOS 12.4.2 Apple Inc.) interspaced by 2 min. breaks. For that the iphone was fixed in 13 cm distance from the tank using a tripod (KobraTech, Germany). Iphone camera orientation was positioned in parallel to the frontal plane of the tank. To ensure homogeneous illumination, a diffusor plate (customized translucent PVC plate) was positioned behind the tank illuminated by a 15 W LED lamp (IP 65, LE, Germany). As the larvae are about 1.7 to 2.0 cm in size, this allowed us to record activity patterns and predation parameters in the glass tanks over the experimental period. All experimental trials were replicated 17 times.
Analysis of activity patterns
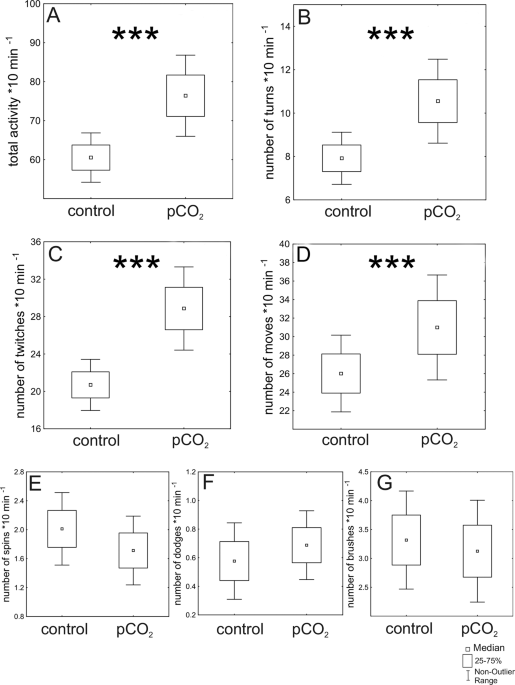
We analysed activity patterns based on recorded videos. Sequences were viewed and analysed using iMovie (Mac OS Mojave Version 10.14.6, Apple inc.). The larvae display distinctive activity patterns, which we categorized into movement categories. A ‘move’ was defined as a forward movement of a larva. A ‘turn’ was defined as a 180° change in orientation, while a ‘spin’ was defined as a full 360° turn around the body axis. A ‘twitch’ was defined as a sudden, undirected convulsive movements. A ‘dodge’ describes the movement, when larvae tried to avoid contact to other larvae. A brush describes a movement in which the larvae clean their tail fan. The category total activity level comprises the sum of all movement categories of the experimental population.
Predation parameters
During the one hour observation period, we counted all strikes, catches, and ingestions of the larval attacks (according to22) and thereby determined the population’s predation parameters. We then calculated the proportion of strikes that led to catches (in %) and the proportion of catches (%) during this one hour.
Predation rate
To analyse the effects of pCO2 on the predation rate of Chaoborus, we reared one Chaoborus larvae for 24 h in 250 mL M4 either in the control condition or aerated with CO2 (Table 4). The experiment started with the addition of 20 second juvenile instar D. pulex. After 4 h we counted remaining Daphnia and determined the number of consumed animals. We replicated this experiment 7 times.
Statistics
In total, we performed 17 experimental replicates in the control condition and 17 experimental replicates in the pCO2 condition. In the pCO2 condition one replicate had to be excluded due to instabilities in pCO2 (therefore Ncontrol = 17; NpCO2 = 16). Activity patterns and predation parameters were calculated as the summated activity of all three larvae and therefore represent the population’s total activity. We recorded activity parameters (i.e. total activity, turns, twitches, dodges, spins, moves and brushes) 5 times (for 10 min) within one hour observation time (Ncontrol = 85 and NpCO2 = 80). To determine if elevated pCO2 has a significant effect on activity patterns we performed generalized linear mixed models (GLMMs) in combination with a poisson distribution for count data, where the different activity parameters were used as response variables, and treatment (control, elevated pCO2) was used as fixed effect. As we measured 5 times per 1 h, we included time as a random factor (to reflect a repeated measures design). We fitted the GLMMs using the glmer function implemented in the lme4 package in R; www.raproject.org 42).
To analyse count data obtained in the predation parameter ‘strike’ and predation rate, we performed linear mixed models using the glm function and a poisson regression in R. Percent data (i.e. relative catches, and relative ingestions) were analysed using a beta regression using the betareg function in the Betareg package in R according to43. As relative ingestion data contained 0 and 1, data was transformed as suggested by44 using formula x′ = (x(N − 1) + s)/N (with N = sample size and s = 0.5). All models were validated by visual inspection of the normalised residuals based on the REML fit against fitted values to identify possible violation of homogeneity, according to45,46. We tested for overdispersion; a dispersion value of <2 was considered not overdispersed46. None of our data was overdispersed.
Source: Ecology - nature.com

