Observed declines in burned area and fire emissions
Global BA decreased by 34 Mha per year (−9%) between 2001–2007 and 2008–2014 according to the Global Fire Emission Database (GFED4), and by 52 Mha per year (−10%) according to GFED4s that accounts for small fires using thermal active fire data in addition to the BA detected from changes in surface reflectance retrieved from the MODIS (Moderate Resolution Imaging Spectroradiometer) instrument29,30. BA declines occurred mostly in savanna (−10 Mha per year, −8%), woody savanna (−9.6 Mha per year, −7%), and grassland (−9.5 Mh per year, −21%) according to the MODIS land cover type31 (Fig. 1). The decrease of BA in the open shrubland is also large (−3.3 Mha per year, −15%) but has considerable interannual variations, whereas the decline in closed shrubland is significant but small in absolute magnitude (−0.7 Mha per year, −23%). In contrast, BA changes in forest—which have on average much lower fire frequencies—are relatively small in absolute magnitude and are associated with large interannual variations. The land cover types showing large BA declines have in general relatively short fire return times ranging from 1 year to a few years3, places showing significant decadal fire reductions are hence expected to experience changes in fire frequency and thus deviations from their typical fire disturbance-recovery trajectory. Additional BA dataset (ESA-CCI)32 that are also derived from MODIS instrument with a different algorithm shows a comparable spatial pattern as GFED4 and a decrease by 23 Mha per year (−6%) between the two periods (Supplementary Fig. 2). Relatively smaller declines are found when small fires are not explicitly considered. Here, we use GFED4s as the reference version for further analysis as it is important to account for variations in small fires to fully capture fire dynamics29.
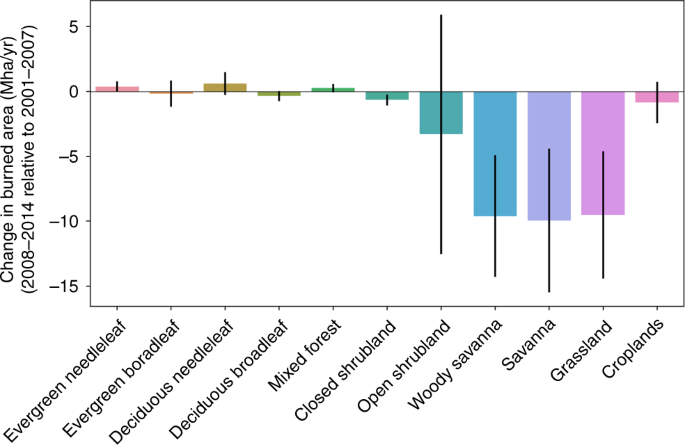
Burned Area (BA) estimates are from GFED4 dataset (synthesis of MODIS MCD64A1) and land cover type from MODIS MCD12Q1 product. The error bars show the uncertainty of individual year-to-year differences between the two period 2008–2014 and 2001–2007.
Fire carbon emissions estimated using CARDAMOM amount to 2.1 ± 0.1 PgC per year (1PgC = 1e15 g Carbon) across the globe for the period 2001–2007 and 1.8 ± 0.1 PgC per year for the period 2008–2014 (Fig. 2, mean ± standard deviation across different years based on CARDAMOM median estimates). An average decrease rate of −1.5% per year is found over the period 2001–2014 (p = 0.01), with a faster decline of −1.8% per year (p = 0.02) during the latter half from 2007 to 2014 compared to the non-significant decline during the first half from 2001 to 2007 (−0.4%, p = 0.5). This decadal decrease is supported by the GFED bottom-up approach and the MOPITT CO-inversion top-down estimates (Supplementary Fig. 3). Reductions in fire emission between the two episodes are mostly contributed by North Africa (i.e., the Sahel and sub-Sahelian regions, −70 ± 9 TgC per year, −16%) (1 TgC = 1e12 g carbon), southern South America (−60 ± 20 TgC yr−1, −30%), northern South America (−53 ± 9 TgC per year, −36%), Southeast Asia (−55 ± 22 TgC per year, −24%), Australia (−23 ± 4 TgC per year, −16%), and Europe (−7.5 ± 0.8 TgC per year, −30%) (mean ± standard deviations among the three approaches).
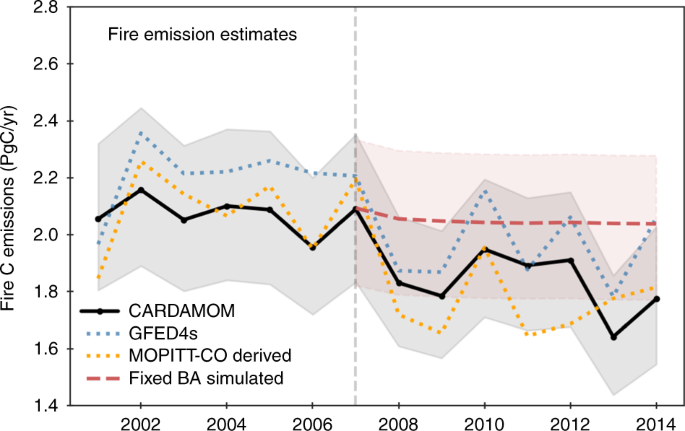
The solid black line represents fire carbon emissions estimated by the ensemble median of CARDAMOM, and the shading describes the first and third quartiles using a Monte-Carlo sampling of the parameters. The dotted blue line shows GFED4s bottom-up estimates, and the dotted orange line shows the estimates derived from MOPITT CO inversion and biome-specific emission ratios between CO and total carbon. The dashed red line represents simulated fire emissions using the average burned area during 2001–2007.
Impacts of fire decline on the subsequent carbon cycle
To quantify the impact of the observed BA decline between 2001–2007 and 2008–2014 on the carbon cycle, we performed a CARDAMOM control run with a constant 2008–2014 burned area, using average 2001–2007 burned area values. All else being equal, the simulated differences between the observation-retrieved carbon cycle states and fluxes (henceforth denoted as Observed BA) relative to the control run (henceforth denoted as Fixed BA) represent impacts of the Observed BA decline relative to the mean 2001–2007 fire levels. Fire emissions estimated using the Observed BA are 0.2 ± 0.1 PgC per year lower compared to the hypothetical case of Fixed BA averaged over 2008–2014 (Fig. 2, Fig. 3a). Beyond the 2008–2014 experiment window when all setups return to the same to evaluate the legacy effects of previous fire, differences in fire emissions between Observed BA and Fixed BA (ΔFIRE) reduced to +0.03 PgC per year averaged over 30 years. The slightly higher fire emissions associated with Observed BA result from larger fuel loads, because a lower 2008–2014 fire level had burned fewer organic matters and allowed more vegetation to regrow.
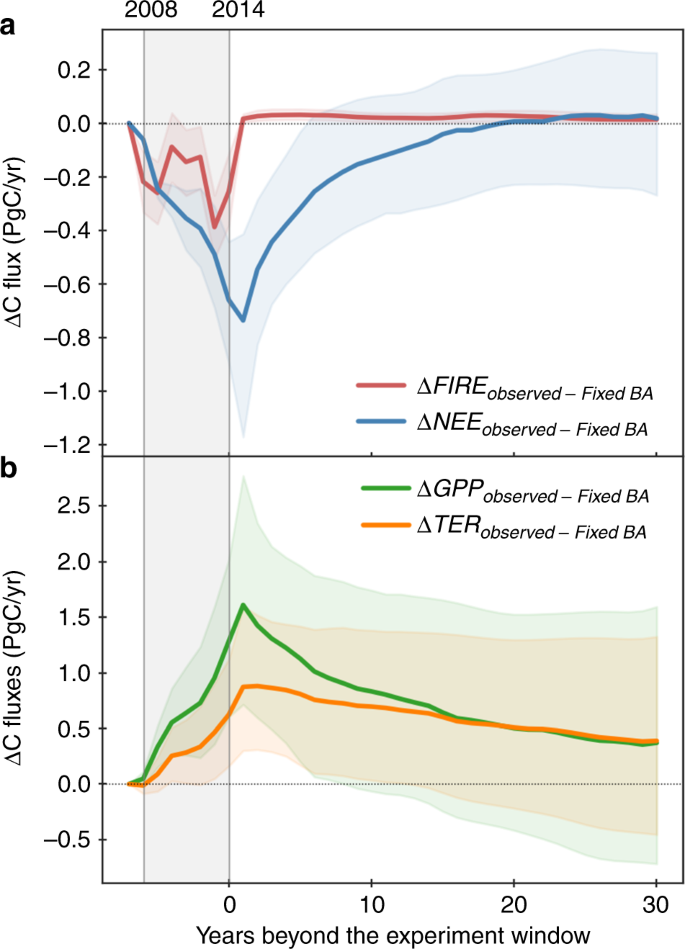
a Relative differences in the simulated global fire carbon emissions (ΔFIRE) and net ecosystem exchange (ΔNEE), and b Relative differences in the simulated global Gross Primary Productivity (ΔGPP) and Terrestrial Ecosystem Respiration (ΔTER) between the Observed BA and the hypothetical BA scenarios—Fixed BA. The lines show the model median and the shadings show the range between 1st and 3nd quartile. Different BA scenarios are only applied within the experiment window (2008–2014) as marked by the grey shade, resultant differences beyond 2014 represent legacy effects of different BA during 2008–2014. Actual meteorological data is used from 2001 to 2014, and the same forcing data is repeatedly used for all scenarios beyond 2014 including the Observed BA.
BA declines also result in a higher gross primary productivity relative to the control run (ΔGPP), as reduced fire occurrences allow more biomass to grow and hence an enhanced photosynthetic capacity (Fig. 3b). The increase in ΔGPP due to BA decline results in an increase in the live biomass (Fig. 4), and an increase in turnover-induced dead carbon pool inputs; conversely, the BA decline results in a reduction in fire-induced mortality and hence a decline in dead carbon pool inputs. Due to the competing mortality processes the net dead organic carbon stock changes are more uncertain (Fig. 4). However, the overall increase in the terrestrial ecosystem respiration (ΔTER) is a factor of two smaller than ΔGPP (Fig. 3b), thus resulting in a significant net ecosystem exchange (ΔNEE) reduction relative to the case of Fixed BA averaged over 2008–2014 (ΔNEE = ΔTER−ΔGPP, with positive values representing net fluxes from the land to the atmosphere). The indirect effect of fire decline on NEE is roughly twice the magnitude of the corresponding direct impacts on fire emissions.
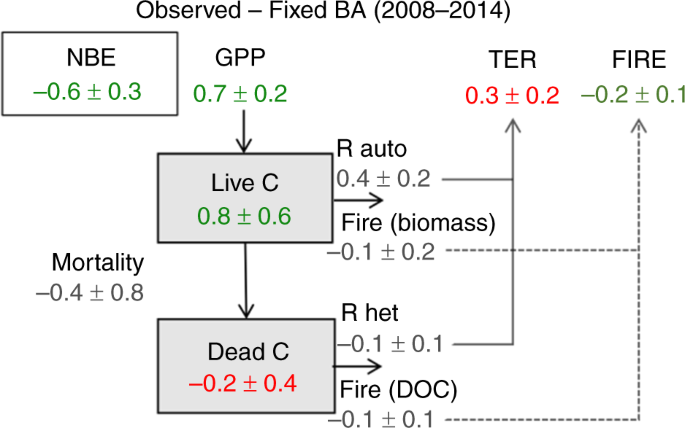
The 2008–2014 average differences between the Observed BA and Fixed BA scenarios are shown (Units: PgC per year). Increases in the land sink is denoted in green and decreases in the land sink is denoted in red. NEE = TER − GPP and NBE = NEE + FIRE; negative NBE values represent net fluxes from the atmosphere to the land. Uncertainties are estimated by MCMC simulations.
Unlike ΔFIRE that show immediate responses to concurrent BA changes, ΔNEE increases gradually within the 2008–2014 experiment window as the cumulative differences in BA (ΔBA) grow (Fig. 3a). The magnitude of ΔNEE fluxes starts to decrease with a 1-year lag beyond the experiment window (i.e. response to ΔBA of previous years), showing a near exponential decline of the legacy effects (Fig. 3a). The average ΔNEE during the first 5 years after BA perturbation is comparable to average effect within the experiment window (−0.4 ± 0.1 PgC per year), but they reduce to <50% and 10%, respectively, for the 6-to-10-year and 11-to-20-year windows (Fig. 3a). When accounting for fires, a neutral Net Biome Exchange (NBE = TER + FIRE-GPP) is reached within 18 years for the global average, more rapidly in South America and Africa (Supplementary Fig. 4), where a dominant contribution came from savanna ecosystem that are associated with a relatively short carbon residence time compared to forest21,22,33.
The GPP enhancement (and associated NEE reduction) is mostly attributable to the same regions exhibiting significant fire emission reductions (Fig. 5), namely the Sahel region in North Africa and dry sub-tropics in South America. In these dry tropical areas, positive trends are observed in the dry season enhanced vegetation index (EVI) and near-infrared reflectance of vegetation (NIRv) over the study period 2001–2014 (Supplementary Fig. 5), which is in agreement with our simulated responses in GPP to the burned area reduction. Besides, forest expansion and woody encroachment in the savannahs in Central and Western Africa are observed from space34, consistent with our simulated responses to BA decline (Fig. 5). The regions in the dry tropics showing significant responses in simulated NEE are also generally in line with areas where satellite-based aboveground biomass estimates indicate net gains35. We note that the estimated increase in GPP due to reduced fire did not account for nutrient limitation36 or grazing37, thus our estimation might be on the higher bound and future studies are needed to better understand the long-term effect to account for those factors along with vegetation successions38. Nevertheless, our simulated gains in the above-ground biomass after 7 years of fire reduction are in line with site-level observations that show substantial accumulation of woody biomass relative to 1-year fire frequency sites (+220 gC m−2) or relative to 3-year fire frequency sites (+130 gC m−2) after long-term fire exclusion in a tropical savanna ecosystem39, as well as a +160 gC m−2 increase in grass biomass compared to the 1-yr fire frequency site (Supplementary Fig. 6). This site-level comparison shows the estimated carbon enhancement are realistic at a process level. The simulated responses are also comparable with boreal fire studies showing a decrease of net primary production (NPP) by 60–260 gC m−2 per year after fire disturbance40.
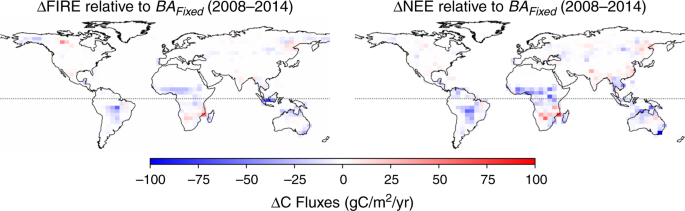
Differences in the CARDAMOM simulated fire and NEE fluxes between the Observed BA and the Fixed BA scenarios averaged between 2008 and 2014.
Implications for the global carbon cycle
Accounting for our estimation of the fire decline impacts on the global carbon cycle relative to the case of Fixed BA at average 2001–2007 fire level, we could better explain the observed airborne fraction building on estimates of the other components from the GCP (see Methods). The adjusted airborne fraction estimates accounting for both direct and indirect effects of fire decline relative to the 2002–2007 mean significantly reduces the mean bias of the initial GCP estimates by 86% and the RMS by 53% reduction (Fig. 6). This improvement suggests that the enhancement of the land carbon sink due to fire reduction might have contributed to the global carbon budget with a magnitude comparable to the current estimates of the imbalance. It could have played a significant role in the recent terrestrial carbon sink increase, in addition to the widely recognized impacts of climate warming, CO2 fertilization, and land use change as addressed in GCP13, as well as other processes that are not explicitly accounted for. While land use change emissions do account for fire emissions, in particular, those related to deforestation and cropland conversion, and typical subsequent recovery13,16,19, the mechanisms we highlight here include the explicit representation of feedbacks between reduced fires and increased leaf area, potential limitations induced by additional growth potential through water availability, and subsequent impacts on heterotrophic respiration. Further investigation into the relative impacts of these processes is critical to improve understanding and reduce uncertainty on the response of ecosystems to reduced fire activity. We also note that although CARDAMOM results explicitly represent the role of parametric uncertainty on the reported increases in GPP and NEE, it is necessary for future efforts to investigate the role of model structural uncertainties.
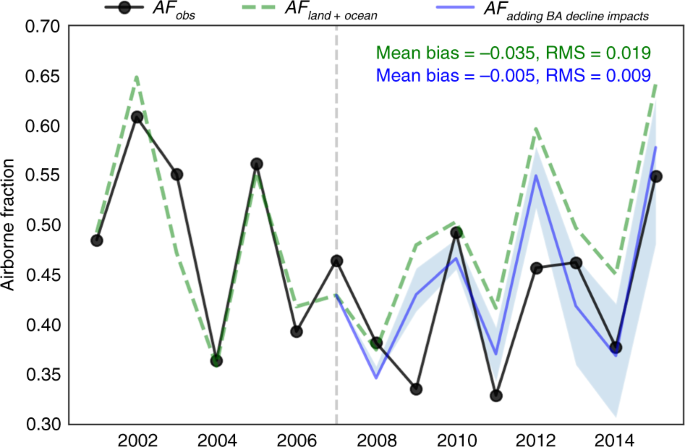
The impacts of fire decline between 2008–2014 and 2001–2007 are evaluated here. Emissions from Fossil fuel (EFF) and from land use change (ELUC), atmospheric CO2 growth rate (GATM), and process-based sink estimates for ocean (SOCEAN) and land (SLAND) are derived from GCP 2018 estimates to determine the airborne fraction (each component shown in Supplementary Fig. 10. AFobs = GATM/(EFF + ELUC), showing the observed GATM relative to the total emissions from EFF and ELUC; AFland+ocean = 1 − (SOCEAN + SLAND)/(EFF + ELUC), representing the portion of AF variations that can be explained by current process-based estimates of land and ocean sinks; AF+BA Decline = 1 − (SOCEAN + SLAND − ΔFIRE − ΔNEE)/(EFF + ELUC), representing the adjusted AF by adding for our estimates of BA decline impacts relative to the mean 2001–2007 BA. Note that the adaptations to 2015 are only due to the legacy effect of the period 2008–2014.
Here, we focus on the impacts of fire decline between the two periods, 2001–2007 and 2008–2014, hence the legacy effects of past fire dynamics (those before 2007) are not explicitly addressed—even though their impacts are implicitly included in the carbon cycle parameters inferred from satellite data using CARDAMOM. Their impacts would have been identical for our sensitivity simulations, thus not impacting the results deduced from differences between the BA scenarios. Trace gas mixing ratios in ice cores and charcoal data indicates a much higher biomass burning emissions over the past millennium compared to the contemporary level41,42. African fires, contributing to around 60% of the global fire carbon emissions, have declined since the 1950s9. A recent model study showed that increasing population densities and cropland area have decreased global BA since the 1930s and result in a significant reduction in global fire emissions (0.13 PgC per year for the period 1960–2009)43, but the indirect impacts on NEE in addition to fire emissions are not analyzed explicitly. The much larger magnitude of the indirect, lagged NBE effect, as we show here, due to fire decline relative to its direct impacts on fire emission implies an even larger contribution of fire declines to the global land sink increase during the past decades. Missing this important mechanism in explaining the global land carbon sink increase over the past decades could lead to an overestimation of other processes, such as CO2 fertilization44,45, and thus significant biases in future carbon-climate feedback projections. The indirect effect of the global burned area decline is an overlooked mechanism that may explain some of the land carbon sink increase in recent decades. This mechanism is likely effective at a decadal time scale, if a lower fire level is sustained, till the ecosystem reaches a steady state but unlikely to continue indefinitely as climate projections suggest increased fire risk8 and extreme droughts associated with El Niño events could result in non-linear fire responses5,18. Therefore, fire management is an important strategy for terrestrial carbon storage and thus climate mitigation.
Source: Ecology - nature.com
