Data collection
With the aim of constructing a comprehensive database of the experimentally determined effects of P additions on aboveground plant production in global terrestrial ecosystems, we collected as many experiments that fulfilled our criteria (described below) as possible. Relevant studies were identified by searching ISI Web of Knowledge, Google Scholar, and China Knowledge Resource Integrated Database using combinations of keywords such as “phosph* addition”, “phosph* fertili*”, “phosph* enrich*”, “aboveground biomass”, “primary product*”, “crop yield”, and “grain yield”. Our survey also included studies summarized in previously published syntheses and the subsequent relevant studies citing those syntheses. A PRISMA flow diagram (Supplementary Fig. 12) shows the procedure we used for the selection of studies.
To be included in our database, published experiments were required to satisfy the following criteria: (1) the P-addition experiment was conducted in the field and included P-addition and control treatments within the same ecosystem under the same environmental conditions, and also included measures of aboveground plant production in both P-addition and control treatments; (2) no fertilization was recorded in the control treatment either before the start of the experiment or during the experiment; (3) the P treatment received a P fertilizer that did not contain N so as to avoid the effect of N; as a result experiments with application of ammonium phosphate, manure or other fertilizers were excluded.
To be considered an experiment in our analysis, a reported experiment had to be temporally and spatially distinct and had to have internally consistent controls. Multiple experiments could be reported by one publication; for instance, the application of the same experimental treatments was considered to represent multiple experiments if the treatments were applied at several sites with different vegetation types. When multiple measures were reported over time at a single experimental site, we used the latest measure. When multiple levels of P fertilizer treatments were reported, we used the measure with the highest amount of P addition. Choosing the latest measure and the highest P addition amount increased the likelihood that P additions fulfill plant demand and overcome the sorption of P fertilizer by soils and soil microbial competition for P fertilizer25,27. When multiple forms of P fertilizers were tested, we chose the treatment of single superphosphate or triple superphosphate if available.
We included only experiments that reported the response of community-level aboveground plant production to P additions. Single-species responses were not included unless drawn from a mono-dominant community. If several species from a community were individually assayed, an average across all species was used. Experiments in forest or savanna ecosystems that only reported the response of understory or herbaceous response to P additions were not included. Experiments with only stand biomass responses were excluded unless the stand biomass data could be used to calculate aboveground plant biomass production.
Ecosystems were classified as forest, grassland, tundra, wetland, or cropland; natural forests, plantations, shrublands, and savannas were all classified as forest. In forest ecosystems, beside aboveground plant biomass production (N = 33), we also accepted proxy variables that are known to be correlated with aboveground plant biomass production, such as litterfall production (1) and the rate of increase in tree diameter (34), stem volume (25), basal area (25), or height (16) (Supplementary Table 5). We showed that the weighted Ln(RR) did not differ significantly among the various variables used (Supplementary Table 5). In croplands, beside aboveground plant biomass production (N = 85), we also accepted marketable yield (131), because we found that marketable yield responded similarly to P additions as aboveground plant production in the croplands based on studies that reported both measures (Supplementary Fig. 13). In tundras, beside aboveground biomass production (N = 10), we also included leaf mass per tiller (4), tiller biomass (1), and plot level NDVI (1) (Supplementary Table 5). In wetlands, beside aboveground biomass production (N = 72), we also included height increase (5), leaf area index (3), the production of whole plants (3), and chamber based gross primary production (2) (Supplementary Table 5).
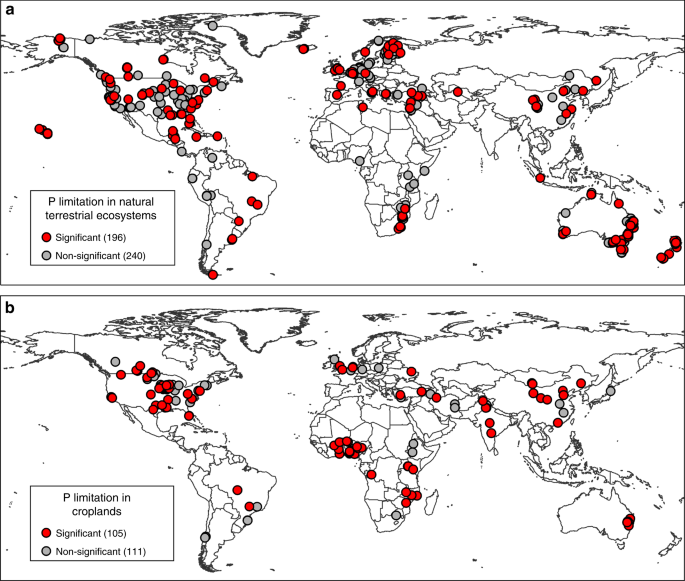
In total, we collected data from 652 P addition experiments reported in 285 published papers, including 436 experiments from natural terrestrial ecosystems (including forests, grasslands, tundras, and wetlands) and 216 experiments from croplands (see experimental locations in Supplementary Fig. 1a). Beside aboveground plant production measures, our database also included site characteristics and fertilization regimes, which were used to explain the variation in Ln(RR). Site characteristics included site location (latitude and longitude), climate variables (MAT and MAP), topographical conditions (altitude and slope), plant characteristics (vegetation type, and symbiotic N fixation), soil type, soil physiochemical properties before the experiments began or from the control treatments (concentrations of available P, organic C, and total N; pH in water; and particle size), and parent material type. For each experiment in forest ecosystems, forest composition (i.e., pure or mixed forest) and the average forest age during the experiment were also recorded.
Data preparation
In cases where the referenced studies did not report the latitude or longitude of the P-addition experiment (52% of the studies did not report both latitude and longitude), the approximate latitude and longitude were derived by geocoding the name of the location in Google Earth 7.0 (the free version). In cases where the referenced studies did not report MAT (76%), MAP (54%), or altitude (65%), the values were derived from WorldClim39 using site geographic location (i.e. latitude and longitude). The aridity index (AI) of each site was obtained from CGIAR-CSI using data from WorldClim40; the AI value decreases as aridity increases.
Soil type was classified according to the U.S. Department of Agriculture soil classification system41. Soils were grouped based their degree of weathering according to previous studies42,43: Andisols, Histosols, Entisols, and Inceptisols were considered to be slightly weathered soils; Aridsols, Vertisols, Mollisols, and Alfisols were considered to be intermediately weathered soils; and Spodosols, Ultisols, and Oxisols were considered to be strongly weathered soils. Parent material types were grouped into four geological classes according to a previous study8: acid, intermediate, mafic, and calcareous rocks.
For comparison of P effect sizes among regions, experiments in the database were grouped in four different ways. First, experiments were grouped according to their continental locations: Australia, Asia, Africa, Europe, North America, and South America. Second, experiments were grouped based on absolute latitude into four latitude belts or regions: tropic (23.4 oS–23.4 oN), subtropic (23.4–35 oS or oN), temperate (35–50 oS or oN), and (sub)arctic (>50 oS or oN). Third, experiments were grouped according to altitude into low-altitude experiments (< 1000 m a.s.l.) and high-altitude experiments (≥1000 m a.s.l.). Finally, experiments were divided based on site aridity level into five groups: arid (AI ≤ 0.20), semi-arid (0.20 < AI ≤ 0.50), dry subhumid (0.50 < AI ≤ 0.65), sub-humid (0.65 < AI ≤ 1.0), and humid (1.0 < AI). The complete dataset is available at Figshare44.
Phosphorus limitation threshold
One major objective of our study was to map the global distribution of experiments in which P significantly limited aboveground plant production. To do this, we had to define a threshold value that separated experiments that did or did not find significant P limitation. We estimated the threshold value separately for the natural terrestrial ecosystems and the croplands, using a method described in a recent study8. In general, we first collected the reported statistical responses of aboveground plant production to P additions from the source references. We then investigated the distribution of the Ln(RR) values. Finally, we identified the threshold value of the Ln(RR) that optimizes the distinction between statistically significant positive P effects and statistically non-significant P effects. Of the 128 experiments in the natural terrestrial ecosystems that reported a significant P limitation, 84% had an Ln(RR) value ≥ 0.23 (Supplementary Fig. 3a). Similarly, of the 162 experiments in the natural terrestrial ecosystems that reported a non-significant P effect, 85% had an Ln(RR) < 0.23 (Supplementary Fig. 3b). When the two groups were combined, the maximum percentage (84%) of correct classification (i.e., a significant positive effect was classified as a significant case and a non-significant effect was classified as a non-significant case) was obtained with an Ln(RR) value of 0.23 (Supplementary Fig. 3c). Therefore, 0.23 was used as the threshold Ln(RR) value to distinguish significant from non-significant P limitation in natural terrestrial ecosystems. This threshold value is close to the one used in a previous study (Ln(RR) of 0.20)8. A similar approach was applied to the P-addition experiments in the croplands, such that 0.09 was used as the threshold Ln(RR) value for croplands (Supplementary Fig. 3d–f).
Meta-analysis
We quantified the magnitude of P limitation at the global scale and in various groups of ecosystems by weighting the Ln(RR) with the inverse variance and a random-effect model16,17,18,19. To do this, we extracted means, standard deviations (SDs), and sample sizes (n) from the published studies. If standard error (SE) rather than SD was reported, SD was calculated:
$$SD = SEsqrt n$$
(1)
If neither SD nor SE was reported, we approximated the missing SD by multiplying the reported mean by the average coefficient of variance of our complete dataset. If sample size was not reported, we assigned sample sizes as the median sample size of our complete dataset. We approximated the SDs and the sample sizes separately for the natural terrestrial ecosystems and the croplands and also separately for the control and the P-addition treatments (see details in Supplementary Table 4).
The Ln(RR) of an experiment was calculated as follows:
$${mathrm{Ln}}left( {RR} right) = {mathrm{Ln}}frac{{overline {X_t} }}{{overline {X_c} }} = {mathrm{Ln}}left( {bar X_t} right) – {mathrm{Ln}}left( {bar X_c} right)$$
(2)
where (bar X_t). and (bar X_c). are mean aboveground plant production in the P treatment and control, respectively.
The weighted mean response ratio (Ln(RR+)) of a group of ecosys was follows:
$${mathrm{Ln}}left( {RR_ + } right) = frac{{mathop {sum }nolimits_{i = 1}^m w_i^ ast times Ln(RR_i)}}{{mathop {sum }nolimits_{i = 1}^m w_i^ ast }}$$
(3)
where m is the number of experiments in the group (e.g., a region), and (w_i^ ast). is the weighting factor of the ith experiment in the group. The (w_i^ ast). was calculated as follows:
$$w_i^ ast = frac{1}{{v_i^ ast }}$$
(4)
where (v_i^ ast). is the variance of study (i) in the group. The (v_i^ ast). was calculated as follows:
$$v_i^ ast = v_i + T^2$$
(5)
where vi is the within-study variance of study (i), and T2 is the between-studies variance. The vi was calculated as follows:
$$v_i = frac{{S_t^2}}{{n_tbar X_t^2}} + frac{{S_c^2}}{{n_cbar X_c^2}}$$
(6)
where nt and nc are the sample sizes for the P treatment and the control groups, respectively, and St and Sc are the standard deviations for the P treatment and the control groups, respectively, of study (i). The calculation of T2 can be seen in Borenstein et al.45.
The standard error of the Ln(RR+) was calculated as:
$$sleft( {{mathrm{Ln}}left( {RR_ + } right)} right) = sqrt {frac{1}{{mathop {sum }nolimits_{i = 1}^m w_i^star}}}$$
(7)
The 95% confidence interval (CI) for the Ln(RR+) was calculated as follows:
$$95% CI = {mathrm{Ln}}left( {RR_ + } right) pm 1.96sleft( {{mathrm{Ln}}left( {RR_ + } right)} right)$$
(8)
If the 95% CI did not overlap with zero, the overall P addition effect in the group of experiments was considered significant. The percentage change in aboveground plant production induced by P addition (i.e., the effect size) in a group of ecosystems was measured as follows:
$${mathrm{Effect}};{mathrm{size}}left( % right) = ({mathrm{exp}}left( {{mathrm{Ln}}left( {RR_ + } right)} right)1)100%$$
(9)
The meta-analyses were performed using “meta” package in R version 3.3.146.
To compare our analyses with the previous meta-analyses1,8,9, we also calculated the global magnitude of P limitation using two other methods:
- (1)
Ln(RR) weighted uniformly1,8, where effect size only depends on the means of control and P treatment groups.
- (2)
RR weighted by the inverse variance9, where the RR rather than the Ln(RR) is weighted by the inverse variance.
We also calculated the global magnitude of P limitation by considering the effects of the quantity of P added and experimental duration:
- (3)
Ln(RR) weighted by the quantity of P added. The weight of each experiment was calculated as follows:
$$w_P = frac{P}{{mathop {sum }nolimits_{i = 1}^M P_i}}$$
(10)
where P is the cumulative quantity of P added during the experiment (kg ha−1), and M is the number of experiments in the natural terrestrial ecosystems (436) or the croplands (216).
- (4)
Ln(RR) weighted by experimental duration. The weight of each experiment was calculated as follows:
$$w_D = frac{D}{{mathop {sum }nolimits_{i = 1}^M D_i}}$$
(11)
where D is the duration of the experiment (yr).
We checked the quality of our meta-analysis according to the checklist of Koricheva and Gurevitch19. Our meta-analysis fulfilled all of the quality criteria for a meta-analysis in plant ecology (Supplementary Table 6). We performed two sensitivity tests (Supplementary Fig. 4). One was the leave-one-out meta-analysis using the “metainf” function. The other was the cumulative meta-analysis using a random-effect model in the “metacum” function based on inverse-variance weighted Ln(RR). The cumulative meta-analysis was repeated 1000 times with random orders of experiments. We also ran a cumulative meta-analysis using the “metacum” function based on the uniformly weighted Ln(RR). We created funnel plots to detect possible publication bias using the “funnel” function. The possible publication bias was statistically tested using the “metabias” function. If a publication bias was suggested, we further adjusted the P effect size by the trim-and-fill method using the “trimfill” function. Finally, we explored the relationships between the Ln(RR) and the absolute value of latitude and publication year using the “metareg” function. All the above functions were from the “meta” package in R version 3.3.146.
Boosted regression tree analysis
Boosted regression tree (BRT) analyses were conducted to quantify the relative importance of climate, ecosystem properties, and fertilization regimes in predicting the Ln(RR) in the natural terrestrial ecosystems and in the croplands. Before BRT analyses, variable selections were made to avoid high correlations among predictors. Specifically, (1) Soil organic C concentration was included as an indicator of soil organic matter content, while soil total N concentration was not included in the BRT models due to its high correlation with soil organic C concentration (Natural terrestrial ecosystems: r = 0.85, P < 0.001, N = 92; Croplands: r = 0.95, P < 0.001, N = 54). (2) Soil available P concentration was included as an indicator of soil P availability, while soil total P concentration was not included. Ecosystem properties such as soil particle size and parent material type were not included in our BRT analyses due to the very large proportions of missing data (Supplementary Table 1), including which can bias the estimate of their relative importance.
Parameter values used for the BRT analyses generally followed the recommendation of a previous study20, i.e. bag fraction as 0.75, the number of cross validation as 10, and tree complexity as 2. Learning rate was set at a small value (i.e., 0.005) to include a large number (>1000) of regression trees in the models. Because Ln(RR) is a continuous numerical variable, a Gaussian distribution of errors was used. The relative importance of each predictor represented a percentage of the total variation explained by the models. The BRT analyses were performed with the “gbm” package version 2.1.547 plus the custom code of another study20 in R version 3.3.1. For evaluation of the spatial structure of the BRT residuals, the global Moran’s I statistic was applied to determine the significance using the “spdep” package version 0.7.748.
Reporting summary
Further information on research design is available in the Nature Research Reporting Summary linked to this article.
Source: Ecology - nature.com
