Study region
We compiled newly analysed (unpublished) and previously published data from the Atlantic Ocean collected over a time span from 2005 to 2016. We present here new data (total of 306 data points for heme b) from the research cruises M121 (2015) and M124 (2016) in the South Atlantic. We further obtained published data (total of 668 data points for heme b) for the research cruises CD17316, D34615, D36150 and GEOVIDE36. Details on the expeditions are listed in Table 1 in chronological order and a map of the sampling areas and stations is shown in Fig. 1. These research expeditions and thus datasets cover several biogeochemical provinces of the Atlantic Ocean. For statistical analysis, data interpretation and discussion, we grouped the sampled stations into sub-regions according to the geographical location and the chlorophyll a (chl a) distribution. Here we list these regions in geographical order (north to south); Labrador Sea, Irminger Basin, Iceland Basin, Celtic Sea, Subtropical North Atlantic Gyre, Tropical North Atlantic, Coastal Tropical North Atlantic, Tropical South Atlantic, Angola Current, Subtropical South Atlantic Gyre and Benguela Current.
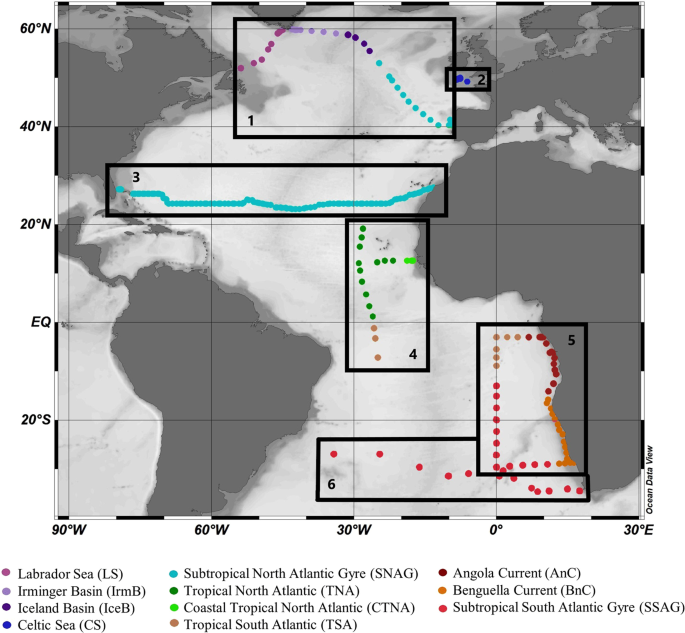
Sampling map of research cruises from 2005 to 2015 included in this study, listed here geographically from north to south. Boxes mark the broader region and track of each research cruise; (1) GEOVIDE cruise (GEOTRACES – GA01 section) in May-April 2014, (2) CD173 in July-August 2005, (3) D346 in January-February 2010, (4) D361 (GEOTRACES – GA06 section) in February-March 2011, (5) M121 (GEOTRACES – GA08 section) in December 2015, and (6) M124 in February-March 2016. Dots indicate the sampled stations. Colours indicate the grouping of data in oceanographic regions listed here geographically from North to South; Labrador Sea (LS), Irminger Basin (IrmB), Iceland Basin (IceB), Celtic Sea (CS), Subtropical North Atlantic Gyre (SNAG), Tropical North Atlantic (TNA), Coastal Tropical North Atlantic (CTNA), Tropical South Atlantic (TSA), Angola Current (AnC), Benguela Current (BnC) and Subtropical South Atlantic Gyre (SSAG). The figure was produced using Ocean Data View99 v.4.7.9 (Schlitzer, R. Ocean Data View. 2018, https://odv.awi.de/).
Particulate organic carbon and chlorophyll a
Particulate Organic Carbon (POC) concentrations ranged from 0.14 to 63.5 μmol L−1 (median = 3.1 μmol L−1, n = 1137) for all oceanographic regions from the surface down to 220 m depth. The highest concentrations of POC were determined in the high latitude North Atlantic Ocean (Labrador Sea, Irminger Basin, Iceland Basin; median = 5.6 μmol L−1, n = 203) and the coastal areas (Celtic Sea, Coastal Tropical North Atlantic, Angola Current, Benguela Current; median = 8.0 μmol L−1, n = 195). Concentrations of POC were lowest in both subtropical gyres (North Atlantic Gyre, South Atlantic Gyre) and open ocean stations of the Tropical North and South Atlantic with a median value of 2.4 μmol L−1 (n = 752).
Chlorophyll a concentrations ranged from <0.01 to 10.7 nmol L−1 (median = 2.0 nmol L−1, n = 1272) overall (0–220 m depth). Similar to POC, chl a was highest in the subpolar North Atlantic (Labrador Sea, Irminger Basin, Iceland Basin; median = 0.50 nmol L−1, n = 186) and the coastal areas (Celtic Sea, Coastal Tropical North Atlantic, Angola Current, Benguela Current; median = 0.38 nmol L−1, n = 311). Lower concentrations of chl a were determined in tropical areas (Tropical North Atlantic, Tropical South Atlantic; median = 0.21 nmol L−1, n = 128) and in the subtropical gyres (North Atlantic Gyre, South Atlantic Gyre; median = 0.13 nmol L−1, n = 66). The lowest chl a values were observed in the Subtropical South Atlantic Gyre, where we determined a median concentration of 0.03 nmol L−1. Our results are comparable to those reported during the Atlantic Meridional Transect (AMT) cruises in this region51,52,53.
Depth profiles (Supplementary Fig. S1) of POC and chl a indicated generally higher concentration within the surface mixed layer (SML) that decreased with depth (Wilcoxon Rank Sum test, p < 0.01). However, clear Deep Chlorophyll Maxima (DCM) were also present in most of the oceanographic regions (i.e. Labrador Sea, Celtic Sea, (sub-)tropical North Atlantic, Angola Current, Benguela Current and (sub-)tropical South Atlantic) (Supplementary Fig. S1). A summary of the median concentrations and the ranges of POC and chl a in the SML is reported on Table 2. Plots A and B in Fig. 2 illustrate the median concentrations of POC and chl a respectively for each sampling station across the Atlantic Ocean. Chlorophyll a correlated with POC (Spearman’s rho, r = 0.57, n = 556, p < 0.01) in the SML (Supplementary Fig. S2A). The Kruskal-Wallis test confirmed statistically significant differences among the oceanographic regions (H = 334, p < 0.01) (Fig. 3A,B).
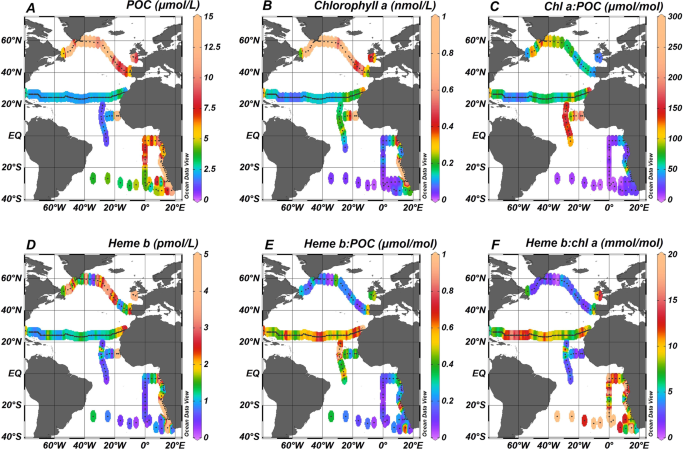
Spatial distribution of (A) Particulate organic carbon (POC), (B) chlorophyll a (chl a), (C) heme b, (D) heme b:POC, (E) heme b:chl a, and (F) chl a:POC. Values represent median the values calculated for the Surface Mixed Layer (SML). Dots indicate the sampled stations. The figure was produced using Ocean Data View99 v.4.7.9 (Schlitzer, R. Ocean Data View. 2018, https://odv.awi.de/).
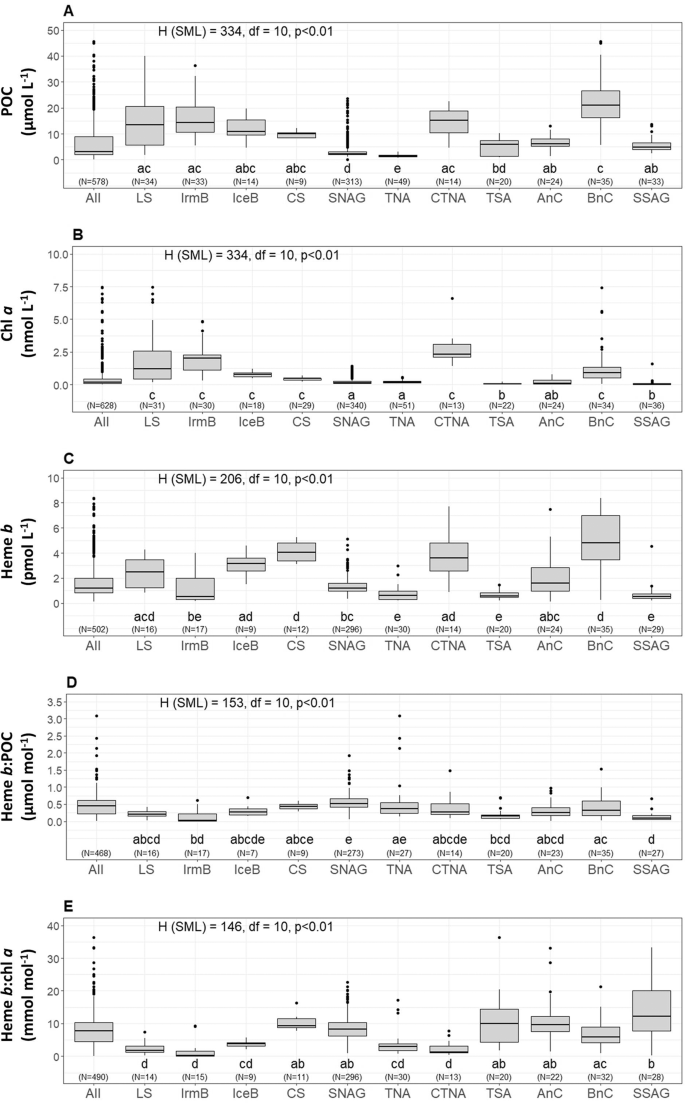
Boxplots of distributions in the surface mixed layer (SML) of (A) Particulate Organic Carbon (POC), (B) chlorophyll a (chl a), (C) heme b, (D) the ratio heme b:POC, and (E) the ratio heme b:chl a for the eleven oceanographic regions; Labrador Sea (LS), Labrador Sea (LS), Irminger Basin (IrmB), Iceland Basin (IceB), Celtic Sea (CS), Subtropical North Atlantic Gyre (SNAG), Tropical North Atlantic (TNA), Coastal Tropical North Atlantic (CTNA), Tropical South Atlantic (TSA), Angola Current (AnC), Benguella Current (BnC) and Subtropical South Atlantic Gyre (SSAG). The boxes show the interquartile range (IQR) of values. The bold lines inside the boxes indicate the median value for each region and divide the boxes the 25th (bottom) and 75th (upper) percentiles. The upper whisker represents the largest value no farther than 1.5 times the IQR, and the bottom whisker indicates the smallest value no farther than 1.5 times the IQR. Dots represent the outliers of the distributions. On top of sub-plots A, B, C, D and E the result of the Kruskal-Wallis test is annotated. Letters (letters a to d) below the boxes indicate the Compact Letter Display (cld) of the statistically significant different groups in the SML after a Post-hoc test for multiple comparisons of groups. The numbers in brackets indicate the number of data points used per box for each parameter. The figure was produced using R Statistical Software97 v.1.0.136 (R core team, 2016, https://www.R-project.org).
The ratio of chl a:POC ranged from 0.21 to 8286 μmol mol−1 (SMLmedian = 67.3 μmol mol−1, n = 550: DCMmedian = 40.6 μmol mol−1, n = 520) for the whole dataset (Fig. 2C). The highest values in the SML were determined in the Coastal Tropical North Atlantic (median = 189 μmol mol−1, n = 13) and the Tropical North Atlantic (median = 155 μmol mol−1, n = 48) whilst chl a:POC was lowest in the subtropical South Atlantic Gyre (median = 7.62 μmol mol−1, n = 32). Statistically significant differences were determined between the SML and the DCM (Wilcoxon Rank Sum test, p < 0.01) and between oceanographic regions (SML: H = 253.27, df = 10, p < 0.01) which were mainly attributed to the differences between the North (sub-) tropical Atlantic (i.e. Subtropical North Atlantic Gyre, Tropical North Atlantic and Coastal Tropical North Atlantic) and the South Atlantic (Subtropical South Atlantic Gyre). Large differences between chl a:POC ratios in the North And South Atlantic have also been observed previously and are thought to be strongly influenced by phytoplankton physiology53.
Heme b concentrations and ratios
Heme b concentrations ranged from 0.10 to 33.7 pmol L−1 (median = 1.16 pmol L−1, n = 974) from the surface layer down to 200 m depth. The depth profiles of heme b (Supplementary Fig. S1) indicated that heme b was typically higher in the SML (SML: median = 1.23 pmol L−1, n = 502) and decreased with depth (Wilcoxon rank sum test, p < 0.01) except for the cases where a DCM was present (Labrador Sea, Celtic Sea and Benguela Current).
The median concentration of heme b in the SML is shown in Fig. 2D. Statistically significant differences were observed in the spatial distribution of heme b in the SML for the various oceanographic regions (Kruskal-Wallis, H = 206, p < 0.01) (Fig. 3C). Significantly higher concentrations were observed in the SML of the coastal regions (Celtic Sea, Coastal Tropical North Atlantic, Angola Current, Benguela Current), ranging from 0.10 to 33.7 pmol L−1 (median = 4.1 pmol L−1, n = 85). These regions include two upwelling areas (Coastal Tropical North Atlantic and Benguela Current) and the Congo river plume located in the Angola region; hence, heme b was highest in the Benguela area (median = 6.2 nmol L−1, n = 14) (Fig. 4) followed by the Coastal Tropical North Atlantic (median = 4.2 nmol L−1, n = 14) (Table 2). In addition, heme b was also enhanced in the highly productive subpolar areas (Iceland Basin, Greenland Shelf and Labrador Sea) which were sampled during the spring bloom in 2014 (range 0.16–4.6 pmol L−1, median = 2.2 pmol L−1, n = 48)36. However, the Irminger Basin deviated from this pattern, despite being sampled in the same season, exhibiting the lowest heme b concentrations (median = 0.53 pmol L−1, n = 17)36, along with the Subtropical South Atlantic Gyre (median = 0.51 pmol L−1, n = 29) and the offshore stations in the tropical Atlantic (Tropical South Atlantic and Tropical North Atlantic, median = 0.58 pmol L−1, n = 50).
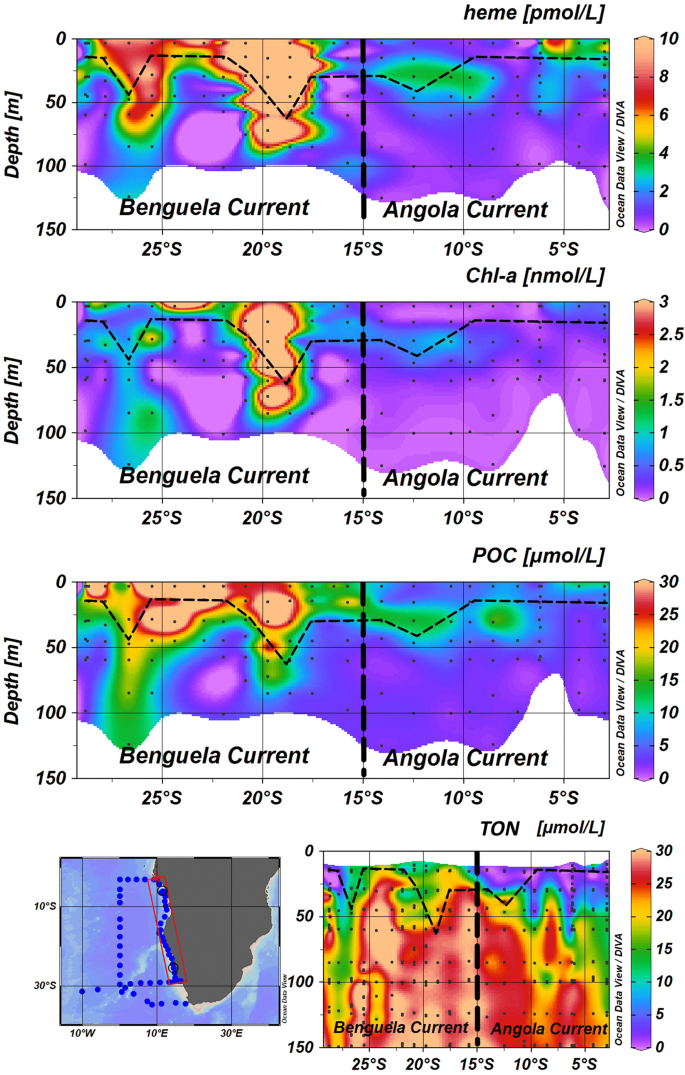
Section plots of heme b, chlorophyll a (chl a), particulate organic carbon (POC) and total oxidized nitrogen (TON – sum of nitrite and nitrate) along the coast of Africa during the M121 cruise (December 2015). The contour plots correspond to the stations closest to the coast (13–17 °E). Dashed lines indicate the Mixed Layer Depth (MLD). Dots indicate the sampled stations and the data points available. Letter annotations indicate the two oceanographic regions encountered which were the Benguela Current and Angola Current regions. The figure was produced using Ocean Data View99 v.4.7.9 (Schlitzer, R. Ocean Data View. 2018, https://odv.awi.de/).
Heme b correlated with both POC (Spearman’s rho, r = 0.41, n = 465, p < 0.01) and chl a (Spearman’s rho, r = 0.56, n = 490, p < 0.01) (Supplementary Fig. S2B,C) in the SML. These results along with the average depth profiles of heme b, chl a and POC (Supplementary Fig. S1) suggest that both the spatial and the vertical distribution of heme b concentrations in the Atlantic Ocean were strongly influenced by biomass, as observed previously15. However, heme b was shown in previous studies to vary due to phytoplankton regulation strategies that occur as adaptation responses to iron-limitation16,36, thus weakening the overall correlation of heme b relative to POC.
In order to examine the changes of heme b relative to biomass as indicated by POC and chl a, we calculated the ratios of heme b:POC and heme b: chl a16,35. The heme b:POC ratio represents the heme b per unit carbon derived from the total particulate organic matter and previous field studies showed that this ratio varied as a result of iron availability15,16,35,36. The ratio heme b: chl a corresponds to organic matter originating from phytoplankton, but because of intracellular chlorophyll variability, can also be influenced by light- and nutrient-driven changes in the photosystem.
In this study, heme b: POC ranged overall from 0.01 to 6.2 μmol mol−1 (median = 0.39 μmol mol−1, n = 907). However, the difference in values between the two layers (above and below the SML) was statistically significant (Wilcoxon Rank Sum test, p < 0.01), with heme b: POC significantly higher in the DCM. The depth profiles (Supplementary Fig. S1) showed that the increase in heme b: POC in the DCMs was accompanied by an increase in the chl a:POC suggesting photoacclimation of phytoplankton to low light and higher investment in the photosynthetic proteins15,54,55. Statistically significant differences were observed for the SML for the various oceanographic regions in heme b:POC (Kruskal-Wallis, H = 153, p < 0.01) (Fig. 3D). The lowest values of heme b:POC were determined in the Irminger Basin (SML: median = 0.03 μmol mol−1, n = 17) and the Subtropical South Atlantic Gyre (SML: median = 0.08 μmol mol−1, n = 27) suggesting a decoupling of heme b from POC in these regions (Fig. 2E). Similarly, we observed statistically significant differences among the oceanographic regions for the heme b:chl a ratio (Kruskal-Wallis, H = 146, p < 0.01) (Fig. 3E). Heme b:chl a ratios ranged overall from 0.07 to 327 mmol mol−1 (median = 7.3 mmol mol−1, n = 942) and followed a different pattern of spatial distribution in the SML compared to heme b:POC (Fig. 2F). Hence, heme b: chl a was lowest in the SML of the Irminger Basin (SML: median = 0.20 mmol mol−1, n = 15) and highest in the Subtropical South Atlantic Gyre (SML: median = 12.7 mmol mol−1, n = 28) suggesting community driven differences in photoacclimation and/or hemoprotein regulation patterns.
Identification of heme b based criteria for iron limited phytoplankton
In laboratory studies, values of heme b:POC below 0.10 μmol mol−1 were indicative of iron-limited phytoplankton15,16, and similar values have been determined for field phytoplankton communities in the iron – limited post-bloom Iceland Basin35 and low-iron Southern Ocean16,35. In case of Irminger Basin, Louropoulou et al.36 showed heme b depletion (median = 0.53 pmol L−1, n = 17) in a large diatom-dominated community in May-June 2014 despite relatively high iron concentrations (≥0.30 nmol L−1), indicating iron limitation resulting from the high iron requirements of the extant phytoplankton population.
In this study, we report a similar pattern of low heme b concentrations (<1 pmol L−1) and low heme b:POC ratios (<0.1 μmol mol−1) in the eastern and in the central Subtropical South Atlantic Gyre, which point to iron-limited phytoplankton communities in these areas. Our observations are confirmed by bioassay experiments that showed the eastern boundary of the Subtropical South Atlantic Gyre was nitrate-iron co-limited during the period of the cruise45. The good agreement between the heme b measurements and the bioassay experiments of Browning, et al.45 reinforces previous comparisons with other approaches for mapping iron-limited phytoplankton communities36 that included the dissolved iron:nitrate ratio56, modified Si* tracer57,58,59 and satellite-derived quantum yield of fluorescence Φsat60,61. Heme b measurements thus appeared to successfully map iron limited phytoplankton by depicting the momentary condition of the phytoplankton cells in situ.
We constructed a histogram of all our SML heme b:POC data in order to investigate overall trends in Atlantic Ocean phytoplankton populations. The distribution of the heme b:POC data (Supplementary Fig. S3A) was skewed to the right with a median value of 0.44 μmol mol−1 (n = 468) and a mean value of 0.47 ± 0.42 μmol mol−1 (n = 468). Furthermore, both the Irminger Basin and the Subtropical South Atlantic Gyre exhibited an exponential distribution and their medians (0.03 μmol mol−1 and 0.09 μmol mol−1 respectively) deviated from the median of the distribution (Supplementary Fig. S3A). Taking into account laboratory studies and field observations of heme b: POC ratios and their relationship to iron limitation, we suggest that 0.10 µmol mol−1 is a reasonable estimate for defining an anemic, iron limited phytoplankton community in the Atlantic Ocean. Hence, the data appearing in the left tail (break 0.10 μmol mol−1, n = 50) (Supplementary Fig. S3A) of the distribution point to iron limited phytoplankton communities. Thus, by this definition, the southern stations of Tropical South Atlantic were iron limited and iron (co-)limitation is predicted to extend to the central parts of the subtropical gyre (Fig. 2, cruise M124, sampling February-March 2016).
In contrast, the western boundaries of the Subtropical South Atlantic Gyre were characterized by slightly higher heme concentrations (1.36 pmol L−1) and heme b:POC ratios (0.37 μmol mol−1) compared to the eastern and central Subtropical South Atlantic Gyre. These results suggest that this area was not iron limited; indeed Rijkenberg, et al.38 reported iron concentrations up to 6.1 nM in the upper 800 m off shore of Brazil in the Subtropical Shelf Front (STSF), which is formed by the southward flowing Brazil Current and the norward flowing Malvinas Current62. The iron enrichment was attributed to aeolian deposition and transport by the STSF, and to offshore export of iron from Brazilian shelf waters and the Rio de la Plata river38,62.
The heme b:POC values of the open ocean stations in the Tropical North Atlantic, (SML; median = 0.26 μmol mol−1) do not point towards iron-limited phytoplankton communities, even though heme b concentrations were low (SML; median = 0.59 pmol L−1); we attribute this trend to low biomass at the time of sampling. In general, the location of the Intertropical Convergence Zone (ITCZ) defines the dust derived iron supply to surface waters49 and thus influences the biogeochemical status and bloom progression between the northern and the southern oligotrophic waters around the Equator63,64. In February-March 2011, when sampling was performed, Schlosser, et al.63 reported that the ITCZ was at ∼1°N and the Tropical North Atlantic was receiving significant amounts of atmospheric deposition whilst the Tropical South Atlantic had low atmospheric dust concentrations. In addition, Snow, et al.64 reported increased nitrogen fixation rates due to the abundance of Trichodesmium sp. between 15°N and 7°S which have high iron requirements relative to non-nitrogen fixing phytoplankton.
Heme b regulation strategies?
Similar to the heme b:POC ratio, the distribution of the population for the heme b:chl a ratio (Supplementary Fig. S3B) was also skewed to the right with median value of 7.77 mmol mol−1 and a mean value 8.98 mmol mol−1 (n = 491). However, we observed a contrasting behaviour in the ratios of the two iron limited areas Irminger Basin (medianSML = 0.20 mmol mol−1, n = 20) and Subtropical South Atlantic Gyre (medianSML = 12.7 mmol mol−1, n = 28), despite the similar trend in heme b:POC. The medians of heme b:chl a for these two areas deviated from the overall median of the distribution and located either on left (Irminger Basin) or the right (Subtropical South Atlantic Gyre) tail. Heme b exhibited the same trend for the two areas which implies that changes in chl a quotas drove the differences in the ratio. Hence, we ascribed this contrast to different extant phytoplankton groups, to different photoacclimation and nutrient status.
The low heme b:chl a observed in Irminger Basin implied that the heme b containing proteins of the photosynthetic apparatus decreased whilst chl a was conserved. In culture, several diatoms and prymnesiophytes exhibited decreased heme b:chl a ratio under low iron conditions (<0.50 nmol L−1)15,16 implying allocation of iron away from the hemoprotein pool16. This behaviour was considered an adaptation strategy of phytoplankton that would allow a reduction of the overall iron requirements and a more efficient utilization of the available iron in order to sustain growth16. Here, this pattern was also observed in the field in the Irminger Basin (GEOVIDE, May-June 2014) for diatom populations that likely employed heme b regulation36 in order to adapt to declining iron concentrations during bloom progression. For example, allocating the iron away from the hemoproteins would lead to decline of the heme b-containing cytochromes b6f and b559 of the PSII apparatus8,18,28, which in turn would be accompanied by increases in the chl a:PSII ratios. Indeed this was observed by Macey, et al.65 in the post-bloom iron-limited Iceland Basin. Particularly for the eukaryotes, another strategy of reducing iron requirements is switching from nitrate to ammonium utilization66,67,68 which induces the reduction of heme b-containing nitrate reductase.
We observed very high heme b:chl a in the Subtropical South Atlantic Gyre which was driven by low concentrations of chl a in the area (SML median = 0.03 nmol L−1). Furthermore, the ratio chl a:POC was 7.68 μmol mol−1 (n = 32) in that region pointing to lower photoacclimation of the dominant phytoplankton groups. At the time of the study, haptophytes and the picophytoplankton species Synechococcus and Prochlorococcus were most dominant in the eastern parts of the gyre45. Similar community composition characterizes the Subtropical North Atlantic Gyre69. Therefore, we made a comparison of the trends in chl a:POC between these two regions; in the Subtropical North Atlantic Gyre, the chl a:POC was higher compared to the Subtropical South Atlantic Gyre reaching a median value of 65.0 μmol mol−1 (n = 312). The contrasting behaviour in chl a:POC can be ascribed to differences in light climate, which is known to strongly influence chl a:POC ratios70. Higher light conditions in the Subtropical South Atlantic Gyre in comparison to the Subtropical North Atlantic Gyre, as a result of both higher incident irradiance during winter months71 and shallower mixed layers (Supplementary Fig. S1), would be expected to result in the lower chlorophyll-to-carbon ratios observed. However, the low chl a concentrations, and thus the low chl a:POC values, could also be a result of general nutrient limitation in the area as shown previously72,73. Hence, our results implied a high variability in chl a due to a combination of photoacclimation, nutrient limitation, phytoplankton physiology and species specific modifications in the photosynthetic apparatus.
Our heme b data from the field appear to be broadly consistent with laboratory studies in terms of magnitude and relationship with POC. Nevertheless, a key challenge in the interpretation of relationships between heme b, chl a and POC is distinguishing between variability resulting from physiological responses to changes in light and nutrient regimes, and variability resulting from changes in the relative contributions of different carbon (C) pools35. The relationship between biomass and POC is also critical to the interpretation of optical parameters measured from space. Studies of interrelationships between chl a, POC and phytoplankton biomass in the Atlantic Ocean have concluded that chl a:POC ratios vary to a greater extent than C biomass:POC70,74, with the greater variability in chl a:POC attributed to changes in phytoplankton photophysiology driven by nutrient and light regimes. Thus in analogy, we have assumed throughout our discussion that variability between heme b, chl a and POC reported here will be more strongly influenced by physiological changes than by changes in POC composition. Further support for this assumption, or alternative methods of assessing phytoplankton biomass would be useful in future applications of heme b as an indicator of iron status in the field.
Comparison of field heme b concentrations with model-based predictions
Both theoretical estimates and direct measurements suggest heme b represents an important amount of the total cellular iron pool in phytoplankton (mean 18 ± 14%)14,15,75 thus the second part of our study aimed to examine to what extent the heme b field data were comparable to heme b estimated from the biogenic iron pool as predicted from a global biogeochemical model. Here we used the PISCES-v2 (Pelagic Interactions Scheme for Carbon and Ecosystem Studies volume 2) biogeochemical model to estimate the biogenic iron pool which is determined based on Michaelis Menten uptake kinetics, further regulated by a maximum iron-to-carbon (Fe:C) cellular quota and enhanced iron uptake under iron limitation76,77,78. Figure 5A illustrates the biogenic iron (Febio) pool from the model which corresponds to sum of the diatom and nanophytoplankton iron pools extracted at the same geographic position and month as the field data. Values represent the monthly means for the upper most layer of the model (depth 10 m) and ranged from 9.20 to 285 pmol L−1 (median = 78.8 pmol L−1, n = 254). Although a direct comparison of the absolute values is questionable due to the large uncertainties associated with model predictions of the ocean iron cycle79, there are similar trends between the Febio and heme b abundance in the Atlantic Ocean. In particular, both parameters were highest in the subpolar North Atlantic (Labrador Sea, Iceland Basin), along the continental margins (Celtic Sea, Angola Current) and in the upwelling areas (Coastal Tropical North Atlantic, Benguela Current), whilst the lowest values were determined in the oligotrophic Subtropical South Atlantic Gyre.
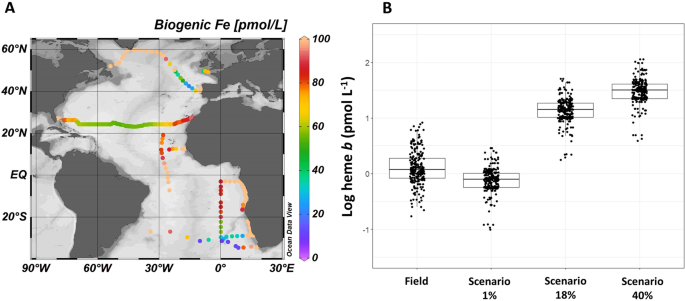
(A) Model-based estimation the biogenic iron (Febio) pool deriving from the sum of the nanophytoplankton and diatom iron pools in pmol L−1. Colours represent the monthly mean values for the upper most layer of the model calculated for the same time as sampling (depth 10 m). (B) Actual field heme b measurements and predicted heme b concentrations calculated from the total Febio concentrations in the surface mixed layer (SML) of each station. Calculations follow three scenarios (1%, 18%, and 40%) representing the heme b proportion relative to the total Febio according to observations in cultured phytoplankton15. Plot A was produced using Ocean Data View99 v.4.7.9 (Schlitzer, R. 2018, https://odv.awi.de/). Plot B was produced using R statistical software97 v.1.0.136 (R core team, 2016, https://www.R-project.org).
According to phytoplankton culture experiments with different phytoplankton species, heme b accounts for between 1 and 40% of the particulate Fe (PFe) (averaging 18 ± 14%)14,15,80. We calculated the predicted heme b concentrations (in pmol L−1) from the modelled Febio of each station in the SML using three scenarios (values) 1%, 18% and 40% that represent the range and mean of heme b:PFe observed in laboratory cultures. We used the formula heme b = [Febio * [heme b ⁄ PFe] lab]/100, where [heme b / PFe]lab denotes the proportion of heme b relative to PFe determined for cultured phytoplankton under various growing conditions.
Predicted heme b concentrations were lowest for the 1% scenario and highest for the 40% scenario (Fig. 5B) with the 1% scenario corresponding more closely to the field observations reported in this study. This trend was further supported by the ratio heme b:Febio calculated from the mean heme b concentrations (in the SML) and the model-based Febio which ranged from 0.17% to 9.1% (median = 1.8%, n = 234). Taken together with heme b:POC, these results suggest that, as far as heme b is concerned, field populations were comparable to laboratory observations for species with low heme b content. Furthermore, the ratio of 1% was determined in cultures where iron (0.50 nmol L−1) or nitrate supply had been exhausted, thus perhaps better representing the natural environment. Therefore, the model prediction of Febio and the in situ heme b concentrations were consistent with previous laboratory observations15,16. The differences in the proportion of heme b relative to Febio likely arose because of the microbial community composition of each region and the interspecific differences in hemoprotein processes.
Biogenic iron and iron-to-carbon (Fe:C) ratios are critical for linking the iron and carbon cycles in the ocean and constraining phytoplankton iron requirements within biogeochemical models81. Currently, the biogenic iron pool can be assessed by radioisotope uptake experiments81,82, single-cell synchrotron x-ray fluorescence81,83,84 and determination of particulate iron after careful removal of or correction for lithogenic iron81,85,86,87. Whilst all these techniques provide complimentary and useful information on particulate iron, single cell iron-to-phosphorus ratios or community wide Fe:C uptake rates, none provide a definitive estimate of average in-situ biogenic iron quotas within phytoplankton populations. Furthermore, none of the above methods were applied consistently on larger scale field expeditions. The good agreement of heme b observational and model-based data suggests that heme b could potentially serve as an indicator of the biogenic iron for field studies and provide an assessment of the proportion of iron used in the heme b and the hemoprotein pools in marine phytoplankton, although further comparison of heme b abundance with established methods of assessing biogenic iron are required.
Source: Ecology - nature.com
