Effect of ML on quality of barley silage during aerobic stage
The pH values of the control (CK), M silage and ML silage were within the range of 3.87–3.94 after 60 days of ensiling (Table 1). When exposed to air, the pH values of the CK and M silages increased rapidly with prolonged exposure but not of the ML silage. Changes in pH values were relatively constant in barley silage prepared with ML from day 0 to 7 of aerobic exposure. Similarly, the concentration of fermentation products, such as LA and AA, decreased gradually with prolonged exposure in the CK and M silage but not in the ML silage. Changes in the concentrations of fermentation products were significant during aerobic exposure of barley silage (p < 0.05). LA and AA contents were higher in the ML silage than the CK and M silages at days 2, 5, and 7 of aerobic exposure (p < 0.05). In addition, as shown in Fig. 1, the ML silage was aerobically stable for more than 216 h, whereas the CK and M groups were stable for only 85 h and 96 h, respectively, indicating that the aerobic stability of barley silage was improved by the addition of ML. The single addition of M minimally improved aerobic stability of silage. Although yeast and AB counts increased gradually with prolonged aerobic exposure, the LAB counts did not significantly decrease in ML silage (Table 2). Compared with the CK silage, the counts of LAB, yeast, and AB in barley silage prepared with M only changed significantly after 5 and 7 d of exposure (p < 0.05). Nevertheless, the yeast and AB counts of the ML group were significantly lower than those of the CK and M groups during aerobic exposure (p < 0.05).
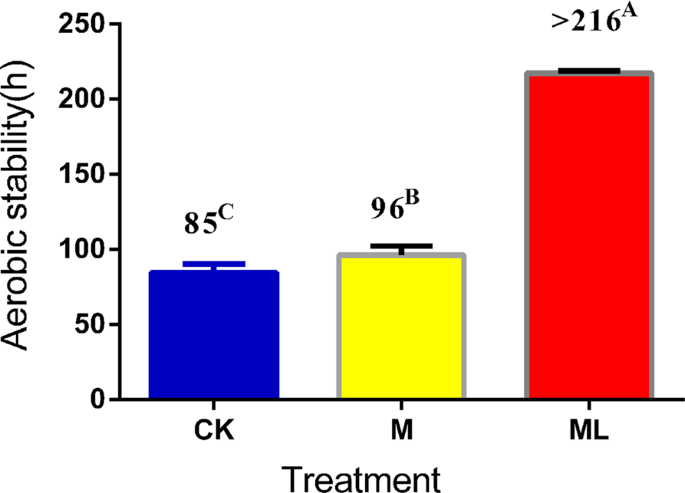
Effect of ML on aerobic stability of barley silage ensiled for 60 days. Data are presented as means of three replicates. Values in the same row (A–C) with different superscripts are significantly different (p < 0.05). Abbreviations: CK, control; M, molasses; ML, molasses and microbial inoculants.
Effect of ML on bacterial and fungal diversity in barley silage during aerobic stage
In this study, the operational taxonomic units and Chao 1 indices, which represented the richness of bacterial communities, had notably decreased in barley silage treated with ML at 2 and 5 d during aerobic stage (Table 3). Furthermore, the Shannon index of bacteria was not affected by M treatment only at 5 and 7 d during aerobic stage in barley silage, as compared with the CK silage. However, the Shannon index was lower in ML silage than that in the CK and M silages at 5 and 7 d during aerobic stage, suggesting that there was less bacterial diversity of barley silage in the ML silage than that in the CK and M silages.
Among the three groups, the operational taxonomic units, Chao 1, and Shannon indices of fungi were the highest in ML silage after 7d of exposure. Nevertheless, these indices decreased in the ML silage during aerobic stage. These findings show that the richness and diversity of fungal microbes had increased in barley silage treated with ML after aerobic exposure.
Effect of ML on bacterial microbiomes in barley silage during aerobic stage
Firmicutes was the most abundant phyla with more than 97% relative abundance in ML silage during aerobic stage (Fig. 2A). However, the abundance of Firmicutes was decreased, whereas that of Proteobacteria was increased, with prolonged exposure in CK and M silages. Among the three groups, CK silage had the highest and the lowest abundances of Proteobacteria and Firmicutes, while the ML silage had the lowest and the highest abundances of Proteobacteria and Firmicutes at 5 and 7 d during the aerobic stage, respectively. In the CK, M, and ML groups, the abundances of Firmicutes at 7d of aerobic exposure were 1.544%, 26.291%, and 97.325%, respectively.
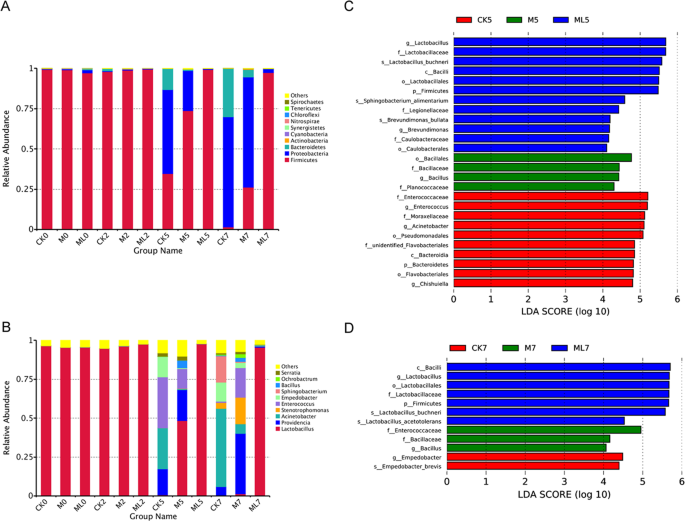
Bacterial community structure at the phylum (A) and genus (B) levels. Indicator bacteria in groups with LDA scores >4 at days 5 (C) and 7 (D) of aerobic exposure. Arabic numerals indicate the day of aerobic exposure. Abbreviations: CK, control; M, molasses; ML, molasses and microbial inoculants.
Changes at the genus level in bacterial community structures among the CK, M and ML silages during aerobic stage was summarized in Fig. 2B. Similar to Firmicutes at the phylum level, Lactobacillus was the dominant bacterial genus with a relative abundance of more than 95% in ML silage after aerobic exposure. Meanwhile, the abundance of Lactobacillus was high in the CK and M silages at 0 and 2d during aerobic stage. In CK silage at 5 d during aerobic stage, the dominant bacterial genera were Enterococcus, Acinetobacter, Providencia, and Empedobacter with relative abundances of 32.864%, 26.401%, 16.509%, and 13.024%, respectively, while that of Lactobacillus was only 0.708%. Furthermore, in M silage at 5 d during aerobic stage, Lactobacillus, Providencia, Enterococcus, Acinetobacter, Empedobacter, and Bacillus were the dominant bacterial genera with the abundances of 48.463%, 19.687%, 12.636%, 7.143%, 6.091%, and 4.755%, respectively. After 7 d of aerobic exposure, Acinetobacter was the prominent genus at 50.226% relative abundance in CK silage, which was accompanied by the emergence of Sphingobacterium with an abundance of up to 17.041% and a decrease in Providencia abundance to 5.717%. Meanwhile, in M silage, Lactobacillus abundance decreased from 48.463% at day 5 of exposure to 0.187% at day 7 of exposure. The abundances of Providencia and Stenotrophomonas in M silage increased to 38.866% and 17.031% at 7 d during aerobic stage, respectively, suggesting that they were the dominant genera.
Differences in bacterial community structures among the groups were identified by linear discriminant analysis (LDA) of effect size (LEfSe), which was used to calculate the relative abundances of bacterial genera in barley silage at 5 and 7 d during aerobic stage (Fig. 2C,D). LEfSe was used to identify the taxa that most likely explain the differences in bacterial community structures among the CK, M, and ML groups. The results revealed significant differences in LDA scores among the three groups. Enrichment of L. buchneri was significant in ML silage at 5 and 7 d during aerobic stage, suggesting that L. buchneri is a potential indicator of aerobic stability. Moreover, enrichment of Bacillus was significant in M silage at 5 and 7 d during aerobic stage. For Empedobacter, enrichment was significant in CK silage at 7 d during aerobic exposure, whereas for Enterococcaceae and Acinetobacter, enrichment was significant in CK silage at 5 d during aerobic exposure.
The results of correlation analysis of bacterial communities, silage fermentation, and microbial counts of barley silage during aerobic stage are shown in Fig. 3A. When exposed to air for 7 days, Lactobacillus, Weissella, and Pediococcus were positively correlated with LA, AA, and PA concentrations, and LAB counts but negatively correlated with pH values and AB. Acinetobacter was positively correlated with pH values, as well as yeast and AB counts, but negatively correlated with LA concentrations and LAB counts. Stenotrophomonas and Empedobacter were positively correlated with pH values, as well as yeast and AB counts, but negatively correlated with LA and PA concentrations, and LAB counts.
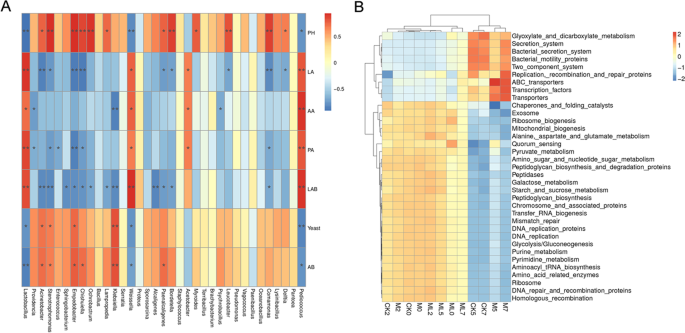
Spearman correlation heatmap of the top 35 genera of bacteria and fermentation properties (A). Heatmap of microbial function pathways (B). Arabic numerals indicate the day of aerobic exposure. Abbreviations: CK, control; M, molasses; ML, molasses and microbial inoculants.
Figure 3B shows a heatmap of microbial function pathways. A hierarchical cluster heatmap was generated to visualize the distribution of microbial communities in the CK, M, and ML groups. The heatmap results suggest that alanine aspartate and glutamate metabolism, pyruvate metabolism, amino sugar and nucleotide sugar metabolism, starch and sucrose metabolism, glycolysis, purine metabolism, pyrimidine metabolism, and aminoacyl tRNA biosynthesis, which are involved in amino acid metabolism, carbohydrate metabolism, nucleotide metabolism, and translation, respectively, were more abundant in the ML group than in the CK group. As compared with the ML group, the microbiota in the CK group had higher functional performance related to bacterial secretion systems, bacterial motility proteins, two-component systems, and adenosine triphosphate binding cassette transporters, which are involved in environmental information processing.
Effect of ML on fungal microbiomes in barley silage after aerobic stage
Fungal community composition at the phylum level in ML silage after aerobic stage was significantly different with CK silage (Fig. 4A). The members of Ascomycota phylum were more abundant in M and CK silages with an abundance of more than 97% during the aerobic stage. Basidiomycota in the ML silage was the preponderant fungi at the early stage of exposure, with abundances of 62.562% and 78.714% at 0 and 2 d, respectively, during the aerobic stage. Ascomycota was the most abundant group in the ML silage at 5 d of aerobic exposure. Figure 4B shows the differences in fungal community structures at the genus level among barley silages after the aerobic stage. The predominant fungal genera in the CK silage at 2 d during the aerobic stage were Issatchenkia, Kazachstania, and Candida with abundances of 80.580%, 12.055%, and 4.449% respectively. Meanwhile, Issatchenkia, Monascus, and Kazachstania were the major fungi in M treated silage at 2 d during aerobic stage with the abundances of 55.310%, 35.024%, and 5.487%, respectively. Compared with CK silage, the addition of M decreased the abundance of Issatchenkia and increased the abundance of Monascus and Candida at 0 and 2 d during aerobic stage. Furthermore, the abundances of Issatchenkia, Candida, and Kazachstania decreased in the ML silage after aerobic exposure, as compared with those of the CK and M silages. However, other genera (less than 1% sequenced) were the predominant fungi in ML silage at 2 d during aerobic stage at 82.5% abundance, followed by Issatchenkia (8.95%). This result was in accordance with fungal diversity of barley silage, which showed that ML silage had the greatest fungal diversity at 2 d during aerobic stage among the three groups, as shown in Table 3. Differences in fungal community structures among the groups was investigated using LEfSe analysis, which was used to calculate the relative abundance of fungi in barley silage at 0 and 2 d during aerobic stage. As shown in Fig. 4C,D, there were significant differences in fungal community structures between the ML and CK silages, which confirmed that significant enrichment of Sporidiobolus was a indicator of aerobic stability in the ML silage at 0 d during aerobic stage, although the abundance of Kazachstania in CK silage was significantly enriched at 2 d during aerobic stage. The relationship between the fungal community structure and fermentation quality (Fig. 5) was determined by canonical correlation analysis. Issatchenkia was positively correlated with pH values and yeast counts, but negatively correlated with LA concentrations and LAB counts. Meanwhile, Sporidiobolus was negatively correlated with pH values. The addition of M combined with microbial inoculants might have decreased the abundance of Issatchenkia, increased the abundance of others fungi (less than 1% sequence), decreased the pH value and content of yeast, and increased the contents LA and LAB of barley silage after aerobic exposure.
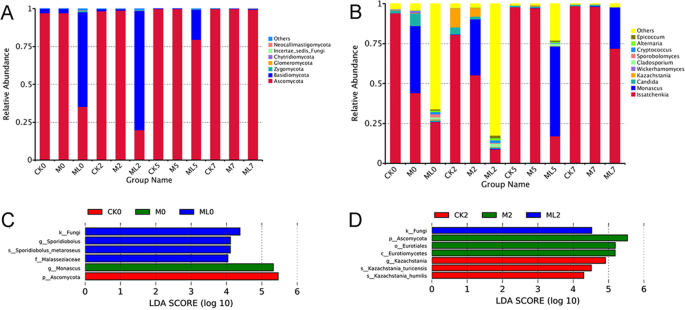
Fungal community structure at the phylum (A) and genus (B) levels. Indicator fungi in groups with LDA scores >4 at days 0 (C) and 2 (D) of aerobic exposure. Arabic numerals indicate the day of aerobic exposure. Abbreviations: CK, control; M, molasses; ML, molasses and microbial inoculants.
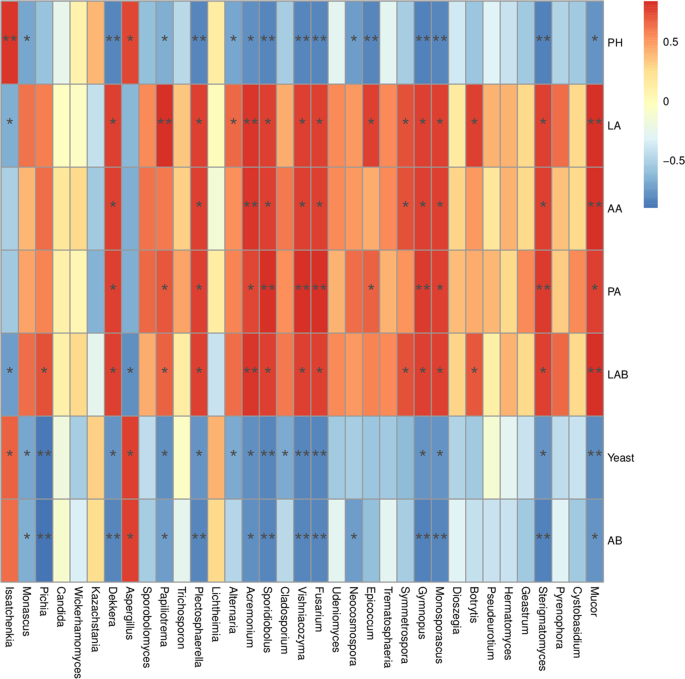
Spearman correlation heatmap of the top 35 genera of fungi and fermentation properties.
Source: Ecology - nature.com
