Aggregate trends
To motivate the likely magnitude of impacts of the monument expansions, we examine how much longline fishing activity was displaced from the expansion area. We focus on the fleet that primarily targets bigeye tuna because these trips account for over 95% of the revenue generated from longline fishing in Hawaii, the main industry predicted to be harmed. We base our analysis on data from the NOAA Observer Program, which collects information on fishing trips, including the location and time of every fishing event (or set) and the number of fish caught for both target and non-target species. The Hawaii-based longline fishery has been monitored under a mandatory federal observer program since February 1994. Trips targeting tunas have approximately 20% random observer coverage, whereas trips targeting swordfish have 100% coverage. We restrict the sample to 2010–2017 in order to exclude the possible impacts of the Great Recession, but all of the results that follow hold if we use the entire observer dataset. Using location information, we classify each fishing set into one of three categories: inside PRI, inside PMNM, or outside both monuments. Data are aggregated to maintain data confidentiality, per NOAA requirements. Figure 1b shows the annual spatial allocation of fishing sets for these trips. At least 90% of fishing sets have historically taken place outside monument waters; the annual percentage of sets inside the monuments ranged from 4 to 9% in the pre-expansion years. The results are similar when looking at catch within the monument waters, which constitutes no more than 10% of fleet-wide annual catch during the study period. We also see no evidence of a blue paradox, defined as a ramp up in fishing effort inside a proposed protected area prior to prohibitions going in to effect18,19,20. This would suggest that waters outside of the monuments are at least as productive as those inside. Taken as a whole, Fig. 1 suggests that a very small fraction of total fishing effort has been displaced by the monument expansions.
Aggregate data point to a strengthening of the industry following the monument expansions. Based on logbook summary reports, which capture 100% of activity in the longline fleet, revenue, catch, and catch-per-unit-effort (CPUE) have all increased since the expansions (see Figs. 2 and 3; Supplementary Fig. 1). The increases in catch are generally statistically significant, especially following the PRI expansion (Supplementary Table 2). Although the fishery has been regulated with a total allowable catch (TAC) limit on bigeye tuna since 2009, the fleet has been allowed to exceed this by transferring unused TAC allocation from other U.S. territories. These allocations have allowed total catch to increase, despite industry-wide catch limits21,22. Aggregate increases in total catch and total revenue may be masking negative impacts from the monuments, such as forcing vessels to fish in less productive areas, to travel further, or to compete with more vessels in less space, all of which would increase the cost of fishing. Although we do not have data on profits in the industry because we do not have access to either individual or aggregated cost data, we can examine changes in CPUE. CPUE, measured as the ratio of catch to effort, is a proxy for fishery profitability because it relates the costs of fishing to the benefits of fishing. As an example, if the new protected areas cause a vessel to expend twice as much effort to catch the same amount of fish as before, then CPUE would decline by 50%. On the contrary, we observe increases in three aggregate measures of CPUE following each expansion (Fig. 3), using total catch per total hooks, total catch per total fishing sets, and total catch per total fishing trips as the relevant metrics. These increases in CPUE suggest that either less effort yields higher catch or that the same effort now yields more catch.
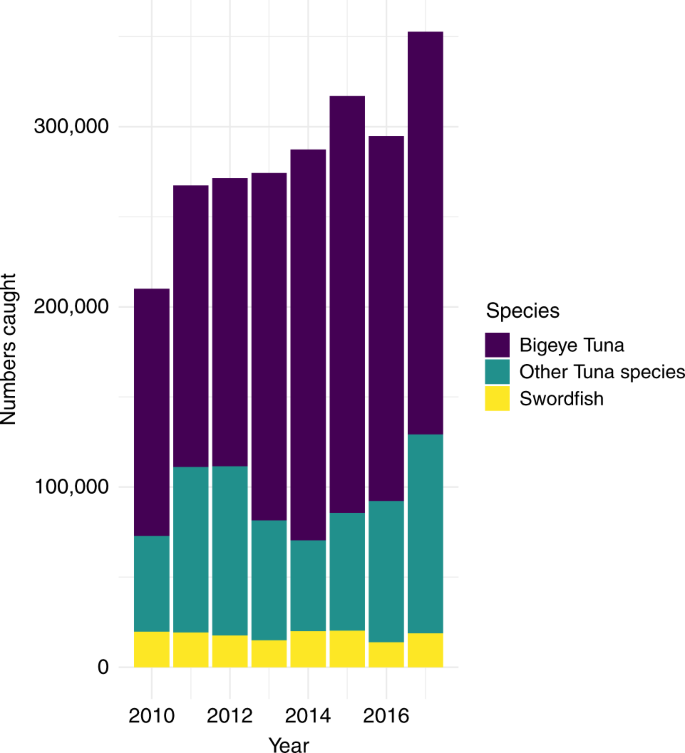
Source: Annual hawaii limited access longline logbook summary reports from 2010 to 2017. Data is from All Sets (Tuna and Swordfish) and All Areas (inside monuments, inside and outside U.S. EEZ, etc.). The total catch is color-coded by species: Bigeye Tuna in dark purple, Other Tuna Species in dark teal, and Swordfish in yellow. Source data are provided as a Source Data file.
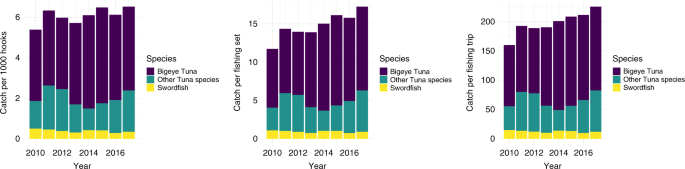
Source: Annual hawaii limited access longline logbook summary reports from 2010 to 2017. Data are from All Sets (Tuna and Swordfish) and All Areas (inside monuments, inside and outside U.S. EEZ, etc.). The total catch is color-coded by species: Bigeye Tuna in dark purple, Other Tuna Species in dark teal, and Swordfish in yellow. Source data are provided as a Source Data file.
Using individual vessel data from the observer program and focusing only on the Hawaii-based tuna fleet, we find that both expansions are correlated with an increase in CPUE for target species, measured with the aforementioned effort metrics as well as catch-per-kilometer-traveled (Fig. 4). We also use a series of regressions with additional controls to document whether these increases are, in fact, statistically significant and not explained by other factors such as changes in environmental conditions. In particular, we account for the fact that oceanographic conditions may have increased catch rates since the expansions began by including contemporaneous and lagged El Niño indexes as control variables. The specific El Niño index we use is the monthly Niño 3.4 index provided by the National Center for Atmospheric Research23. Tuna movement and distribution is known to be influenced by El Niño-Southern Oscillation (ENSO) events as fish track the most suitable water temperature24,25. The results for catch-per-1000-hooks are shown in Table 1 and for the remaining outcomes in Supplementary Tables 3–5. We find that the statistically significant increases in CPUE sometimes become non-significant or even negative as additional controls are added to the regression model, highlighting the importance of controlling for confounding factors that may have occurred at the same time as the expansions.
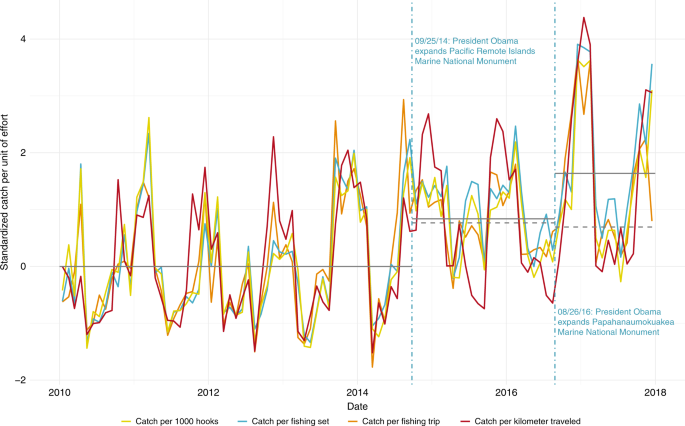
The four catch-per-unit-effort (CPUE) measures are catch-per-1000-hooks (solid yellow line), catch-per-fishing set (solid blue line), catch-per-fishing-trip (solid orange line), and catch-per-kilometer-traveled (solid dark red line). Vertical dashed blue lines indicate the dates of the two expansions. Each time series has been standardized by subtracting its mean value prior to the PRI expansion and dividing by its standard deviation prior to the PRI expansion. The horizontal solid gray lines indicate the mean of all four catch-per-unit-effort measures (i) prior to the expansion, (ii) following the PRI but prior to the PMNM expansion, and (iii) following the PMNM expansion. The horizontal dashed gray lines represent the same calculation (the mean of all four standardized catch-per-unit-effort measures) for two control fisheries: the segment following PRI expansion but prior to PMNM expansion is calculated using Hawaii swordfish fleet data and the post-PMNM segment is calculated using American Samoa tuna fleet data. Both segments are standardized relative to their means and standard deviations prior to the PRI expansion. All lines are drawn for the purposes of motivation and data visualization only. For appropriate tests of statistically significant differences, please refer to the regression tables.
Causal inference
We now turn to our most detailed analysis of the possible economic impacts of the expansions on the fishing fleet. A criticism of the literature on marine reserve impacts is that the absence of an appropriate control makes it challenging to disentangle reserve impacts from unobserved factors that are changing at the same time26. There are two key assumptions that, if satisfied, will allow us to make causal claims about the effects of the expansions: the excludability and no interference assumptions27. The excludability assumption states that any confounding factors or rival explanations have been excluded or controlled for27. For example, one well-known MPA study observed a 90% increase in CPUE after MPA implementation, but this was partially due to favorable changes in environmental conditions and a statistically non-significant decline in fishing effort28,29. The no interference assumption states that when using a control-impact approach, there can be no interference or spillover from the impacted fishery to the control fishery. This requires that the treated group of vessels does not change the behavior of the control group of vessels following reserve implementation. A classic example of a violation of the no interference assumption would be if vessels impacted by the reserve displace the control vessels and force them to fish in less productive waters, causing their CPUE to decline. This could make the negative impacts of the reserve appear smaller than they actually are. Even the announcement of a future protected area may lead to changes in behavior that complicate evaluation of the protected area once it is established18. Similar issues arise in the evaluation of terrestrial protected areas and other fisheries regulations30,31,32. A meta-analysis27 of nearly 200 studies attempting to make causal claims about the impacts of marine reserves shows that only a few addressed the issues of excludability and no interference, and only one study33 addressed both.
In order to make credible statements about the causal impacts of the expansions, we need to find a control for CPUE in the Hawaii tuna fishery. In other words, what would the trend in CPUE have been if the monuments had not been expanded? The control must be influenced by the same unobserved factors that might be correlated with the monument expansions, such as changes in oceanographic conditions or management rules, but remain unaffected by the expansions themselves (allowing us to control for these unobserved factors and satisfy the excludability assumption). We capitalize on incidental catch of bigeye and yellowfin tuna (Thunnus albacares) in two closely related fisheries to construct our controls—the Hawaii longline swordfish (Xiphias gladius) fleet for the PRI expansion and the American Samoa longline albacore tuna (Thunnus alalunga) fleet for the PMNM expansion (the dashed gray lines in Fig. 4 show the mean of the four CPUE measures for these control fisheries).
The Hawaii swordfish fleet is a good control for the PRI expansion for two reasons. First, the swordfish fleet incidentally catches bigeye and yellowfin tuna when targeting swordfish. The current scientific consensus is that bigeye tuna is one large population spread across the Pacific Ocean34,35,36,37,38,39 and yellowfin tuna is three or more large populations35,40. Thus, any environmental variation that influences abundance of these tuna species in the Pacific should be reflected in bycatch rates for the swordfish fleet, allowing us to exclude environmental variation as a source of bias. The fact that the swordfish and tuna fleets both fish in the same general region strengthens this argument (Fig. 1a). Supplementary Fig. 4 shows the high degree of correlation in catch rates across the two fisheries. Furthermore, the swordfish fleet is U.S. flagged, subject to many of the same regulations as the Hawaii tuna fleet, and sells their catch at the same auction. This allows us to control for unobserved changes in regulatory, institutional, and market conditions as potential sources of bias in our regression estimates. Second, since 1994 a swordfish set has never been recorded inside PRI by NOAA observers (and the swordfish fleet has 100% observer coverage). Thus, the Hawaii swordfish fleet should not be directly affected by the PRI expansion. CPUE of bigeye and yellowfin tuna in the swordfish fleet should be influenced by environmental, economic, and social factors that also affect the Hawaii tuna fleet but we expect no direct impact from the PRI expansion, allowing us to satisfy the excludability assumption.
When we analyze the PMNM expansion, we use incidental catch of bigeye and yellowfin tuna in the American Samoa albacore fishery as our control measure of CPUE. The American Samoa fishery is also U.S.-flagged and subject to similar regulations as the Hawaii tuna fleet. Again, this fleet is primarily targeting a different species so their incidental catch of bigeye and yellowfin tuna serves as an ad hoc sampling of their abundance in the Pacific. An American Samoa longline permit grants the right to fish around American Samoa, Guam, the Northern Mariana Islands, and the PRI areas, but it has never included the legal right to fish in PMNM (Fig. 1a shows the spatial extent of this fleet). Thus, the American Samoa tuna fleet should be exposed to similar changes in oceanographic conditions as the Hawaii tuna fishery but be unaffected by the expansion of PMNM because the PMNM expansion merely closed waters that have always been closed to the American Samoa fleet (helping us to satisfy the excludability assumption). In Supplementary Fig. 5, we show that the catch rates of bigeye and yellowfin tuna are strongly positively correlated across the Hawaii tuna and American Samoa albacore tuna fisheries, confirming our claim that the American Samoa fleet is a plausible control. It can also be seen in Fig. 2 and in the Supplementary Information file that the timing of both expansions appears to coincide with a general increase in bigeye and yellowfin tuna CPUE; this has been linked to favorable recruitment conditions in 2012. In summary, the excludability assumption is most likely to hold for the Hawaii tuna vs. Hawaii swordfish analysis since these two fleets fish in roughly the same part of the Pacific Ocean. It is least likely to hold for the Hawaii tuna vs. American Samoa albacore tuna analysis because these fleets fish so far apart and environmental conditions are less correlated with increasing distance41.
Both controls also likely satisfy the no interference assumption. The most obvious mechanism through which interference could take place is if the expansions moved treated vessels (Hawaii tuna trips) into the fishing areas of untreated vessels (Hawaii swordfish and American Samoa albacore tuna trips), thereby influencing their productivity through congestion, information sharing, or localized depletion. We test for whether there is any evidence that interference is taking place using a series of simple tests. We calculate the average distance between the treated and untreated fleets by month and then test whether this decreases following either expansion. We do not find any evidence of decreases in average distance and, in some cases, observe statistically significant increases in distance apart following the expansions (Supplementary Table 7). For PRI, the average distance between the treated and untreated fleets prior to either expansion exceeds 1700 km and for PMNM it is larger than 4000 km (which is roughly the distance between Hawaii and American Samoa). These robustness checks give us confidence that the no interference assumption holds, and that each of the surrogate fisheries are valid controls. In contrast to the excludability assumption, the no interference assumption is most likely to hold for the Hawaii tuna vs. American Samoa albacore tuna analysis since these fleets operate out of separate ports and rarely, if ever, directly interact with each other. The no interference assumption is least likely to hold for the Hawaii tuna vs. Hawaii swordfish analysis because these fleets fish out of the same home port, are free to switch from targeting tuna to targeting swordfish, and their fishing grounds overlap more.
We combine the Hawaii tuna and Hawaii swordfish observer data to evaluate the PRI expansion and then combine the Hawaii tuna and American Samoa albacore tuna observer data to evaluate the PMNM expansion. Thus, we use two separate datasets to evaluate each expansion separately. We perform two sets of difference-in-differences regressions, akin to a before-after-control-impact (i.e., BACI) design in experimental ecology42. The main regression equation we estimate is explained in the Methods section. The key co-variate of interest is an indicator variable for the expansion interacted with an indicator variable for the Hawaii tuna fleet. This term shows the impact of the expansion, controlling for any changes in CPUE that would have occurred if the expansion had never taken place (the counterfactual trend).
Even after controlling for the counterfactual trend in bigeye and yellowfin CPUE, we observe an increase in CPUE following either expansion (Table 2). In all but one regression model, this increase is statistically significant. In Supplementary Tables 8–10, we replicate these results for the three other measures of CPUE and observe statistically significant increases in 12 models and statistically non-significant changes in 5 models. The only significant decrease we observe is in one model with catch-per-fishing-trip as the outcome variable. Further investigation reveals that this decrease is due to the length of fishing trips growing more slowly in the Hawaii tuna fleet, relative to the control, following the expansion (Supplementary Table 11).
Distance robustness check
One potential drawback of our measure of trip distance using observer data is that we approximate the total distance traveled (Supplementary Figs. 2 and 3; Supplementary Tables 6 and 12). In particular, the actual distance traveled may be higher following the expansions if vessels are forced to do more searching between fishing sets, but this distance traveled would be missing from our imputed measure since it takes place between sets (see Methods section). In order to test whether our results are robust to using more accurate distance information, we make use of detailed fishing vessel locations provided by GFW. GFW uses Automatic Identification System (AIS) messages to track the location and activity of large fishing vessels, in some cases as often as every fifteen seconds. We perform regression-based analysis of daily distance traveled using the GFW data and fail to reject the null hypothesis that distance traveled is unchanged following the PMNM expansion (Supplementary Fig. 7; Supplementary Table 13). We also show that the bias in our approximation of travel distance does not increase following the expansion (Supplementary Table 14). In summary, the GFW data suggests that the Hawaii tuna and swordfish fleets are not being forced to travel further following the PMNM expansion.
Source: Ecology - nature.com
