Sampling area and investigated parameters
In March 2018, water, ice, and snow were sampled from Lake Baikal’s southeastern and southwestern coasts in the river mouths and from the lake waters near the rivers. Samples were also taken from two reference stations in the lake’s pelagic zone (51.53875 N, 104.19746 E and 51.86710 N, 104.83247 E) (Fig. 1). The lower reaches of the Solzan (51.49722 N, 104.15836 E), Bolshaya Osinovka (51.50056 N, 104.24403 E) and Malaya Osinovka (51.50056 N, 104.25354 E) rivers pass through the town of Baikalsk and its industrial area. The Pereemnaya River (51.56891 N, 105.16609 E) does not pass through any settlements in its entire course. The lower reaches of the Kamenushka (51.84457 N, 104.87505 E), Krestovka (51.85535 N, 104.85970 E), and Bolshaya Cheremshanaya rivers (51.84429 N, 104.83949 E) pass through the Listvyanka settlement, which exhibits heavy tourism activity. The water from these rivers enters the Listvennichny Bay, which has fast water exchange with Lake Baikal.
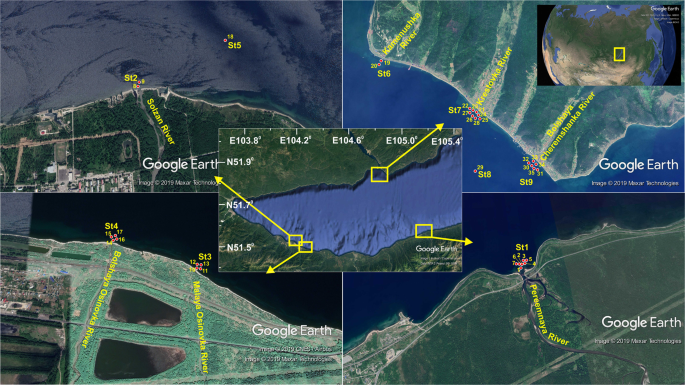
Map of the sampling sites. Sample numbers correspond to the numbers in in the table with the initial data (https://github.com/barnsys/bac_phyt_communities). Geographic coordinates of stations (degrees and decimal places): St1 51.56891 N, 105.16609; St2 51.49722 N, 104.15836 E; St3 51.50056 N, 104.25354 E; St4 51.50056 N, 104.24403 E; St5 51.53875 N, 104.19746 E; St6 51.84457 N, 104.87505 E; St7 51.85535 N, 104.85970 E; St8 51.86710 N, 104.83247 E; St9 51.84429 N, 104.83949 E. Maps were taken from the Google Earth Pro software (https://www.google.com/intl/ru/earth/versions/#earth-pro). «Inkscape» (https://inkscape.org/) free graphics editor was used to edit images and apply additional marks to maps.
This study examined two parameter categories. The first category describes the biological processes that occur in the studied waters (biological parameters): concentrations of organic carbon (Corg) and chlorophyll a (Chl_a), total phytoplankton mass (∑PB), total rate of methane oxidation (∑MO), count of organotrophic bacteria (OB), count of thermotolerant bacteria cultivated at 22 °C (TMC22C), count of thermotolerant bacteria cultivated at 37 °C (TMC37C), biogenic oxygen depletion (BOD), and total primary production rate (∑PP), which is the rate of light-dependent CO2 assimilation, total bacterial count (NB), and total bacterial primary production (∑BP) which is the rate of dark–assimilation CO2. The second category includes the hydrochemical parameters relevant for the microbial community: concentrations of Na+, K+, Ca2+, Mg2+, HCO3−, Cl−; concentrations of biogenic elements such as N(NO2−), N(NO3−), S(SO4−), N(NH4+), P(PO43−); concentration of dissolved carbon in carbon dioxide C(CO2) and methane C(CH4); oxygen concentration (O2); chemical oxygen depletion (COD); and water pH. Table with biological and hydrochemical parameters values are available at: https://github.com/barnsys/bac_phyt_communities.
Statistical analysis of hydrochemical and biological parameters of samples from ice and under-ice water
The result of the analysis of the relationship of hydrochemical and biological parameters is shown on the NMDS scatter plots Fig. 2. The statistical support for each factors are shown in Tables 1 and 2.
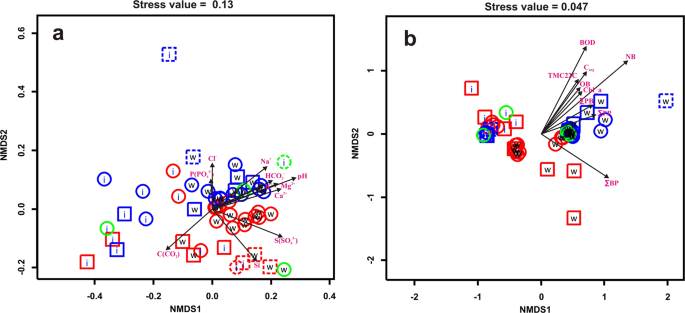
Scatter plots of sampling sites in two-dimensional NMDS space. (a) parameters describing biological processes are treated as explained variables, hydrochemical parameters are treated as explanatory ones, (b) hydrochemical parameters are explained, biological parameters are explanatory. Red — eastern coast, blue — western coast; green circles represent pelagic samples; circles — samples taken from the lake near river mouths, squares — river mouths; dashed blue squares are samples taken near the mouth of Bolshaya Cheremshanka river; dashed red pointers are samples taken near Bolshaya Osinovka and Malaya Osinovka rivers; w — water samples, i — ice samples. Plots show only the vectors of gradient for explanatory variables significantly affecting the datasets of explained variables (Tables 1 and 2).
When the biological parameters were treated as dependent variables, the following qualitative and quantitative factors were found to significantly affect them: concentrations of Na+, K+, Ca2+, Mg2+, C(CO2), Cl−, S(SO42−), P(PO43−), Si, HCO3−; pH; the coast of Lake Baikal (western or eastern); and the biotope (water column or ice) (PERMANOVA analysis Table 1). The strongest effects (R2 > 0.2) were observed for concentrations of Na+, K+, Ca2+, Mg2+, Cl−, HCO3−, P(PO43−), pH and sampling site (Table 1). Two major divisions between samples can be observed on the NMDS scatter plot (Fig. 2a). The first is more pronounced and separates the ice and water column samples. This division is statistically supported by the PERMANOVA analysis, since the biotope (ice or water column) is a significant factor that influences the values of biological parameters (Table 1). Water column featured higher concentrations of Na+, Ca2+, Mg2+, S(SO42−), and HCO3−, higher pH and lower C(CO2) concentration. The second is less pronounced and separates the samples from the eastern and western coasts of Lake Baikal. This separation also confirms by PERMANOVA analysis (Table 1). Western samples as a rule had higher Cl− and P(PO43−) concentration as well as lower concentrations of S(SO42)− and silicon (Si). A particularly high concentration of Cl− and P(PO43−) was in the sample of water and ice from the mouth of the Cheremshanka river (Fig. 2a).
When hydrochemical parameters were treated as dependent variables (Fig. 2b, PERMANOVA analysis Table 2), the following qualitative and quantitative factors were found to significantly affect them: Corg, ∑PB, Сhl_a, ∑PP, BOD, NB, ∑BP, OB, TMC22C, biotope (water or ice) and Coast (western, eastern). BOD, NB, ∑BP, and biotope had the strongest effects (R2 > 0.2). The ice and water samples (Fig. 2b, PERMANOVA analysis Table 2) differ in chemical composition. This usually comes from increased biological activity in the water samples (i.e., higher values of Corg, ∑PB, Сhl_a, ∑PP, BOD, NB, OB and TMC22C). Some western water samples (Fig. 2b) exhibited very high values of biological parameters Corg, ∑PB, Сhl_a, ∑PP, BOD, NB, ∑BP, OB and TMC22C. Particularly high values of these parameters were observed for the water samples from the mouth of Bolshaya Cheremshanka river.
The investigated area of the western coast of Lake Baikal in the area of Listvyanka settlement, especially in the mouths of the rivers, also showed high values of biological parameters (implying high rates of biological processes) (Fig. 2). In addition to biological parameters that significantly affect hydrochemical variables, this sample had the highest counts of organotrophic bacteria (OB), thermotolerant bacteria cultivated at 22 °C (TMC22C), and thermotolerant bacteria cultivated at 37 °C (TMC37C). These samples showed high concentrations of Cl−, which is an indicator of anthropogenic pollution. One of the ice samples taken at the same site had an even higher Cl− concentration and lower bacterial and phytoplankton activity (roughly similar to other ice samples from the lake) (Fig. 2). All rivers (Kamenushka, Krestovka, and Bolshaya Cheremshanaya) flowing into the lake in the area pass through the Listvyanka settlement in sections ranging from 1.6 to 2.8 km (Fig. 1).
For both hydrochemical and biological parameters, parameter variance did not appear to correlate with the significance of the parameter’s effect on the diversity of sampling sites (Tables 1 and 2). Parameters with high coefficient of variation between the samples (CV > 1) may have little impact on the patterns of other parameters. In contrast, parameters with low coefficient of variation (CV < 1) may affect other parameters with high significance and R2 (R2 > 0.3).
Analysis of the correlation between hydrochemical and biological parameters of samples from under-ice water
Because the water samples were significantly different from the ice samples on both hydrochemical and biological parameters, only the water samples were used in the correlation analysis and heat map; the number of ice samples (n = 16) was not sufficient for a separate multivariate correlation analysis. Results of the multivariate correlation analysis are shown in Fig. 3 as a heat map. Based on the clustering, several groups of intercorrelated variables were identified. The largest group (cluster A) included hydrochemical parameters such as the P(PO43−), Mg2+, Na+, K+, Ca2+, HCO3−, Cl−; COD. This group also included biological parameters such as Corg, Сhl_a, ∑PB, ∑PP, NB, ∑BP, and BOD. All of these parameters showed positive pairwise correlations with each other. The second group (cluster B) included three variables: N(NH4+), C(CH4), and the count of thermotolerant bacteria cultivated at 37 °C (TMC37C). These three variables showed slightly positive pairwise correlations. The third group (cluster C) included O2 concentration and ∑MO. In most cases, these two parameters were weakly correlated, whether to each other or to other variables. The only exception was the correlation between ∑MO and C(CH4). The correlation value for this pair was close to 1. The last group (cluster D) included seven parameters: N(NO2−), N(NO3−), S(SO42), C(CO2), Si, TMC22C, and OB. All variables within this cluster were strongly positively correlated with each other.
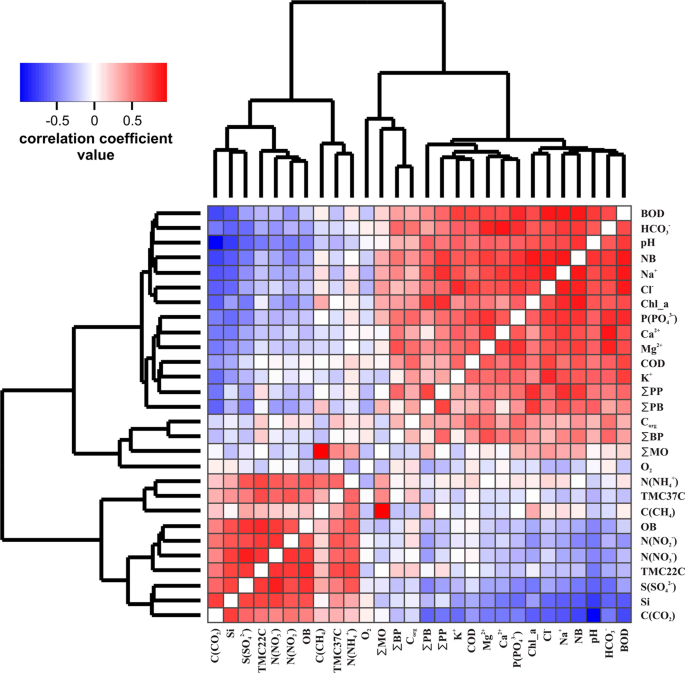
Heat map of pairwise correlation coefficients for biological and hydrochemical parameters. Parameters in the heat map are ordered according to the clustering based on similarity of correlation coefficient vectors. Clusters discussed in text (A, B, C, D) are shown on the clustering dendrogram.
When examining the areas of the heat map describing inter-cluster correlation coefficients, all values were either close to zero or negative. There were two pronounced groups with high positive correlation coefficients for intragroup correlations as well as high negative correlation coefficients for intergroup relationships (closely connected groups). The first group included a part of cluster A, particularly such hydrochemical parameters as P(PO43−), Mg2+, Cl−, HCO3−, Na+, Ca2+, K+, and water pH as well as such biological parameters as ∑PB, Сhl_a, NB, and BOD. The second group consisted of all variables from cluster D (i.e., N(NO2−), N(NO3−), S(SO42−), C(CO2), Si, TMC22C, and OB). In general, an increase in the parameters of the former group caused a decrease in the parameters of the latter, and vice versa.
Network analysis of the correlation relationships between hydrochemical and biological parameters of samples from under-ice water
After correcting the P values for pairwise correlations between biological and hydrochemical parameters, only correlation coefficients (r) with absolute values above 0.5 were significant (p < 0.05). These pairwise correlation coefficients were used to build the interaction network (Fig. 4).
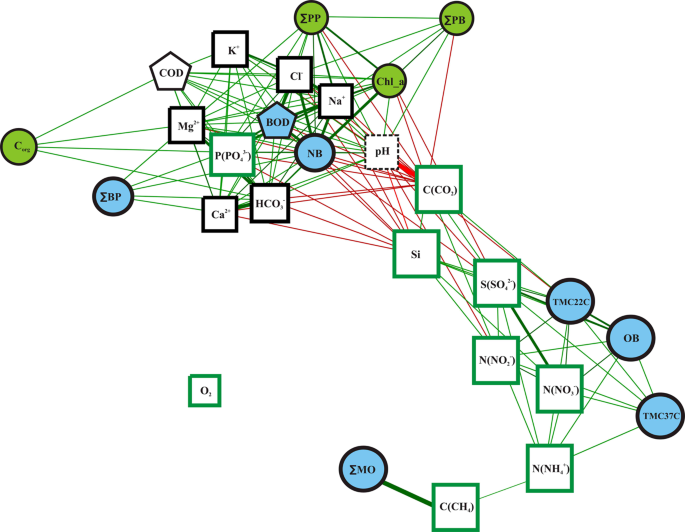
The network of correlations between all measured parameters (both biological and hydrochemical). Blue shapes mark the parameters related to the bacterial activity, green circles mark the parameters related to phytoplankton activity, black squares — mineral ion concentrations, green squares — concentrations of biogenic elements, pentagons mark the rate of biogenic and chemical oxidation of organic matter. Green edges mean significant positive correlations, red edges mean significant negative correlations.
As with the heat map, there were two major groups of parameters in the interaction network. The first group included hydrochemical parameters such as P(PO43−)−, Mg2+, Na+, K+, Ca2+, HCO3−, Cl−, pH, and COD; and biological parameters such as Corg, Сhl_a, ∑PB, ∑PP, ∑BP, and BOD. All of these parameters were positively correlated to each other. The second group included N(NO2−), N(NO3−), S(SO42−), C(CO2), P(PO43−), Si, С(CH4), OB, TMC22C, TMC37C, and ∑MO. All of these were also positively correlated to each other. In contrast, all of the edges between these two groups corresponded to negative correlations. In other words, increasing any parameter or group of parameters from the first group will (through a chain of interactions) lead to an increase in all parameters from the first group as well as a decrease in all parameters from the second group. The same can be said about the parameters in the second group. Thus, the results of the interaction network analysis are comparable to the results of the heat map.
Based on the number of edges, the parameters were separated into three groups. The first group included the parameters with a lot of connections (11–18). More specifically, this group included P(PO43−), Mg2+, Na+, K+, Ca2+, HCO3−, Cl−, S(SO42−), Si, C(CO2), COD, BOD, NB, Сhl_a, ∑PB, ∑PP, and water pH. Among these parameters, S(SO42−), pH, Si, and C(CO2) had the highest number of negative correlations. The second group had a moderate number of correlations (6–10 edges). Among its members are N(NH4+), N(NO2−), N(NO3−), ∑PB, OB, TMC22C, and TMC37C. Parameters in this group had very few negative correlations (0 or 1). The third group featured the outliers with 1–4 connections: C(CH4), Corg, and ∑MO. Oxygen concentration (O2) had no significant correlations at r > = 0.5.
All nodes had relatively low betweenness centrality (ranging from 0 to 0.174, with the highest possible value being 1) (Table 3). Dissolved carbon dioxide concentration (C(CO2)) had the highest betweenness centrality value. This means that the shortest path between any two nodes in the network often passes through the C(CO2) node. C(CO2) also had the highest number of negative correlations, as shown by the number of negative correlation edges in the network. The nodes with the next highest betweenness centrality values were S(SO42−), N(NH4+), and N(NO2−) at the values of 0.105, 0.137, and 0.134, respectively. The two nitrogen concentrations N(NH4+) and N(NO2−) did not have a notable number of connections (7 and 9 edges, respectively). The group with betweenness centrality values between 0.05 and 0.1 included C(CH4), Si, and water pH. Si− and water pH had a high number of correlations with neighboring nodes, while C(CH4) was positively correlated with only two other parameters.
Source: Ecology - nature.com
