Cross-community migration is pervasive in rural Uganda
Rakai District is a predominantly rural district in south-central Uganda (area ~2200 km2, population ~518,000) bordered by Masaka District to the north, Tanzania to the south, and Lake Victoria to the east. The Rakai Community Cohort Study (RCCS) is an open population-based household census and cohort of adults aged 15–49 years conducted in 40 communities in Rakai District and surrounding areas since 199439.
To understand the patterns of migrations in Rakai and their role in the spread of HIV, we analyzed data from 38 communities included in two sequential RCCS survey rounds. The first survey, denoted as R15, was conducted between 8 August 2011 and 30 May 2013. The second survey, denoted as R16, was conducted between 21 August 2014 and 30 January 2015. Communities included 27 rural agrarian villages, seven semi-urban trading centers and four Lake Victoria fishing communities. HIV prevalence ranged from 9% to 26% in agrarian communities, 11% to 21% in trading communities, and 38% to 43% in fishing communities.
Of 33,727 unique individuals who were census-eligible for the RCCS (23,415 in R15, 26,084 in R16), 23,633 (70%) were present in the community at time of survey for at least one of the two surveys. Being away for work or school was the most common reason for absence. Refusal rates were low, with 95% (n = 22,901) of those eligible and present in the community at time of survey participating (15,880 in R15, 16,851 in R16). Long-term residents—those living in the same community in both study rounds—and in-migrants—those moving into an RCCS community between surveys regardless of origin—participated at similar rates (64% vs. 67%); however, participation rates were lower among out-migrants who moved away from study communities after R15 (59%, Supplementary Table 1).
Of the eligible censused population in R15, 24% (n = 5,585/23,415) had out-migrated to another community (almost exclusively outside of the study area), and of the eligible censused population in R16, 21% (n = 5,498/26,084) had in-migrated into one of the 38 study communities32. The overall rates of out-migration and in-migration estimated from these census data were 10.9 and 10.1 per 100 person years (py), respectively. However, migration rates varied markedly across communities (Fig. 1a). Out-migration rates ranged from 5.4 to 24 per 100 py and in-migration rates from 4.2 to 23 per 100 py, with significantly higher levels of in-migration in trading centers (median = 16 per 100 py: IQR: 11–18) and Lake Victoria fishing communities (13 per 100 py, IQR: 12–15) compared to agrarian communities (7.2 per 100 py; IQR: 6.4–8.6; Wilcoxon-rank sum p-values < 0.001 for both comparisons). Rates of in- and out-migration were positively correlated at the community-level (coef = 0.86, R2 = 0.55, linear regression p-value < 0.001, Fig. 1a).
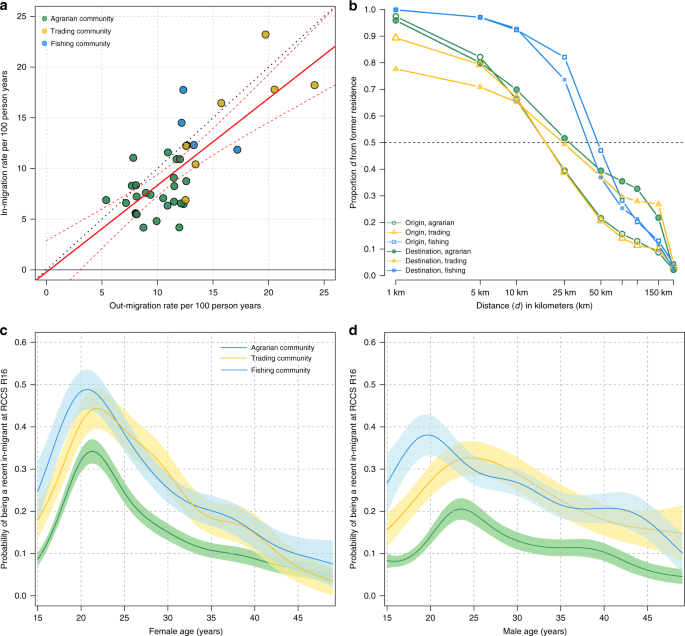
a In-migration and out-migration rates per 100 person-years in 38 RCCS communities. Agrarian communities are shown in green, trading communities in yellow, and fishing communities in blue. b Inverse cumulative distance kernels for place of origin and destination for in-migrants and out-migrants, respectively, showing the proportion who migrated at (or further) particular distances d from origin. Distances are from the source/destination location of each migrant relative to their current/former household in kilometers. c, d Proportion of women and men classified as in-migrant at R16 by age and community-type with 95% confidence intervals shown as shaded areas.
Among censused eligible persons who participated in at least one of the two surveys (n = 22,901), 29% migrated either into or out of the study communities. Migration was most common among adolescents and young adults aged 15–24 years, with in-migration peaking among men and women in their early 20s (Fig. 1c, d). Similar trends in likelihood of migration by age was observed among out-migrants (Supplementary Fig. 1). Overall, in- and out-migration was more common among women. Among R15 survey participants, 25% of women out-migrated compared to 22% of men (Poisson regression p-value < 0.001), and of R16 participants, 24% of women were in-migrants compared to 19% of men (Poisson regression p-value < 0.001). In- and out-migrants were less likely to be married and to work in agriculture compared to residents (Table 1). Women most frequently migrated for marriage, for work, or to live with family and friends, while men mainly moved for work or to start a new household.
Hotspots have geographically diverse migrant populations
We geocoded place of destination for 74% (n = 4,122/5,585) of out-migrants and place of origin for 84% (n = 4,637/5,498) of in-migrants censused, irrespective of survey participation (Supplementary Table 2). Slightly more than half of these in-migrants (56%, n = 2,596/4,637) arrived from communities within Rakai District. A substantial proportion of in-migrants also came from the Masaka District (19%, n = 875), which borders Rakai to the north and Kampala (6%, n = 309), the capital city of Uganda. Of 233 international in-migrants (5% of all in-migrants), 92% (n = 209) arrived from the Kagera District in Tanzania, which is directly south of Rakai. Individuals who out-migrated also tended to move to other Rakai communities (41%; n = 1,792/4,122), Kampala (27%; n = 1,111), Masaka (18%, n = 731), and Kagera (3%, n = 118).
Median distance from place of origin was significantly greater among persons moving into fishing communities (median = 48 km, IQR: 33–84 km) than those moving into either trading (18 km, IQR: 6–44 km, Wilcoxon-rank sum p-value <0.001) or agrarian communities (18 km, IQR: 7–42 km, p < 0.001) (Fig. 1b). Similar trends were observed among out-migrants from fishing communities who moved a median of 44 km (IQR: 24–76) compared to a median of 25 km (IQR: 3–156) and 27 km (IQR: 8–144) among out-migrants from trading and agrarian communities, respectively. Migrants of fishing communities also came from and went to a more geographically diverse set of locations than migrants from other RCCS communities (Supplementary Fig. 2). Out-migrating men and women, younger persons, and HIV-negative individuals traveled further on average than other demographic subgroups or HIV-positive persons (Supplementary Fig. 3).
HIV prevalence is higher among female migrants
HIV testing was performed for all consenting RCCS participants during both survey rounds. Among women, age-adjusted HIV prevalence was 30% higher among in-migrants compared to long-term residents across all study communities (Fig. 2, Supplementary Table 3a). Analyses stratified by community-type showed that this disparity was driven by female in-migrants in agrarian communities whose age-adjusted HIV prevalence was 1.64 times higher compared to long-term residents (95% CI: 1.39–1.92). Prevalence of HIV among female in-migrants was somewhat, but not statistically significantly, higher than long-term residents in trading communities (Prevalence Risk Ratio [PRR] = 1.25; 95% CI: 0.95–1.65) and roughly equivalent in fishing communities (PRR = 1.08; 95% CI: 0.93–1.26). HIV prevalence was also significantly higher among female out-migrants compared to long-term residents (PRR = 1.27; 95CI: 1.26–1.58), with the greatest relative difference observed among women in agrarian communities (PRR = 1.50; 95% CI: 1.26–1.58).
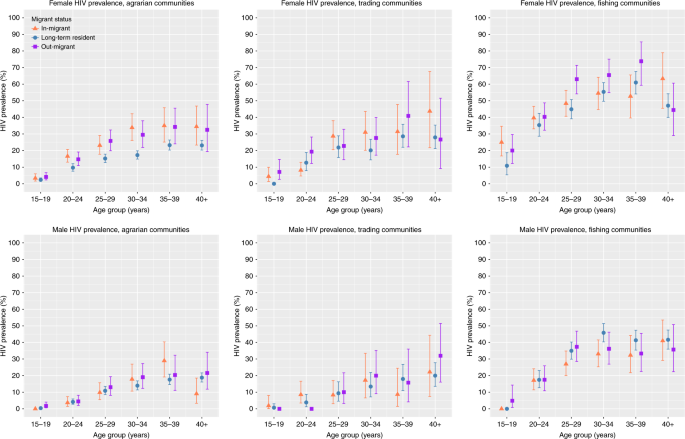
Figure shows HIV prevalence with 95% confidence intervals (bars) among in-migrants (orange triangle), out-migrants (purple square), and long-term residents (blue circle) at R16. Prevalence and 95% confidence intervals were estimated using Poisson regression models.
HIV prevalence was notably elevated among female migrants in fishing communities, with prevalence among in-migrants peaking at 63% (95% CI: 46–79%) among women over 40 years and at 74% (95% CI: 59–85%) among out-migrant women 35–39 years. Among women 15–19 years, HIV prevalence among in-migrants in fishing communities was 25% (95% CI: 17–35), whereas HIV prevalence among long-term fishing community residents of the same age was 10% (95% CI: 5.4–19%). In contrast, adolescent female prevalence was only 3.4% (95% CI: 1.6–6.0) among in-migrants and 2.4% (95% CI: 1.5–3.5%) among long-term residents in agrarian communities.
While HIV prevalence was generally higher among female migrants compared to long-term residents, HIV prevalence was not significantly higher among in-migrant or out-migrant men compared to long-term resident men (Supplementary Table 3b). There also were no significant differences between the HIV prevalence of out-migrants and in-migrants of either sex (Supplementary Table 4).
HIV-positive women migrate more than HIV-negative women
We also assessed the relative risk of out-migration by HIV serostatus (Table 2). Overall, HIV-positive women were 1.33 times (95% CI: 1.19.49) more likely to migrate compared to HIV-negative women after adjustment for age and community-type, with the greatest differences in out-migration by serostatus observed among agrarian women. In contrast, HIV-positive men were no more likely to migrate than HIV-negative men (Table 2).
Migrants are the majority of newly detected HIV infections
There were 1197 persons with HIV infection in R16 who tested HIV seropositive in the RCCS for the first time (Fig. 3a). Of these newly detected cases, 162 (14%) were incident HIV infections (i.e. had a prior HIV-negative test at R15) and 350 (29%) were new cohort enrollees who were long-term residents with unknown duration of HIV infection. The remaining 685 (57%) newly detected cases were in-migrants, 70% (n = 480) of whom were women.
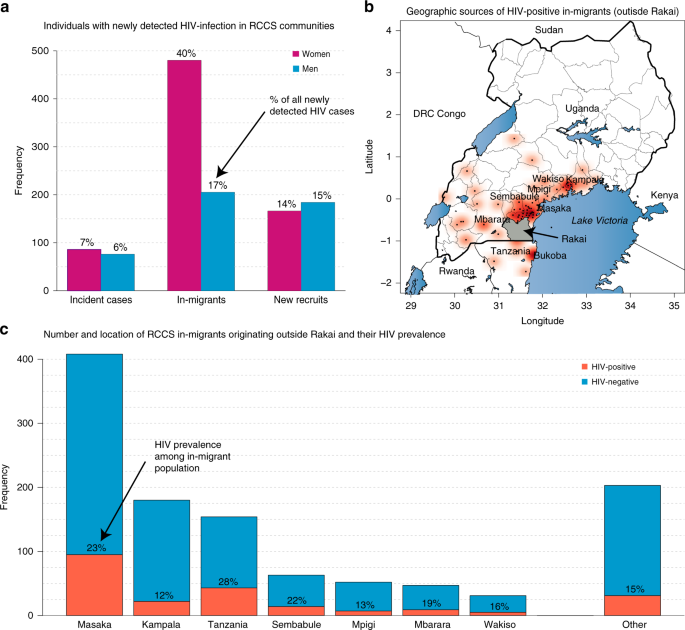
Newly detected cases were defined as individuals testing HIV seropositive for the first in the RCCS. a Frequency and proportion of newly detected incident cases among long-term residents, newly detected cases of unknown duration among in-migrants, and newly detected cases of unknown duration among recently recruited long-term residents. b Point density map showing place of origin among HIV-positive in-migrants with darker red areas indicating a higher frequency of in-migrants. c HIV prevalence among in-migrating populations originating from districts outside of Rakai.
In-migrants with newly detected HIV in the RCCS have an unknown duration of HIV infection and may have previously tested positive for HIV. However, HIV-positive in-migrants of both genders were significantly less likely to report ART use than were long-term residents, even accounting for potential biases in survey participation (Table 3, Supplementary Table 5).
Of the 547/685 (80%) in-migrants, who were newly detected HIV cases and for whom a place of origin was known, 281 (51%) originated from within the Rakai District. Of those infections originating outside Rakai (n = 266), 51% (n = 136) were from Masaka District, 16% (n = 42) from Tanzania (all from the neighboring Kagera District), and 8% (n = 22) from Kampala (Fig. 3b). HIV-prevalence among all in-migrants from outside Rakai by place of origin (n = 1138) is shown in Fig. 3c and was the highest at 28% (95% CI: 20–37%) among those from Tanzania.
HIV-positive migrants tend to move to hotspots
We assessed the geography of migratory movements using RCCS data aggregated to the sub-district-level and scaled to reflect local population densities (see Methods). There were nine inland sub-districts (abbreviated ISD1-9) including agrarian and trading communities and two fishing sub-districts including the fishing communities and four neighboring agrarian communities (abbreviated FSD1-2). The migration network showed strong links between sub-districts containing Rakai’s high prevalence fishing communities with Tanzania and Masaka District (Fig. 4a). There were multiple weaker links with Rakai District’s inland populations; however, these connections were predominately directed into rather than out of the two fishing sub-districts. Table 4 shows that there were substantially more in-migrants moving from the inland sub-distracts to fishing sub-districts than vice versa, and that the majority of HIV cases among in-migrants were from inland sub-districts. Considering migrant populations from all places of origin and total HIV case burden in the sub-district, we estimated that out-migrants from hotspots contributed to no more than 1.3% (median = 0.4%: IQR: 0–1.1%) of all HIV cases in the nine inland sub-districts.
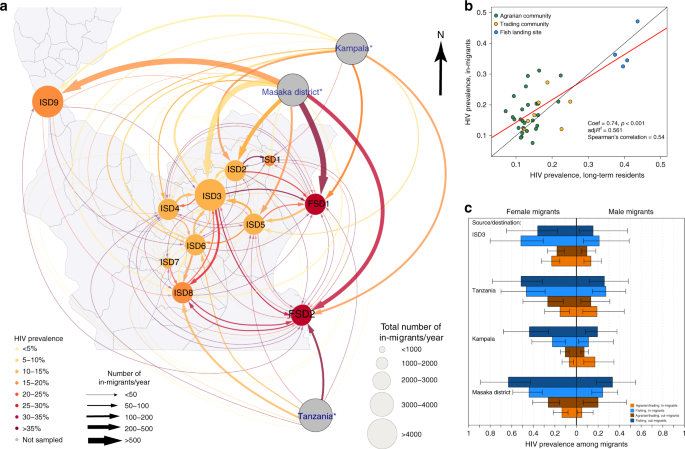
a Figure shows migration networks at a sub-district level where arrows indicate the frequency of migrants originating from a particular source location. The size of circles corresponds to the size of the total in-migrating population in the sub-district and the size of arrow to the size of the in-migrating population from the associated source location. Color of circles and arrows correspond to HIV prevalence. Labels ISD1-9 denote inland sub-districts 1 through 9 and FSD1-2 fishing sub-districts 1 and 2. Asterisk indicates that the size and color of the circles for Tanzania, Masaka, and Kampala do not reflect the size of migrant populations or prevalence in those locations. b HIV prevalence among in-migrants vs. HIV prevalence among long-term residents at the community-level. Agrarian communities are shown in green, trading communities in yellow, and fishing communities in blue. The best fit line was estimated using linear regression and is shown in red. The identify line is shown in black. c HIV prevalence among out-migrants from fishing communities (dark blue) and out-migrants from agrarian communities (dark orange) stratified by four places of destination. Also shown is HIV prevalence with 95% confidence intervals (bars) among in-migrants by place of origin and whether they moved into a fish community or a trading/agrarian community (light orange). Prevalence and 95% confidence intervals were estimated using Poisson regression models.
The reconstructed migration network in Fig. 4a showed that migrant populations with higher HIV prevalence moved into hotspot fishing communities. At the community-level, HIV prevalence among in-migrants was significantly correlated with the HIV prevalence in the long-term residents of destination communities (Fig. 4b). HIV prevalence in most cases was higher among migrants moving into and out of fishing communities regardless of their place of origin or destination (Fig. 4c, Table 4), with larger differentials between migrants and residents observed in women than in men. For example, 45% (95% CI: 34–59%) of female in-migrants from Masaka who in-migrated to fishing communities were HIV-positive compared to 13% (95% CI: 8.0–19%) of women who in-migrated from Masaka to agrarian and trading communities (Poisson regression p-value < 0.001). Prevalence of HIV among women who out-migrated to Masaka was also greater among women who originated from one of the fishing communities (56%; 95% CI 41–75%) than from the agrarian and trading communities (19%; 95% CI: 12–29%; Poisson regression p-value < 0.001).
Table 4 summarizes HIV prevalence data among long-term residents and in-migrants by place of origin across the nine inland and two fishing sub-districts depicted in Fig. 4a. This analysis was restricted to in-migrants who moved from one of the nine inland or two fishing sub-districts only. The HIV prevalence among in-migrants who moved to an inland sub-district from one of the two fishing sub-districts was somewhat higher compared to the HIV prevalence of in-migrants who originated from one of the nine inland sub-districts (16.1% vs. 21.5%), and this difference was driven exclusively by female in-migrants. In comparison, the HIV prevalence among in-migrants who moved to a fishing sub-district was substantially higher than the HIV prevalence among in-migrants who moved to an inland sub-district. HIV prevalence among in-migrants moving to fishing communities did not statistically significantly differ if they originated from an inland or fishing sub-district (35.0% vs. 30.6%).
Since the high prevalence of HIV observed among in-migrant populations in fishing communities could be because individuals rapidly acquire HIV after moving there rather than coming into destination communities already HIV positive, we assessed HIV prevalence by length of stay in fishing communities (Fig. 5). If individuals predominately acquire HIV after rather than before arrival, HIV prevalence should increase with duration of stay. Instead, we found no statistically significant differences in female HIV prevalence by duration of stay. However, HIV prevalence among male in-migrants increased with duration of stay from 18% to 39% over 2 years (Poisson regression p-value = 0.006), suggesting a substantial proportion of these male migrants likely acquired infection within the fishing communities.
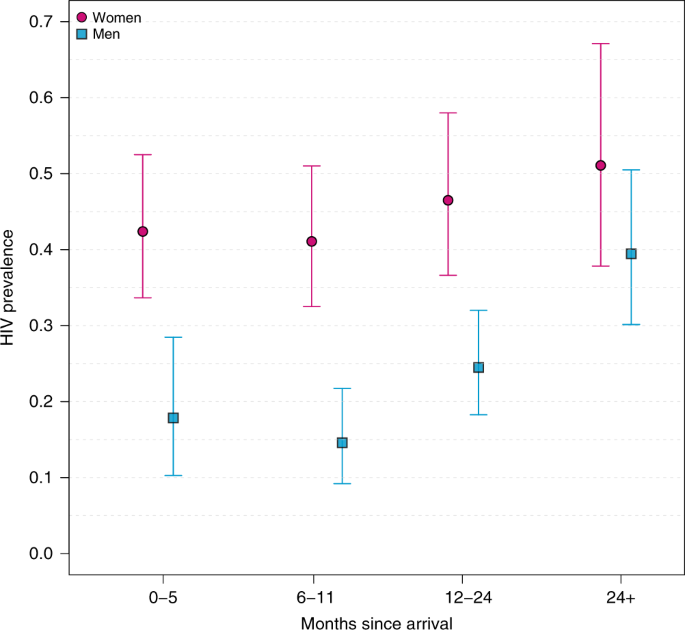
Female HIV prevalence is shown with circles (pink) and male HIV prevalence with squares (blue). Bars represent 95% confidence intervals. Prevalence and 95% confidence intervals were estimated using Poisson regression models.
Source: Ecology - nature.com
