Colony housing
Trials were conducted on the campus of Royal Holloway University of London from August–October 2017 (Table 1). At this time of year, natural food sources are relatively scarce compared to spring and early summer39, thereby ensuring honeybees’ interest in the provided sucrose feeders. Four queen-right honeybee Apis mellifera colonies were housed indoors within three-frame glass-walled observation hives, with unrestricted tunnel-based access to the outdoors. Each colony contained 2000–3000 workers, brood and reserves of pollen and honey.
Training procedure
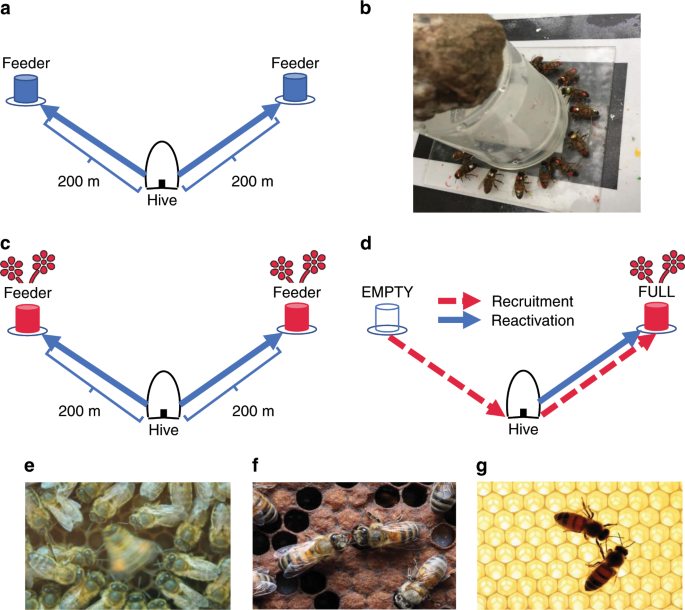
Our experimental design followed a dual-feeder set-up, whereby one cohort of bees (FULL group) were trained to a feeder that offered rewards throughout training and testing, while a second (EMPTY group) visited a feeder that became unrewarding after training (Fig. 1). During testing, the EMPTY group thus provided a pool of marked, motivated bees that were unemployed and amenable to recruitment within the timeframe of our experiment. Working with one colony at a time (n = 4 colonies), we trained the two cohorts (18–30 individuals per group) to their respective feeders over 4–9 days (depending upon weather conditions) following standard protocols1,51. During training, newly arrived unmarked foragers were individually marked at the feeder with enamel paints (Humbrol®; Fig. 1b). Subsequent in-hive visual observation served to confirm whether newly marked individuals belonged to the focal colony. Any individuals not observed in the hive were captured upon returning to the feeder and later frozen, thereby preventing non-focal colonies from interfering with or outcompeting our focal cohorts at the feeders.
At the end of training, feeders were located 200 m from the hive with an angular separation of ~110o as observed from the hive (Fig. 1a). Any individuals that switched between feeders during training were captured, so trained foragers almost certainly knew of only one feeder location following training. Four sites were used across the study, with each serving once as the location that individuals were recruited from (EMPTY feeder) and once as the location individuals were recruited to (FULL feeder). As the length of time taken to complete training varied across trials (Table 1), and because individuals were recruited to their feeders at different times during that process, we used unscented sucrose during training until the final pre-trial day, to limit among-individual variation in exposure to the scented sucrose used during the odour treatment and trial.
As exposure to familiar food odours may be important for forager reactivation and recruitment10,13,45, feeders provided scented 2 M sucrose solution for 1 h (~1000–1100 h) on the day prior to the trial (Fig. 1c). Following previous work13,43,51, we mixed 50 µL essential oil per litre sucrose solution. During this period (hereafter the odour treatment), foragers made several collecting trips to their feeder (mean ± SD visits = 6.08 ± 3.06), thereby allowing individuals to associate the provided scent with their familiar feeding site. Honeybees can form long-term olfactory memories after as few as three exposures64. The same scent was provided at both feeders within a trial and a different scent was used for each colony (colony 1: peppermint; colony 2: geranium; colony 3: lavender; colony 4: orange). After 1 h, both feeders were removed for the remainder of the day.
Trial procedure
On the day following the odour treatment, both feeders were set up for 2 h (~0930–1130 h). The FULL feeder supplied 2 M sucrose solution scented identically as during the odour treatment, while the EMPTY feeder was left unfilled (Fig. 1d). As both feeders had been equally profitable the day before, individuals trained to either feeder should have been equally motivated to return on the morning of the trial to assess their foraging site’s continued profitability. Those bees returning from the EMPTY feeder, having learnt that it was no longer rewarding, were thus amenable to recruitment to the FULL feeder, which represented a new patch of the focal flower species. Recruitment could have been mediated either by individual search or by interactions (e.g., dance following, trophallaxis and antennation) with foragers collecting from the FULL feeder. Initial arrivals at the FULL feeder by members of the EMPTY cohort were the focus of the “Recruitment NBDA”. At the same time, by recording initial arrivals at the same FULL feeder by bees in the FULL group, we also could examine reactivation of trained individuals to their familiar foraging site (reactivation NBDA). Note that we also analysed reactivation of the EMPTY group to the EMPTY feeder in an additional NBDA (see Supplementary Note 1). Trials lasted for 2 h, and all arrival times were verified by video (Canon Legria HF R806 digital camcorder). Any unmarked bees that arrived at the FULL feeder were captured by an observer before they could return to the hive.
In-hive interactions during each trial were filmed (Canon Legria HF R806 digital camcorder). Observation hives were constructed such that returning foragers remained on one side of the hive because a wooden ballast prevented easy crossing51. Each individual returning from the FULL feeder was followed for the complete duration of its hive stay, meaning we were able to obtain a near-complete record of all contacts with individuals knowledgeable about the FULL feeder (hereafter demonstrators). We recorded the following types of interaction between these demonstrators and other marked individuals: (a) dance following: an individual was oriented towards and within one antennal length of a demonstrator during the latter’s performance of a waggle dance (Fig. 1e); (b) trophallaxis: an individual’s extended proboscis contacted a demonstrator’s mouthparts (Fig. 1f) and (c) antennal body contact: an individual’s head was directed towards and within one antennal length of the demonstrator’s body (Fig. 1g). By definition, antennal body contact occurred during any instance of dance-following and trophallaxis, but also occurred outside these contexts. The times at which each interaction began and ended were recorded, as were the number of waggle runs followed for each bout of dance following.
The NBDA did not include other sources of social information that can aid foragers in pinpointing a resource once in the field, such as forager-produced pheromones or visual/olfactory cues65,66. Since these cues were likely available to all bees once they reached the immediate vicinity of the food source, failing to include these potential transmission opportunities means that the estimated strength of social transmission through our focal networks is, if anything, likely to be conservative30.
The experiments described here were conducted in accordance with guidelines established by the Research Ethics Committee of Royal Holloway University of London.
Network-based diffusion analysis
NBDA quantifies the rate at which naïve individuals first express a target behavioural pattern as a function of their connectedness to knowledgeable demonstrators22,23; for a mathematical description of the model, see Supplementary Note 2. The behaviours of interest in the current study were discovery of the FULL feeder’s location by any individual trained to the EMPTY feeder (recruitment) and for those individuals trained to the FULL feeder, an individual’s first return to its familiar feeder (reactivation); for both behaviours, individuals were assumed to become informed at the time at which they first landed on the feeder of interest. The core assumption underlying NBDA is that if a target behaviour is transmitted socially, then its diffusion is predicted to follow a social network reflecting social transmission opportunities30. The standard NBDA model incorporates a single social network, and so cannot determine whether transmission rates vary across different types of social connection. Here, we used a recently developed NBDA variant27 that permits researchers to incorporate multiple social network types within a single model and thereby test whether social transmission rates vary across these different pathways.
The standard NBDA model also assumes social network structure remains static during a diffusion, an assumption that can be misleading when networks directly quantify social transmission opportunities. For instance, imagine three honeybees (A–C) during a recruitment trial, with individual A knowing the feeder’s location. Individual B first follows six waggle runs produced by A before it discovers the novel feeder. Next, individual C follows ten waggle runs produced by A before it too finds the site. A static network would predict that C should arrive before B, whereas a dynamic network that takes the time course of interactions and feeder discoveries into account properly predicts that B should arrive first. As such, here we use an NBDA variant that incorporates dynamic, time-varying networks (see ref. 26 for additional information). Specifically, networks updated when the next individual to become informed was last observed within the hive prior to arriving at the respective feeder. For events in which an individual left the hive prior to other naïve individuals, but arrived at the feeder after them, we used the latest update time to that point; in other words, networks were not allowed to “rewind”.
NBDA can use either the order in which individuals acquire the target behaviour (order-of-acquisition) or the times at which they do so (time-of-acquisition). The latter approach often has more power to detect social transmission, but also makes more stringent assumptions about the shape of the baseline acquisition rate function: i.e., the manner in which the rate of acquisition changes over time23. A honeybee forager’s daily routine is determined by a complex mix of factors both internal (e.g., a colony’s nutritional needs) and external (e.g., resource availability and temperature) to the hive, thus making a constant, or monotonically increasing or decreasing baseline rate function likely inappropriate for our study. Consequently, we opted to employ order-of-acquisition diffusion analysis (OADA), which assumes only that the baseline rate function is the same for all individuals. In order to increase our power to detect social transmission, we used an OADA variant that is sensitive to differences in learning rate across groups. This was done by including all four colonies in the same diffusion, taking as data the recruitment/reactivation order across all colonies, but setting all among-colony network connections to zero (see ref. 41 for additional information).
We assessed the ability of three network types to predict feeder arrival order for both reactivation and recruitment: (i) dance-following, (ii) trophallaxis and (iii) antennal body contact. All networks were directed, with links travelling from individuals collecting sucrose from the FULL feeder towards individuals either to be recruited (EMPTY group) or to be reactivated to their familiar feeder (FULL group). Connections in the dance-following network were weighted according to the number of waggle runs followed, as waggle runs contain the components known to encode spatial information1. For both the trophallaxis and antennal contact networks, two network variants were considered: network connections were either weighted by interaction duration (s) or by the number of unique interaction events (i.e., ignoring the duration of each event).
We included three additional predictor variables in the NBDAs to test for potential influences on asocial and social learning rates: (i) trial ID, (ii) the number of days of foraging experience at a feeder’s 200 m location (mean-centred; reactivation diffusion only) and (iii) the number of trips to the EMPTY feeder before locating the FULL feeder (mean-centred; recruitment diffusion only; time-varying variable that updated with the networks). The impact of these variables on asocial and social learning rates were modelled as linear effects on the log scale23,41; for further information, see Supplementary Note 2.
Across all four colonies, 91 individuals reactivated to the FULL feeder and 56 individuals were recruited to the FULL feeder during the 2-h trial period (Table 1). For the recruitment NBDA, any individual that had been trained to the FULL feeder was treated as informed from the start of the trial, but only began transmitting to nestmates once it began collecting from the FULL feeder during the trial. For the reactivation NBDA, some individuals were present at the FULL feeder from the start of the trial or shortly thereafter, or were not observed within the hive prior to arriving at the feeder (n = 24). These individuals were excluded as potential learners in the reactivation NBDA—though they were still permitted to transmit information after arriving at the FULL feeder—in order to restrict our analysis to the subset of individuals that could have engaged in our focal transmission pathways (whether or not they actually did so). In addition, ten marked individuals were recruited to the FULL feeder without having been trained to either feeder location; these individuals were also included in the reactivation NBDA as previously informed demonstrators, but not as potential learners.
We employed a multimodel inferencing approach34 in which every NBDA model for all combinations of the following parameters was constructed. Models could include up to three separate network types: dance following, trophallaxis and/or antennal body contact. For both the trophallaxis and antennal contact networks, variants were considered in which network edges were weighted either by the number of interactions or their duration. Only one variant for a given network type was included within a model—e.g., a model that included “trophallaxis (duration)” did not also include “trophallaxis (number of interactions)”. Models were also considered in which social transmission rates (s) were allowed to vary across the trophallaxis and antennal contact networks, or were constrained to be equal. For the reactivation NBDA, two additional predictors were considered: trial ID (1/2/3/4), and the number of days of foraging experience at the feeder’s 200 m location; the former was treated as a factor, and the latter as continuous. For the recruitment NBDA, additional predictor variables included: trial ID and the number of visits to the EMPTY feeder during the trial, with the latter treated as continuous. We considered models in which each predictor could either influence asocial learning only, social transmission only, or an “unconstrained” model that estimated effects on asocial and social learning as independent parameters41. We also included models in which only asocial learning was possible (s = 0), as well as models in which social transmission was assumed to operate homogeneously within colonies. This latter option assesses the possibility that our measured networks failed to reflect the actual transmission pathways at work41.
Homogeneous networks were constructed by forming connections between each individual when it first returned to the nest after visiting the FULL feeder and every other colony member that had yet to be reactivated or recruited (depending on the diffusion), save for those individuals who had left the hive—either to return to their familiar feeder or because they had been successfully recruited—prior to the former’s return. For informed individuals whose first return to the hive was not observed (n = 6), we assumed they began transmitting when they first arrived at the FULL feeder instead. Constructing the homogeneous networks in this way attempts to account for all possible means of within-nest social information transfer, thereby serving as an appropriate “null” model relative to our measured networks.
For each model, we obtained its Akaike information criterion corrected for sample size (AICc) and used these to calculate Akaike weights (wi) indicating the relative support for a model given the data34. Overall support for each network type, predictor variable or for models in which only asocial learning was permitted was calculated by summing wi across each model in the full model set that included the element of interest. Model averaging was used to obtain parameter estimates34. For model-averaging, we excluded models that included the homogeneous networks, as these models greatly skewed model-averaged estimates yet received virtually no support (Σwi < 0.001). For the trophallaxis network, whichever variant (in terms of whether connections were weighted according to the number of interactions or their duration) that received less support was also excluded for model-averaging; this was also done for the antennation network. Finally, we further excluded any models that failed to satisfactorily converge. Note that for non-converged models, AICc (and by extension, Akaike weights) can still be trusted. This is because convergence failure arises when a range of values for one or more parameters have a very similar log-likelihood; this makes it difficult to find the maximum likelihood estimators, but this also means that the log-likelihood returned for a non-converged model, and thus the AICc, will be accurate to several decimal places.
Standard errors for social transmission parameters, s and other predictors could not be reliably obtained due to highly asymmetrical profile likelihoods for one or more parameters. This also makes standard errors a misleading measure of precision, e.g., for s parameters there can often be a large amount of information about the lower limit but very little information about the upper limit. Therefore, we derived 95% confidence intervals for parameters using profile likelihood techniques67 based on the best predictive model that included a given parameter.
To evaluate whether the effects of social transmission on recruitment and reactivation may have depended on interactions between networks, we adopted the following procedure. For each NBDA, we first constructed a model that included all variables for which Σwi > 0.5. For instance, in the Recruitment NBDA, this model included only the dance network and an effect of the number of return visits to the EMPTY feeder on the rate of social transmission. This model was then compared to alternative models that included that same set of variables along with one or more additional network effects; these could include both interactions between networks, as well as non-interactive network effects. Interaction effects were estimated as the social transmission parameter for a network that was obtained by multiplying together the adjacency matrices for the networks of interest. Models that included an interaction effect also included both of the constituent networks making up that interaction (left( {rm{e.g.},s_{{mathrm{Dance}}} + s_{{mathrm{Trophallaxis}}} + s_{{mathrm{Dance}} ast {mathrm{Trophallaxis}}}} right)). Model support was compared on the basis of AICc.
All analyses were conducted in R (https://www.r-project.org/) using the NBDA package ver. 0.8.468.
Reporting summary
Further information on research design is available in the Nature Research Reporting Summary linked to this article.
Source: Ecology - nature.com
