Diurnal variation in I. rubescens leaf photosynthesis
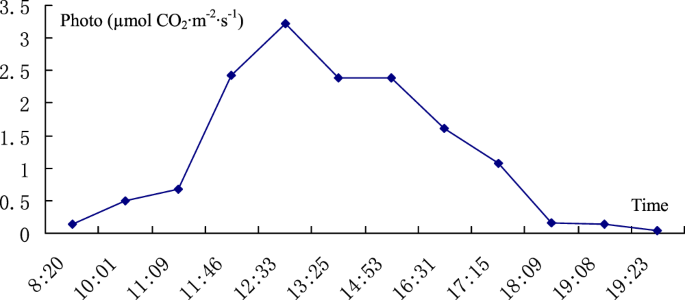
The results of the diurnal variation in I. rubescens leaf photosynthesis are shown in Table 1. Based on the collected data, the curve of the diurnal variation in I. rubescens leaf photosynthesis is shown in Fig. 1.

Diurnal variation in I. rubescens leaf photosynthesis.
The diurnal variation in I. rubescens leaf photosynthesis indicates that there was no obvious midday depression of photosynthesis. There is still a high net photosynthetic rate in I. rubescens leaves at noon with high light intensity. Leaves of I. rubescens can utilize very faint light, e.g., with a 20 µmol·m−2·s−1 intensity. The leaves of I. rubescens can photosynthesize even in the faint light of evening.
Light response curve of I. rubescens leaves
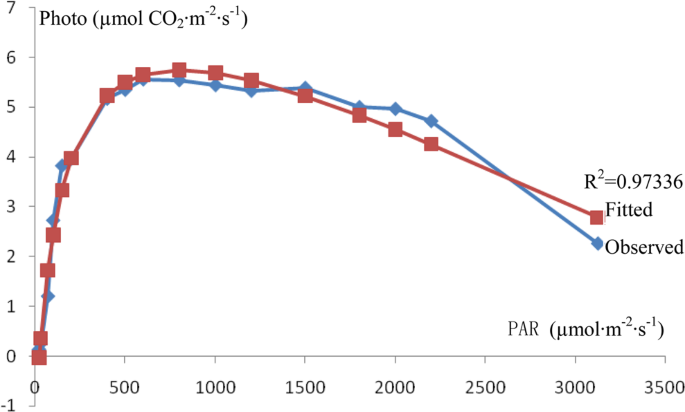
The data from the light response curve of I. rubescens leaf photosynthesis are shown in Table 2. Based on the collected data, the curve of the light response of I. rubescens leaf photosynthesis is shown in Fig. 2.

Light response curve of I. rubescens leaf photosynthesis.
The light response curve of I. rubescens leaf photosynthesis indicates that the net photosynthetic rate was obviously related to the light intensity when the light intensity was low. The net photosynthetic rate of I. rubescens leaves rapidly increased as the light intensity increased from 20–400 µmol·m−2·s−1. I. rubescens leaves were able to utilize intense light. With light intensities of 400–2200 µmol·m−2·s−1, the net photosynthetic rate of I. rubescens leaves was high. However, the net photosynthetic rate of I. rubescens leaves obviously decreased when the light intensity was above 2200 µmol·m−2·s−1.
The results of the light response curve fitted with the modified rectangular hyperbola model are shown in Table 2. The fitted light saturation point and the net photosynthetic rate at this point were very similar to the observed value.
CO2 response curve of I. rubescens leaves
The CO2 response curve data of I. rubescens leaf photosynthesis are shown in Table 3.
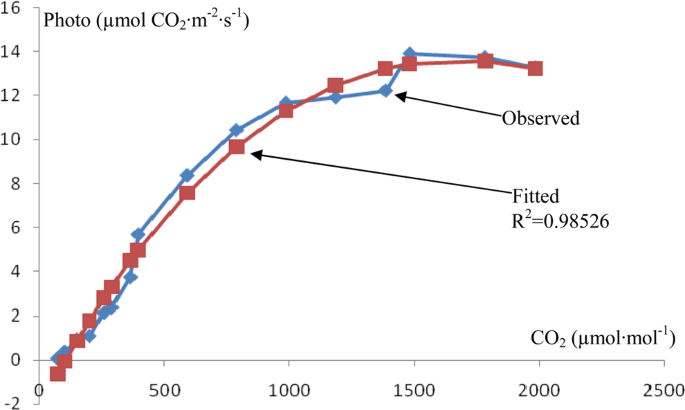
Based on the collected data, the curve of the CO2 response of I. rubescens leaf photosynthesis is shown in Fig. 3.

CO2 response curve of I. rubescens leaf photosynthesis.
The CO2 response curve of I. rubescens leaf photosynthesis indicates that the net photosynthetic rate was obviously related to the concentration of CO2 in the air when the CO2 concentration was below 1000 µmol·mol−1. However, the effect of the CO2 concentration on the net photosynthetic rate was not obvious when the concentration of CO2 was above 1000 µmol·mol−1.
The results of the CO2 response curve fitted with the modified rectangular hyperbola model are shown in Table 3. The fitted CO2 saturation point and the net photosynthetic rate at this point were very similar to the observed value.
Chlorophyll fluorescence characteristics of I. rubescens leaves
The results of the slow kinetics of chlorophyll fluorescence are shown in Table 4.
The slow kinetics of chlorophyll fluorescence of I. rubescens leaves indicates that the maximal photochemical efficiency of photosystem II ((Fm-Fo)/Fm) in I. rubescens leaves reached 0.7. The electron transport rate of photosystem II in I. rubescens leaves reached 20 μmol electrons/(m2·s). The fraction of energy dissipated as heat via the regulated photoprotective NPQ mechanism (Y(NPQ)) was much more than that passively dissipated in the form of heat and fluorescence (Y(NO)).
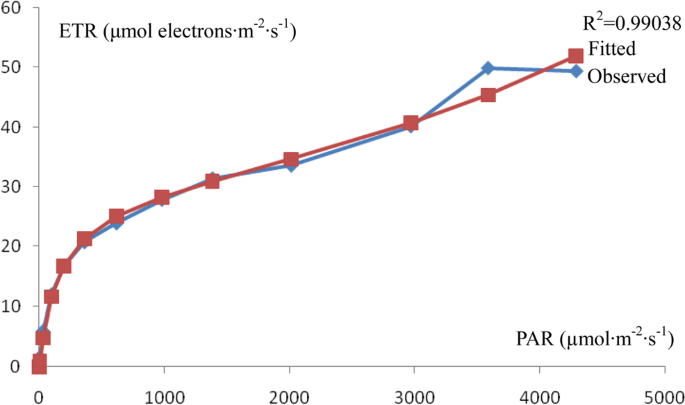
The results of the rapid light curves of chlorophyll fluorescence in I. rubescens leaves are shown in Table 5. The rapid light curve of chlorophyll fluorescence in I. rubescens leaves is shown in Fig. 4.

Rapid light curve of chlorophyll fluorescence in I. rubescens leaves.
The rapid light curve of chlorophyll fluorescence in I. rubescens leaves was automatically fitted with a PAM-2500 portable chlorophyll fluorescence apparatus according to the model of Eilers and Peeters [5]. The fitted results are shown in Table 5.
The rapid light curve of chlorophyll fluorescence in I. rubescens leaves indicates that the maximum quantum yield of PSII with a saturated pulse after dark adaptation (Fv’/Fm’ x ETR factor/2) was higher than the effective quantum yield of PSII (Y(II)). The initial slope (alpha) signifying the maximum photosynthetic efficiency was higher than the apparent quantum yield fitted in the light response curve of I. rubescens leaves.
Source: Ecology - nature.com


