Experimental materials
Four-year-old seedlings of P. sepium Bunge, a dominant shrub species that grows on the shell ridges of the Yellow River Delta, were selected as experimental materials. The P. sepium Bunge seedlings were uniformly cut to prepare samples that had a height of 1.18 ± 0.13 m, a rhizome thickness of 1.25 ± 0.06 cm and a root depth of 11.2 ± 0.3 cm. The seedling samples were subsequently trimmed such that the canopy size was 0.4 m (east–west) × 0.4 m (south–north).
Experimental design
This experiment was conducted in the Scientific Research Greenhouse (SRG) of the Shandong Key Laboratory of Eco-Environmental Science for the Yellow River Delta. Shell sand was collected from the area of the P. sepium Bunge community in the Binzhou National Shell Ridge and Wetland Nature Reserve. The collected shell sand was sieved through a 2.0 mm mesh and was subsequently transferred to a pot (diameter of the top, 40 cm; height, 50 cm). The basic chemical and physical properties of the shell sand were as follows: field capacity, 18.31%; bulk density, 1.29 g·cm−3; particle size, 0.2–2.0 mm; pH, 7.40; and salt content, 0.1%–0.4%. The primary environmental conditions of the SRG included the following: illumination intensity, 80%–84% of the natural external light intensity relative air humidity, 45%–65%; temperature, 20–35 °C; and atmospheric CO2 concentration, 350–370 μmol·mol−1.
The seedlings were planted in a total of 24 pots (three seedlings per pot) in the SRG on March 13, 2018, after which they were subjected to normal plant management practices for approximately 90 d. On June 15, 2018, the seedlings received one of four water treatments. The seedlings were randomly divided into four groups, with each group comprising six pots of seedlings. One of the four groups was selected as a CK (RWC of the shell sand: 77.72%). The remaining three groups were subjected to mild (RWC of the shell sand: 58.16%), moderate (RWC of the shell sand: 42.98%), or severe (RWC of the shell sand: 32.39%) drought stress treatments, which are referred to as the T1, T2, and T3 groups, respectively. The pots in the CK, T1, and T2 groups were watered once every 3 days with 4, 2, and 1 L of water, respectively. The pots in the T3 group were not watered. The RWC of the shell sand was calculated as the ratio of the water content of the shell sand to its field capacity, by weight. The RWC of the shell sand was monitored and controlled by weighing the pot and drying. A tray was placed underneath each pot to prevent water loss, thereby controlling the designed water treatment and ensuring experimental accuracy. Each group of seedlings was allowed to adapt to the water treatment for approximately 30 d. Afterward, from July 16 to July 23, 2018, the P. sepium Bunge seedlings were measured to determine the physiological photosynthesis indices and the chlorophyll fluorescence parameters of their leaves as well as their physiological and biochemical indices and stem sap flow parameters.
Measurement of physiological photosynthesis indices
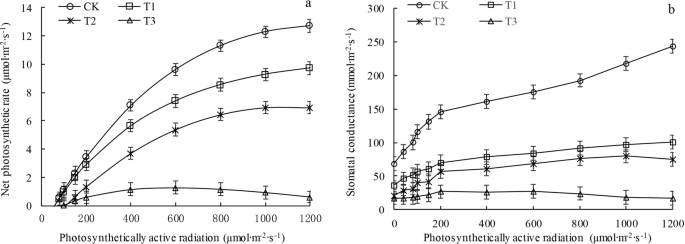
The experiment was conducted from 9:00 to 11:30 on a sunny day. Three pots of P. sepium Bunge seedlings were randomly selected from each group as experimental samples. Three healthy, mature leaves were then selected from the middle-upper section of the seedlings in each pot. An LI-6400XT portable photosynthesis system (LI-COR, Inc., Lincoln, NE, USA) was used to measure the light response of the plants. A standard 6400-02B red and blue light-source leaf chamber was used. Photosynthetically active radiation (PAR) was subsequently applied at 0, 40, 80, 100, 150, 200, 400, 600, 800, 1000, and 1200 µmol∙m−2 ∙ s−1, for a total of 11 illumination intensities. During the measurements, the PAR was decreased from the greatest level to the lowest level, with each level maintained for 120 s; these measurements were repeated three times. The instrument automatically recorded and calculated various physiological photosynthesis indices, such as the Pn, transpiration rate (Tr), Gs, and WUE (WUE = Pn/Tr).
Measurements of chlorophyll fluorescence parameters
An FMS-2 portable pulse-modulated fluorometer (Hansatech Instruments, Ltd., UK) was used to measure the chlorophyll fluorescence parameters of the P. sepium Bunge leaf samples as well as their photosynthesis indices. After the leaves were dark adapted for 30 min, the F0 and the maximum fluorescence (Fm) of each leaf were measured. Subsequently, after each leaf was dark adapted to natural light for 50 min, it was measured to determine its steady-state and maximum fluorescence under light-adapted conditions (Fs and Fm′). Additionally, the potential photochemical efficiency (Fv/Fm = (Fm − F0)/Fm), actual photochemical efficiency (ΦPSII = (Fm′ − Fs)/Fm′), noncyclic photosynthetic electron transport rate (ETR = ΦPSII × PAR × 0.5 × 0.84, where 0.5 is the partition coefficient between the two photosystems and 0.84 is the proportion of the amount of light absorbed by the leaf to the amount of incident light), and NPQ ((Fm − Fm′)/Fm′) were calculated47.
Measurements of physiological and biochemical indices
To measure physiological and biochemical indices, five to seven leaves were collected from the same section of each seedling from which the leaves were collected to measure and analyze the photosynthesis parameters48. The SOD activity was measured via nitro blue tetrazolium photoreduction, and the POD activity was measured via guaiacol colorimetry. In addition, the Pro content was determined via ninhydrin colorimetry, and the Ss content was determined according to the anthrone coloration method. Last, the MDA content was measured via thiobarbituric acid colorimetry.
Measurements of stem sap flow parameters
A Flow 32 heat-balance stem sap flow measurement system (Dynamax, Houston, TX, USA) was used to measure the P. sepium Bunge seedling stem sap flow rate and daily stem sap flow continuously. On the basis of the stem thickness for each P. sepium Bunge seedling selected for testing, an SGA-5 sensor with a suitable diameter (5–7 mm) was selected. The stem sap flow measurement system was installed according to the standard instructions provided by Dynamax. A Delta-T Logger data acquisition system was used to collect and record the instantaneous stem sap flow rates automatically at 30 min intervals.
Statistical analysis
A rectangular hyperbolic correction model49 was used to simulate the PAR–Pn photosynthesis light-response process. Equation (1) shows the expression of the model as follows:
$${P}_{n}=alpha frac{1-beta I}{1+gamma I}(I-{I}_{c})$$
(1)
Here, Pn is the net photosynthesis rate; I is the PAR; Ic is the LCP; and α, β, and γ are three coefficients unrelated to the light intensity (α is the initial slope of the light-response curve when the PAR is 0, which is considered the AQY, and β and γ are biological important photoinhibition and photosaturation terms, respectively).
On the basis of Eq. (1), three photosynthesis parameters, namely, Rd, LSP, and Pmax, can be derived, as shown in Eqs. (2)–(4).
$${{R}}_{{d}}={P}({I}=0)=-,alpha {{I}}_{{c}}$$
(2)
$${I}_{m}=frac{-1+sqrt{frac{(beta +gamma )(1+gamma {I}_{c})}{beta }}}{gamma }$$
(3)
where Im is the LSP.
$${P}_{n}({I}_{m})=alpha frac{1-beta {I}_{m}}{1+gamma {I}_{m}}({I}_{m}-{I}_{C})$$
(4)
where Pn(Im) is equal to Pmax.
The data were processed and plotted in Microsoft Excel 2016. Correlation analysis, analysis of variance, and multiple comparisons of the data were performed by SPSS 19.0.
Source: Ecology - nature.com
