Study area
The study area is the central Hunan hilly soil conservation and living environmental protection section (V-4-6-tr), which is one of the 117 sections in the soil and water conservation regionalization scheme, and belongs to the secondary regionalization south Yangtze River hilly subregion (V-4), with the primary regionalization being the South China red soil region (V). The study area is approximately 86,453 km2 and contains 58 administrative countries (Fig. 1). The tertiary hierarchy functional region has a subtropical humid monsoon climate. The annual precipitation is 1217–2252 mm. The Anhua and Taojiang counties are the rainstorm centers, and the precipitation is over 1600 mm, while the precipitation is low in the Hengyang Basin at approximately 1200 mm. The terrain is high in the east, west and south, with the Luoxiao Mountains and Xuefeng Mountains. The center of this area is hills and plains. The relative height is approxomately 2000 m. The central part of this area is covered by fertile plain, abundant precipitation, extensive solar energy, and vast territory, which is suitable for the agricultural development and is the reason for the high agricultural commodity rate in the area, and the economy is developed. This tertiary hierarchy functional region is one of the areas that suffers suffer severe soil erosion in the South China red soil region. At present, the area of soil erosion is 157217.10 km2, accounting for 17.6% of this tertiary hierarchy functional region. The study area is dominated by both light and moderate soil erosion, covering approximately 72.54% and 19.88%, respectively.
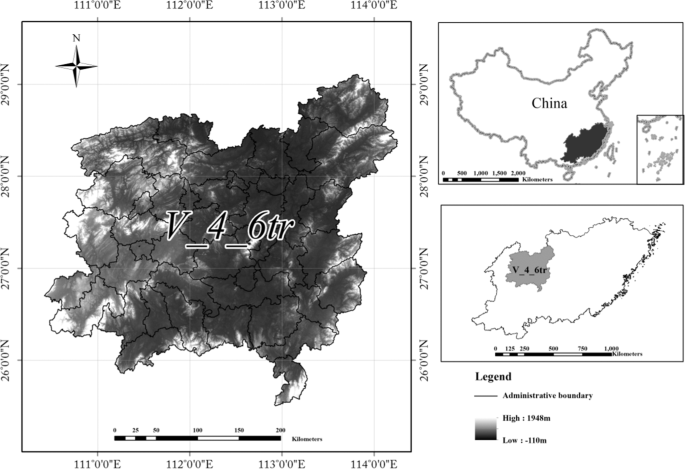
Location Map of the Central Hunan hilly soil conservation and living environmental protection section. Map generated using the ArcGIS 10.5 software (ESRI Inc., California, USA. URL: http://www.esri.com/software/arcgis/arcgis-for-desktop). (Source of data: Scheme of soil and water conservation regionalization in China).
Data source
The data used in this research mainly cover geomorphological and socioeconomic aspects, land use and soil loss. Geomorphological data were acquired from a digital elevation model (DEM) by GIS, and the resolution of the DEM was 30 m. The socioeconomic data were obtained from the statistical yearbook of Hunan Province and government websites of various counties. This paper used the average value of ten years from 2006 to 2016 for analysis. Land-use type data were mainly interpreted by a human-computer interactive visual interpretation based on the Landsat-8 land use/cover thematic data from 2015.
Regionalization method
Based on previous studies and aimed at the shortcomings of the current indicator system for soil and water conservation regionalization, this paper constructed a new indicator system composed of soil erosion risk, soil erosion intensity and ecosystem service function and included 19 factors. In addition to the correlation with soil erosion, the relative independence of each index and the representativeness of the index were also considered16. The risk of soil erosion reflects the combined influence of nature and humans. The landform is the internal factor that leads to soil erosion.
The complexity of terrain and the diversity of climate lead to differences in soil erosion risk between different regions17. Surface fluctuations, gully density, annual average rainfall and vegetation coverage rate were selected to reflect the differences in the natural environment of the region. Surface fluctuation refers to the distance between the highest and lowest elevations in a region. The terrain of the research area is high on the periphery and low in the middle region, and the relative altitude is approximately 1,964 m. The large topographic relief promotes soil erosion. Gully density is closely related to regional topography, slope, precipitation, runoff characteristics, soil erosion resistance, etc., and can be a measurement of the degree of surface fragmentation; these characteristic are of great importance to soil erosion monitoring and planning18. Rainfall is an important inducing factor of soil erosion19. Vegetation can buffer the scour of rainfall and enhance the stability of surface materials. The effect of development on soil erosion is bidirectional. On the one hand, development promotes soil erosion; on the other hand, it serves as the economic foundation for soil and water conservation efforts. This paper reflects the difference in regional development by using population density, urbanization rate and per capita GDP. At the same time, the change in land use type also leads to changes in natural phenomena and ecological processes20, directly affecting the ecosystem and the well-being of the lifelong resident21. The percentages of cultivated and construction lands were selected to reflect the impacts of land use type. The differences in landform and soil and water conservation abilities lead to differential risks of soil erosion is different in different regions.
Soil erosion has led to a plethora of environmental problems. For example, the soil layer has become thin, soil nutrients have decreased, and the adaptability of land use has been altered22. The intensity of soil erosion reflects the status of regional soil erosion, which has a great influence on determining the personnel and funding investments the distribution of soil and water conservation measures. This factor reflects the current situation of soil erosion in different evaluation units by the ratio of five different erosion grades: light, moderate, intense, extremely intense, and drastic. The classification of soil erosion grades is based on China’s current classification standards, that is, the “standards for classification and gradation of soil erosion” (SL 190–2007) issued by the People’s Republic of China Water Conservancy Industry Standard23.
Ecosystem services ensure that people obtain benefits directly or indirectly from the ecosystem14,20,22,24. Ecosystem service functions are vital for human survival and are formed by ecosystems and ecological processes. On this basis and aimed at the problems of soil and water conservation, some researchers have put forward the concept of soil and water conservation ecosystem service functions which include water conservation, soil conservation, biodiversity maintenance, carbon sequestration, air purification, and human settlement environment maintenance25,26. Soil erosion is a collective reflection of ecological degradation. Ecosystems have self-recovery ability, which are related to the species diversity, structure and function of the ecosystem27,28. The degradation of ecosystems undermines ecosystem functioning and resilience, thus threatening the ability of the ecosystem to provide ecosystem services29, such as regulating the atmosphere, maintaining biodiversity, and maintaining soil fertility30. Ecosystem service values reflect the goods and services that ecosystems provide to humans24. Thus, to a certain extent, the value of ecosystem services can reflect the self-repair capacity of the ecosystem. The assessment of the value of ecosystem services is an important tool to encourage policy makers to pay more attention to the ecosystem. Therefore, taking the value of the ecosystem service function as a factor of regionalization, it is necessary to consider the value of ecosystem service functions in zoning. In this paper, the total value of ecosystem services in the central Hunan hilly soil conservation and living environmental protection section is evaluated by five factors: soil conservation, biodiversity maintenance, nutrient cycling maintenance, environmental purification, and hydrological regulation. At present, there are many methods to assess the value of ecosystem services. The equivalent factor method proposed by Xie can achieve the rapid valuation of ecosystem services and has been used by many scholars to assess the value of ecosystem services31,32,33,34. The equivalent factor of the standard unit system refers to the economic value of food produced by a hectare of farmland, then this value is taken as a reference, and is combined with expert knowledge to determine the equivalent factors for other ecosystem services35,36,37. This method is suitable for the study region and avoids problems such as difficulties in data collection.
Then, the main factors affecting the prevention and control of soil erosion in this area are screened according to local environmental conditions. Finally, an indicator system for the subregion of tertiary soil and water conservation regionalization is constructed (Table 1).
The entropy method is an objective weighting method. Entropy is a measure of uncertainty and is consistent with uncertainty. Entropy can be used to determine the degree of dispersion of an index. If the degree of dispersion is large, the weight of the index will be correspondingly large. This method has been widely used in model evaluation38. The entropy method is used to determine the weight of each index in this paper (Table 1). Then, we can obtain the values of three elements.
The soil erosion risk is calculated as:
$${I}_{e}=mathop{sum }limits_{i=1}^{N}{W}_{i}{P}_{i}$$
(1)
where Ie represents the index of soil erosion risk. N is the number of factors. Pi and Wi represent the value and weight of the index, respectively.
The Chinese soil loss equation (CSLE)39 was used to calculate the soil loss in the study area in 2015, as this equation is suited to the Chinese national condition, and the model can reflect the impact of soil and water conservation measures on soil erosion. The CSLE model can be expressed as follows:
$${rm{M}}={rm{R}}times {rm{K}}times {rm{LS}}times {rm{B}}times {rm{E}}times {rm{T}}$$
(2)
where M is the average soil loss per unit area by erosion (t hm−2 a−1), R is the rainfall erosivity factor (MJ mm hm−2 h−1 a−1), K is the soil erodibility factor ((t hm2 h hm−2 MJ−1 mm−1), LS is the slope length and slope factor (dimensionless), B is the biological measure factor (dimensionless), E is the engineering measure factor (dimensionless), and T is the cultivation measures factor (dimensionless).
The rainfall erosivity factor is calculated based on measured data from 298 weather stations40 (Eq. 3). Soil erodibility factors are calculated using the erosion-productivity impact calculator (EPIC) model41 based on data from the second soil census in China (Eq. 4). The slope and slope length factors are calculated using the formula of the general soil loss equation42 (Eq. 5).The CSLE contains three soil and water conservation measures factors43. The biological measure factor is based on land use data and vegetation cover data (Table 2). The engineering measures factor is based on the data of the soil and water conservation bulletins in China’s provinces. The engineering measures we mainly considered in this paper are terraces (Eq. 6). The factors of farming measures are obtained by using the data from the Chinese agricultural zoning map and the soil and the assignment data of the water conservation engineering measures factor.
$${rm{R}}=mathop{sum }limits_{i=1}^{12}(,-,1.5527+0.1792{P}_{i})$$
(3)
$$begin{array}{c}{rm{K}}=0.1317{0.2+0.3exp,[-0.0256SAN(1-frac{SIL}{100})]}ast {(frac{SIL}{CLA-SIL})}^{0.3} ast (1-frac{0.25C}{C+exp (3.72-0.95C)})ast (1-frac{0.7SNI}{SNI+exp (-5.51+22.9SNI)})end{array}$$
(4)
$${rm{LS}}={(frac{L}{72.6})}^{m}ast (65.41,sin ,theta +4.56,sin ,theta +0.065)$$
(5)
$${rm{E}}=frac{[({S}_{T}ast {E}_{T})+({S}_{G}-{S}_{T})]}{{S}_{G}}$$
(6)
where Pi is the rainfall in month i. SAN, SIL, CLA and C are the contents of sand, silt, clay and organic carbon, respectively. The sizes of SAN, SIL and CLA are 0.050–2.00 mm, 0.002–0.050 mm, and <0.002 mm, respectively. SNI = −SN/100. L is the slope length. θ is the slope, and m is the index of slope length (Eq. 9), which varies with the slope (Eq. 6). T is the terrace. G is the tillage measure.
$${rm{m}}={begin{array}{r}0.2,theta < 0.57^circ 0.3,0.57^circ le theta < 1.72^circ 0.4,,1.72^circ le theta < 2.86^circ 0.5,2.86^circ le theta end{array}$$
(7)
The classification of soil erosion intensity is divided according to the soil erosion intensity grading standard (SL19-2007) based on the soil loss per unit area every year. Then the soil erosion intensity index can be calculated as:
$${rm{E}}=mathop{sum }limits_{i=1}^{N}{{C}_{i}}^{{A}_{i}}/S$$
(8)
where E represents the comprehensive index of soil erosion; N is the number of factors; Ci represents the weight of erosion intensity; Ai represents the area of soil erosion in the evaluation unit; and S represents the total area of the study region.
The ecosystem service value is calculated as:
$${rm{S}}=mathop{sum }limits_{i=1}^{N}{W}_{i}{P}_{i}$$
(9)
where, S represents the ecosystem service functional value; N is the number of factors; Wi and Pi represent the weight and value of ecosystem functions. The calculation of ecosystem services value is based on the combination of land use data and the ecosystem services value equivalent factor table36.
At present, the combination of the analytic hierarchy process (AHP) method and layer overlay analysis is widely used for the determination of weights and regionalization3,44,45. The AHP method is a widely used method to calculate the weights of synthetic assessment indexes16, and it is a combined qualitative and quantitative hierarchical weight analysis method46. This paper used the AHP method to determine the weight of soil erosion risk, soil erosion intensity and the ecosystem service function (Table 3). The layer overlay analysis method can obtain new properties and relationships by stacking multiple layers of spatial data. The results of the regionalization obtained by this method are intuitive and reliable. First, with the support of GIS, we drew the distribution maps of the three elements, namely, soil erosion risk, soil erosion intensity and ecosystem service value (Fig. 2). Then, based on the spatial overlay technology of GIS, an arithmetic expression was constructed based on the weights of the elements obtained by the AHP method and was used to create the conditional layer overlay for each element layer. With the reclassification in GIS, the preliminary regionalization map of the center Hunan hilly soil conservation and living environmental protection section was obtained. The principle of the natural breaks method based on the principle of minimal intragroup differences and maximum intergroup differences was used to grade47. Finally, the quantitative regionalization results were adjusted appropriately according to the actual regional development planning and expert opinion. This paper obtained the schemes for subregions of tertiary soil and water conservation regionalization with the new indicator system (Fig. 3).
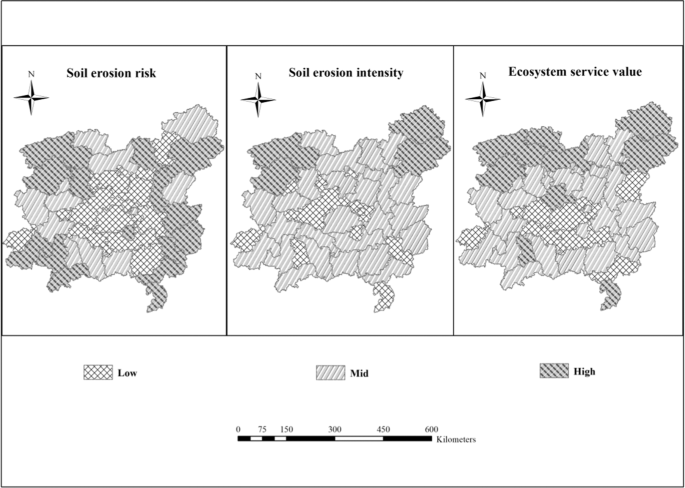
Classification results of three elements. Map generated using the ArcGIS 10.5 software (ESRI Inc., California, USA. URL: http://www.esri.com/software/arcgis/arcgis-for-desktop).
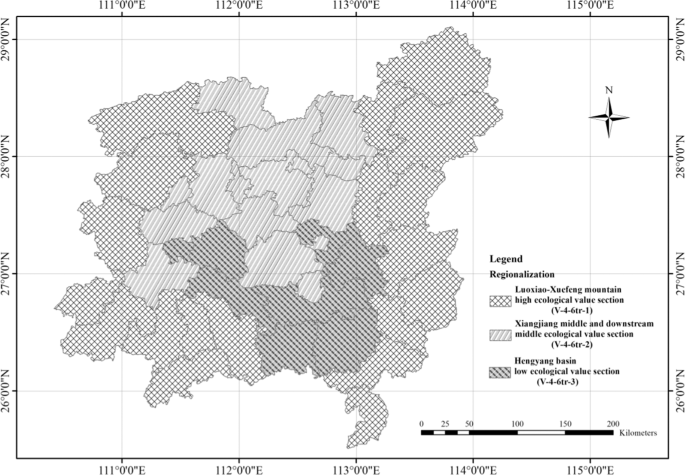
Regionalization Map of soil and water conservation in central Hunan hilly soil conservation and living environmental protection section. Map generated using the ArcGIS 10.5 software (ESRI Inc., California, USA. URL: http://www.esri.com/software/arcgis/arcgis-for-desktop).
Source: Ecology - nature.com
