Experimental conditions
Dissolved oxygen (DO) and pH levels were stable around our treatment levels throughout ten rounds of experiments for Experiment 1 (max SD for DO: 0.04, max SD for pH: 0.02) and the nine rounds for Experiment 2 (max SD for DO: 0.05, max SD for pH: 0.02) (Table 1). Temperature was not directly controlled by the system and was subject to changes in seasonal conditions while experiments were run (range across all rounds for Experiment 1 (November 2016 to October 2017): 13–17.5 °C; range across all rounds for Experiment 2 (February to May 2018): 10.5–15 °C); however, within each round, temperature was consistent across treatments (Table 1; Mean Temperature) and did not fluctuate more than 1 °C within a treatment (see Methods for details on how temperature was addressed in analyses).
Experiment 1
We compared maximum daily per capita interaction strength (PCIS, proportion of juvenile kelp removed, individual−1 m−2 day−1; ‘maximum’ because there was no competition, no influx of new M. pyrifera juveniles, and one prey type offered) across four common kelp forest species: brown turban snail (Tegula brunnea), purple urchin (Strongylocentrotus purpuratus), kelp isopod (Idotea resecata), and kelp curler amphipod (Peramphithoe humeralis). We found that grazing can be a significant source of mortality for juvenile kelp and that species vary widely in their per capita interaction strength. T. brunnea had the strongest daily maximum PCIS with juvenile M. pyrifera, consuming at least quadruple the amount of kelp than any of the other species under control conditions. Its PCIS was −0.0126 ± 0.0011 SE, which is equivalent to an average of 1.26% juvenile kelp consumed individual−1 m−2 day−1 (I. resecata: −0.0026 ± 0.0003 SE, S. purpuratus: −0.0013 ± 0.0002 SE, and P. humeralis: −0.0011 ± 0.0001 SE) (Fig. 1).
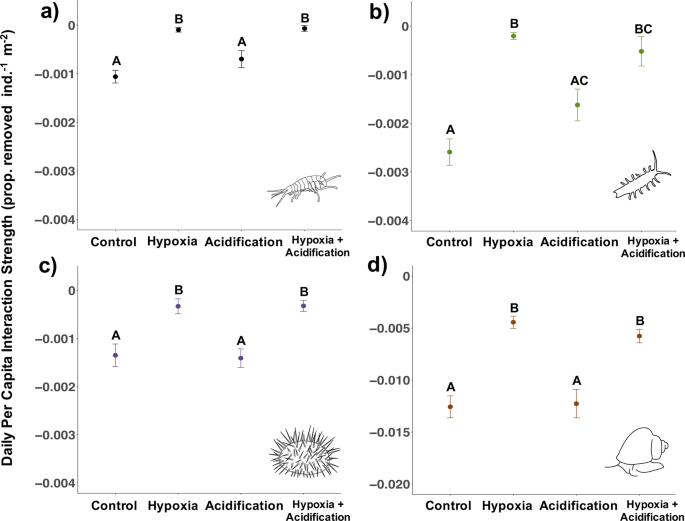
Experiment 1 (hypoxia: 2.0 mg/L; acidification: pH 7.60). Daily per capita interaction strength (PCIS) for P. humeralis (a), I. resecata (b), S. purpuratus (c), and T. brunnea (d, note change in y axis range) measured in laboratory experiments. Data show means ± SE for all individuals across 10 rounds in Experiment 1 (n = 20 individuals species−1 treatment−1). More negative values indicate greater interaction strengths. Letters indicate a significant difference (p < 0.05) in PCIS under the different treatment groups based on multiple-comparison procedures.
Per capita interaction strength differed significantly across treatment groups (P. humeralis: F(4,75) = 15.3, p < 0.001; I. resecata: F(3,35) = 27.80, p < 0.001; T. brunnea: F(3,41) = 20.88, p < 0.001; S. purpuratus: F(3,41) = 11.75, p < 0.001). Specifically, all four species exhibited a similar pattern of significant weakening in interaction strength under hypoxia (2.0 mg/L) but not acidification (7.60) (P. humeralis Control:Hypoxia: t-ratio = −6.05, df = 75, p < 0.001, Control:Acidification: t-ratio = −2.20, df = 75, p = 0.13; I. resecata Control:Hypoxia: t = 8.50, df = 22, p < 0.001, Control:Acidification: t = 2.30, df = 37, p = 0.12; T. brunnea Control:Hypoxia: t = 6.74, df = 30, p < 0.001, Control:Acidification: t = 0.17, df = 36, p = 0.99; S. purpuratus Control:Hypoxia: t = 3.62, df = 33, p = 0.005, Control:Acidification: t = 0.19, df = 37, p = 0.99) (Fig. 1). In addition, none of the species except for I. resecata showed any interaction between pH and oxygen (p > 0.05; I. resecata interaction estimate = −0.0026 ± 0.001 SE, t = −2.43, p = 0.02). Further, the response in the the hypoxia + acidification treatment was the same as the response in the hypoxia only treatment (Fig. 1), which shows that at least over short timeframes (days), hypoxia was the dominant stressor over acidification31. Despite a range in temperature across the rounds (13–17.5 °C), there was no effect of temperature on PCIS across rounds for any species except P. humeralis (P. humeralis temperature estimate = −0.0002 ± 0.00009 SE, t = −2.35, p = 0.02), further suggesting that low DO pulses may drive a weakening of interaction strengths over a range of temperatures, including the relatively warm temperatures reached in Experiment 1.
Similar to species-specific differences in PCIS, we saw variations in species tolerances to DO and pH conditions. Crustaceans were more vulnerable to low oxygen than the snail and the urchin. P. humeralis died in three of the treatments (1 in acidification, 14 in hypoxia, and 12 in hypoxia + acidification out of 20 individuals/treatment), and I. resecata individuals died in two of the treatments (4 in hypoxia, 6 in hypoxia + acidification out of 20 individuals/treatment). There was no mortality of T. brunnea or S. purpuratus in any of the treatments.
Experiment 2
Based on Experiment 1, where effects of hypoxia were stronger than those of acidification, we conducted a second set of experiments to test whether effects of hypoxia were stronger than effects of future projected pH (7.40) (Table 1). Under this pH level, hypoxia continued to dominate acidification and significantly weakened interaction strength (P. humeralis Control:Hypoxia: t = 8.13, df = 17, p < 0.001, Control:Acidification: t = 0.53, df = 23, p = 0.95; I. resecata Control:Hypoxia: t = 9.73, df = 17, p < 0.001, Control:Acidification: t = 1.06, df = 30, p = 0.71; T. brunnea Control:Hypoxia: t = 3.05, df = 24, p = 0.03, Control:Acidification: t = 0.39, df = 26, p = 0.98; S. purpuratus Control:Hypoxia: t = 4.72, df = 19, p < 0.001, Control:Acidification: t = 0.64, df = 30, p = 0.92) (Fig. 2). Even with a decrease in 0.2 pH units and 1.5 times the amount of pCO2 compared to levels in Experiment 1, grazers exhibited no impact of acidification, though if grazers experienced lower pH or more prolonged low pH conditions, acidification may have impacted their feeding behaviour.
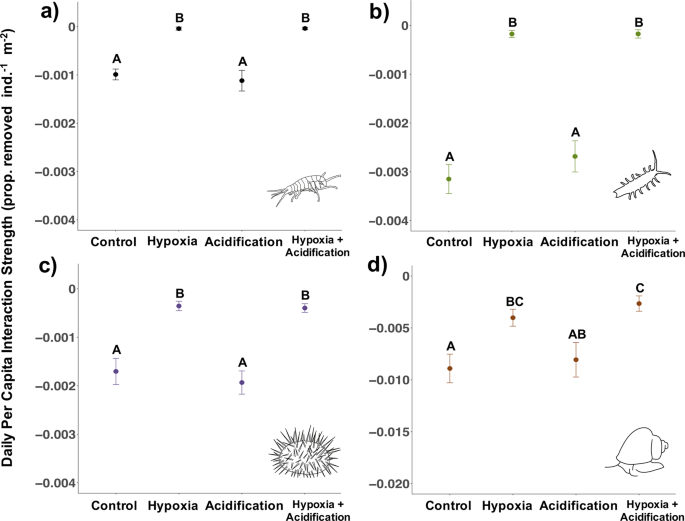
Experiment 2 (hypoxia: 2.0 mg/L; severe acidification: pH 7.40). Daily per capita interaction strength (PCIS) for P. humeralis (a), I. resecata (b), S. purpuratus (c), and T. brunnea (d, note change in y axis range) measured in laboratory experiments. Data show means ± SE for all individuals across 9 rounds in Experiment 2 (n = 16 individuals species−1 treatment−1 for P. humeralis, I. resecata, and S. purpuratus; for T. brunnea, n = 14 individuals for acidification treatment, n = 15 for hypoxia treatment, n=16 for control and hypoxia + acidification treatment). More negative values indicate greater interaction strengths. Letters indicate a significant difference (p < 0.05) in PCIS under the different treatment groups based on multiple-comparison procedures.
Overall, Experiment 2 again showed that crustaceans may be more vulnerable to low oxygen, where P. humeralis died in three of the treatments (2 in acidification, 5 in hypoxia, and 9 in hypoxia + acidification out of 16 individuals/treatment), and four I. resecata individuals died in the hypoxia treatment. Similar to Experiment 1, none of the species showed an interaction between pH and oxygen nor a temperature effect, so, taken together, Experiment 2’s results once again strongly support the conclusion that effects of hypoxia were stronger than those of acidification at least in these short-term consumption experiments.
Grazer densities
T. brunnea had much higher field densities compared to S. purpuratus, with average densities 2–3 times higher than S. purpuratus densities in three of the four seasons. At its peak, T. brunnea reached 25.9 individuals/m2 in winter 2017, while S. purpuratus only reached 7.6 individuals/m2 in spring 2017 (Table 2). However, T. brunnea was also more variable throughout seasons with a low of 3.2 individuals/m2 on average in the summer (August) and a high of 8.7 individuals/m2 on average in the winter (February-early March) (Supplementary Table S1). Trapping yielded amphipods in the Peramphithoe genus during several collections throughout the two-year period (mean = 11.3 Peramphithoe individuals/m2). Literature-derived data showed that the average of I. resecata was 3.5 individuals/m2, whereas the P. humeralis density was much higher at 65.0 individuals/m2 (Table 2), potentially reflecting this species’ tendency to build nests and brood their young with individuals leaving for foraging bouts32.
Species’ impacts on juvenile M. pyrifera
By multiplying PCIS with grazer densities from field surveys and the literature, we extrapolated laboratory-derived PCIS to population level impacts on juvenile kelp. We found grazers can exert strong impacts on juvenile kelp populations, removing an estimated average of 15.4% of juvenile kelp in a square meter per day, equalling hundreds of thousands of individuals (Fig. 3b). At maximum densities (Table 2), we estimated grazers can collectively remove 73.9% of juvenile kelp in a square meter per day. T. brunnea has the largest species impact on M. pyrifera due to its relatively strong PCIS (Figs. 1, 2) and high natural densities (Table 2). Even though S. purpuratus was also found in relatively dense aggregations, taken together with laboratory PCIS, this species is a surprisingly weak interactor with juvenile kelp (Fig. 3a) and would need to be on average 13 times denser than T. brunnea to have comparable impacts. Despite having the weakest PCIS (Figs. 1, 2), P. humeralis had the highest average density (65.0 individuals/m2), bringing its daily impact on par with T. brunnea (Fig. 3b). However, impact for this species can be highly variable over small spatial scales with density estimates differing by orders of magnitude across the Monterey peninsula33 (personal observations), and this was likely the reason our traps did not capture this species specifically.
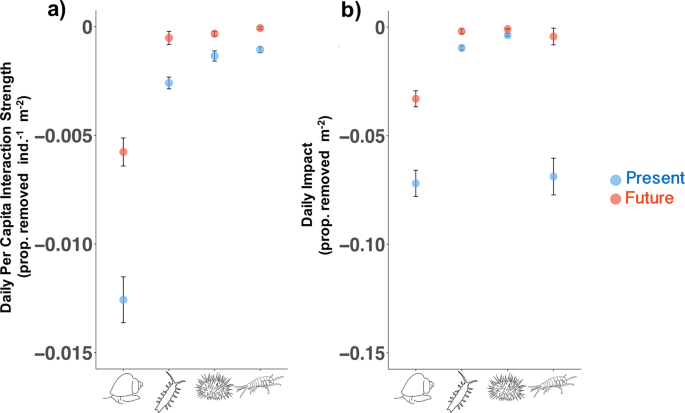
Per capita interaction strength (PCIS) from laboratory experiments compared with each species’ estimated impact on juvenile kelp populations. (a) Mean ± SE daily PCIS. PCIS values are taken from Experiment 1, and “Present” indicates PCIS in the control treatment, while “Future” indicates PCIS in the hypoxia + acidification treatment (same data as Fig. 1 but species are combined on one graph). (b) Mean ± SE daily grazing impact for the four species used in experiments (impact was calculated by multiply the mean density of each species by the upper and lower bounds of “Present” and “Future” PCIS in panel (a)). Density data are from transect surveys (T. brunnea and S. purpuratus) and the literature (I. resecata and P. humeralis).
Collective grazing impact is predicted to decrease threefold from a daily average of 15.4% to 4.0% of juvenile kelp removed/m2 (Fig. 3b) (or from 73.9% to 18.5% if maximum densities are considered) due to the species’ large reductions in grazing driven by acute hypoxia. Species-specific impacts are predicted to decrease in varying amounts from 54% in T. brunnea to 91% in P. humeralis. Even though T. brunnea’s consumption decreased by half under hypoxia, its predicted future impact still surpassed all the other species’ future impacts, and even surpassed S. purpuratus’ and I. resecata’s impacts in the present day (Fig. 3b). This suggests that T. brunnea may maintain its dominance as a consumer of juvenile giant kelp under anticipated future scenarios.
Source: Ecology - nature.com
