Updating the GDHY
The method and procedure used to provide grid-cell yield estimates for version 1.3 of the GDHY are fully described in our related work1. In short, the procedure consists of four key steps: (1) the country’s annual yield statistics were obtained from the Food and Agriculture Organization of the United Nations statistical database (FAOSTAT5); (2) the grid-cell net primary production (NPP) was calculated using the remotely sensed leaf area index (LAI), the fraction of photosynthetically active radiation (FPAR), reanalysis solar radiation and reported crop-specific radiation-use efficiency to consider the spatial variations in yields within a country; (3) the harvested area map (M3-Crops6) and crop calendars circa 2000 (SAGE7) were used to address where and when a crop of interest was grown; and (4) when the crop calendars indicated that a crop of interest was harvested twice in a year, the share of production amount by different cropping season of a crop available in the US Department of Agriculture (USDA) report8 was used to differentiate the yield estimates for different cropping seasons. Production-weighted mean, instead of arithmetic mean, is utilized when average yield from two cropping seasons with different production share is computed.
Some inputs used in the development of the version 1.3 dataset were different from those used in the version 1.2 dataset (Table 1). The major differences were found in the satellite products and reanalysis data. The LAI and FPAR inputs were changed from the GIMMS3g [Global Inventory Modeling and Mapping Studies third generation products from the AVHRR (Advanced Very High Resolution Radiometer)] products9 for the version 1.2, to the more advanced MOD15A2 products10 derived from the MODIS (Moderate Resolution Imaging Spectroradiometer) for the version 1.3. The spatial and temporal resolutions of the MOD12A2 products (1-km and 8-day, respectively) were finer than those of the GIMMS3g products (0.083° or 10-km and bi-monthly or 15-day), although the crop harvested area map with a spatial resolution of 10-km was commonly used for both versions 1.2 and 1.3. The daily solar radiation data were also changed from the 1.125°-resolution JRA-25 reanalysis11 for the version 1.2 to the 0.563°-resolution JRA-55 reanalysis12,13 for the version 1.3.
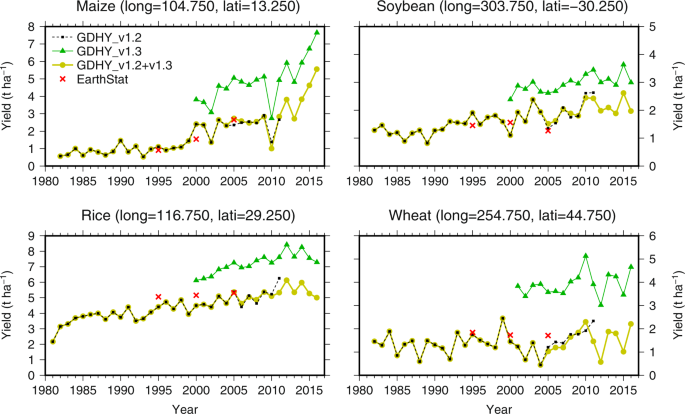
The GIMMS3g NDVI (normalized difference vegetation index) used in estimating the GIMMS3g LAI and FPAR were calibrated against the MODIS LAI and FPAR products for the period of 2000–2009 (ref. 9). Thus, the continuity of the LAI and FPAR time series at 10-km and 15-day scales was expected. However, the quality-checking of the GDHY version 1.3 dataset revealed persistent discontinuities in annual yield time series between versions 1.2 and 1.3 for some locations, despite the use of the calibrated GIMMS3g LAI and FPAR products (Fig. 1). Yields from the version 1.3 were almost always higher than those from the version 1.2. Addressing the exact reasons for the discontinuities is beyond the scope of this article. However, the different reanalysis solar radiation products between the two versions are one possible reason. And the different spatial resolutions of the satellite products used in versions 1.2 and 1.3 is another possible reason. The version 1.2 dataset uses average NPP over the 10-km grid cell, while the version 1.3 dataset uses the maximum NPP over the 1-km cropland grid cells located within a 10-km grid cell. To solve this problem and supply users a version of the GDHY with continuity, the two versions were aligned, as elaborated in the subsequent section.

Yield time series in the selected locations for different versions of the GDHY. Yield data obtained from version 1.2, version 1.3 and aligned version v1.2 + v1.3 are presented. Locations indicated by longitude and latitude were arbitrarily selected for explanatory purposes. Five-year average yields at three time points centered on 1995, 2000 and 2005 were obtained from the EarthStat dataset13 and are also shown for reference purposes.
Alignment
The two different versions of the GDHY described above were aligned according to the following procedure. First, in the version 1.2 dataset, the annual yield time series for a given location, crop and cropping season was decomposed into the linear combination of the yield trend component and the yield departure from the trend component:
$${Y}_{{rm{v}}1.2,t}={Y}_{{rm{v}}1.2,t}+{acute{Y}}_{{rm{v}}1.2,t},$$
(1)
where ({Y}_{{rm{v}}1.2,t}) indicates the annual yield in harvesting year t (t ha−1); ({Y}_{{rm{v}}1.2}) indicates the yield trend component or normal yield (t ha−1); and ({mathop{Y}limits^{Y}}_{{rm{v}}1.2}) indicates the yield anomaly that represents the yield departure from normal yield (t ha−1). The normal yield was calculated by applying the 5-year (t-4 to t) moving average method to the annual time series:
$${Y}_{{rm{v}}1.2,t}=frac{{sum }_{t-4}^{t},{Y}_{{rm{v}}1.2,t}}{5}.$$
(2)
The yield values in the version 1.3 dataset were also decomposed, as the version 1.2 dataset were processed (({Y}_{{rm{v}}1.3,t}={Y}_{{rm{v}}1.3,t}+{acute{Y}}_{{rm{v}}1.3,t}); and ({Y}_{{rm{v}}1.3,t}=frac{{sum }_{t-4}^{t}{Y}_{{rm{v}}1.3,t}}{5})).
Second, the two versions of the GDHY were combined into a single time series using the following rule:
$${Y}_{{rm{v}}1.2+{rm{v}}1.3,t}=left{begin{array}{ll}{Y}_{{rm{v}}1.2,t} & t=1981,ldots ,1999 {Y}_{{rm{v}}1.2,t}+frac{{mathop{Y}limits^{{prime} }}_{{rm{v}}1.2,t}+{mathop{Y}limits^{{prime} }}_{{rm{v}}1.3,t}}{2} & t=2000,ldots ,2010 left[{Y}_{{rm{v}}1.2,2010}+left({Y}_{{rm{v}}1.3,t}-{Y}_{{rm{v}}1.3,2010}right)right]+{mathop{Y}limits^{{prime} }}_{{rm{v}}1.3} & t=2011,ldots ,2016end{array}right..$$
(3)
For the period of 1981–1999, in which only the version 1.2 dataset is available, the yield values in the aligned version (({Y}_{{rm{v}}1.2+{rm{v}}1.3})) are equal to those of version 1.2. For the period of 2000–2010, both versions are available. The normal yields were taken from version 1.2, and the average yield anomalies across the two versions were added to the normal yields. For the remaining period (2011–2016), only version 1.3 is available. The yield anomalies were taken from version 1.3. In contrast, the normal yields were computed by adding the changes in the normal yields between 2010 and the target years (2011–2016), as computed based on version 1.3, to the normal yield in 2010 of version 1.2. When the alignment led to a negative value, the yield value was replaced with zero. By using this procedure, the two versions were harmonized into a single aligned version referred to as the GDHY version v1.2 + v1.3 dataset (Fig. 1).
Source: Ecology - nature.com


