Morphological, anatomical, and micromorphological features of pseudonectaries
To understand the morphological nature of pseudonectaries, we first performed morphological, anatomical, and micromorphological studies. Under stereomicroscope, petals of N. damascena appear to be long-stalked, hair-bearing, doubly geniculated, and vertically bilabiate structures (Fig. 2a, b). Pseudonectaries, which are located at the distal geniculate bend of the lower petal lip, are hemispherical, emerald, glistening, and nectar droplet-like, and about 700 μm in diameter and 500 μm in height (Fig. 2a, b). Under X-ray microcomputed tomography (micro-CT), the pseudonectaries are obviously thicker than the other regions of the lower petal lip (Fig. 2c, d), suggesting that they were caused by regional thickening rather than simple surface curving. Under microscope, pseudonectaries are composed of 8–12 layers of irregularly arranged parenchyma cells covered by the tightly arranged epidermal cells (Fig. 2e, f). Both the parenchyma and epidermal cells are large in size and stained lightly and have large vacuoles and small nuclei (Fig. 2e, f). This, in fact, is also quite different from what we saw in nectary cells. In nectary tissues, the cells are small in size and stained darkly, suggestive of large nuclei and tiny or no vacuole (Fig. 2g, h). Under scanning electron microscopy (SEM), the features observable under stereomicroscope are even more obvious, and clear micromorphological differences can be seen between pseudonectaries and all other parts of the petal (Fig. 2i). Specifically, in addition to the long hairs, there are two types of polygonal cells (with smooth and grainy surfaces, respectively) that were exclusively found on pseudonectaries. Notably, however, it is these tightly arranged, nonsecretory polygonal epidermal cells with flat and smooth surface that can reflect light and make pseudonectaries shiny and attractive. Taken together, these results suggest that, as nectar droplet-like, nonsecretory protrusions with various exquisite morphological and optical modifications, pseudonectaries are quite different from nectaries and all other parts of the petal in many aspects.
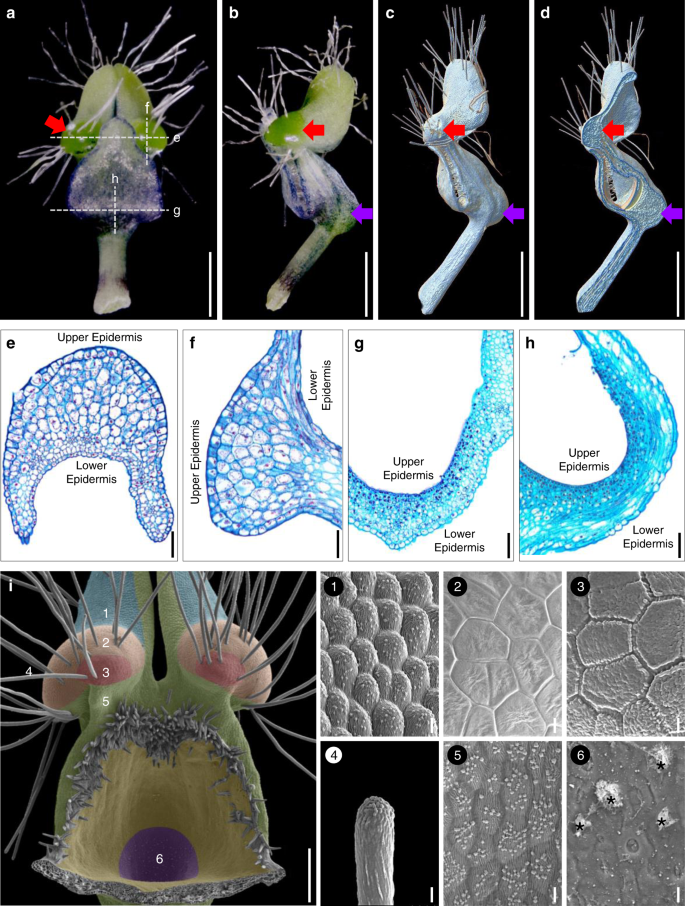
Mature petals under stereomicroscope: adaxial (a) and lateral (b) views. c–d Mature petals under micro-CT. Red and purple arrows in a–d point to the pseudonectary and the nectary, respectively. Scale bars: 1 mm. Anatomy of the pseudonectary and nectary: transverse (e, g) and longitudinal (f, h) sections. Scale bars: 100 μm. i Micromorphology of the pseudonectary. The numbered regions (1–6) in different colors represent the distribution of different types of epidermal cells. Asterisks in (6) indicate residual nectar. Scale bars: i, 100 μm; 1–6, 10 μm. For a–i and 1–6, the experiments were repeated three times independently with similar results.
Cellular basis of pseudonectary development
To understand how pseudonectaries were made through development, we performed time-course micromorphological and anatomical studies. We found that pseudonectaries, as well as the long hairs on them, started to emerge at about the sixth stage (S6) of petal development24, likely due to active cell division underneath the epidermis (Fig. 3a–p). Then, during development, pseudonectaries became more and more protuberant and conspicuous, and eventually reached their final sizes at the twelfth stage (S12) of petal development (Fig. 3a–p). Notably, while both cell division and cell expansion have played key roles in pseudonectary development, their contributions are different: at the early stage of pseudonectary development (i.e., from S5 to S8 of petal development), the number of cell layers increased dramatically (Fig. 3q), suggestive of more active cell division; at the late stage of pseudonectary development (i.e., from S9 to S12 of petal development), the size of the cells increases more quickly (Fig. 3r), suggestive of more active cell expansion. Clearly, the ninth stage of petal development (S9) marks the transition between more active cell division and more active cell expansion during pseudonectary formation. Yet, it was the additive effect of cell division and cell expansion that led to the regional thickening and rapid formation of pseudonectaries (Fig. 3s).
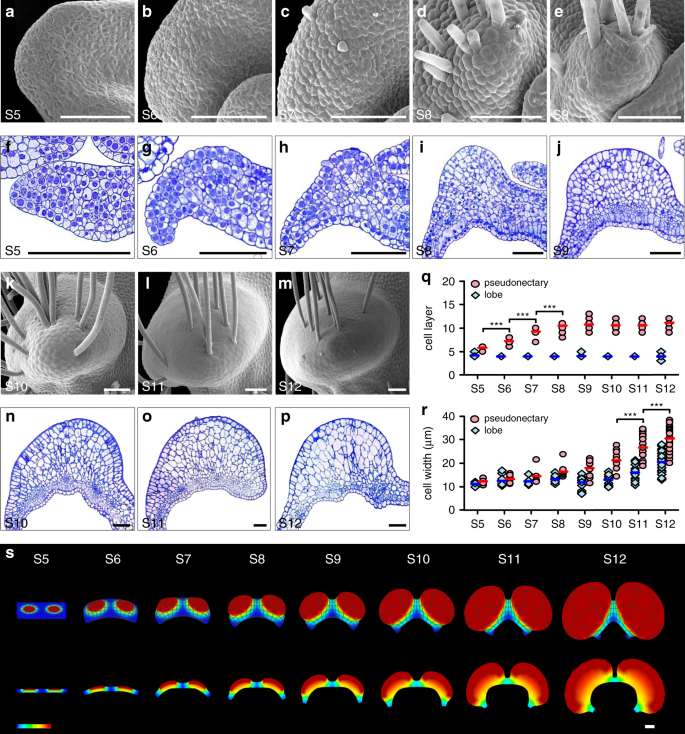
Pseudonectaries at various developmental stages under SEM (a–e, k–m), with their corresponding transverse semi-thin sections being shown in (f–j, n–p). Scale bars: 100 μm. Comparisons of cell layer (q) and cell width (r) between the pseudonectary and lobe areas of petals at different stages. Bars indicate the mean values. The asterisks indicate the significant difference between adjacent stages by two-side Wilcoxon rank sum test (P < 0.001). The exact P values were listed in the Source Data. In q, n = 10 for S5, n = 19 for S6, n = 14 for S7, n = 16 for S8, n = 18 for S9, n = 10 for S10, n = 18 for S11, and n = 37 for S12; In r, n = 24 cells for S5, n = 42 cells for S6, n = 15 cells for S7, n = 33 cells for S8, n = 39 cells for S9, n = 30 cells for S10, n = 54 cells for S11, and n = 120 cells for S12. Source data for q and r are provided as a Source Data file. s Schematic of the pseudonectary development. The three-dimensional shapes and their corresponding transverse sections at S6, S7, S9, and S12 are shown, respectively. Heatmap is plotted denoting the relative growth rates. For a–p, the experiments were repeated four times independently with similar results.
Genes involved in pseudonectary formation
To further understand the uniqueness of pseudonectaries, we divided the S9 petals into four parts (i.e., Parts I, II, III, and IV; Fig. 4a, b) and conducted RNA sequencing analyses. Of the 21,223 genes that are expressed in the petals of this stage, 172 and 652 are specifically and preferably expressed in the pseudonectary-containing Part III as compared with the other three parts (Fig. 4c, d; Supplementary Dataset 1), respectively, suggestive of the uniqueness of this part. Interestingly, of the genes that are preferably expressed in this part, there are homologs of the well-known regulators of photosynthetic apparatus and cell division, such as the GOLDEN2-LIKE1 (GLK1) and CYTOKININ-RESPONSIVE GATA FACTOR 1 (CGA1)42,43, and the gene ontology (GO) categories that were enriched include “photosynthesis”, “chlorophyll biosynthetic process”, and “response to cytokinin” (Supplementary Table 1). Genes involved in nectary development, such as orthologs of STY1/2 and LRP20, however, are preferably expressed in the nectary-containing Part II (Supplementary Dataset 1), suggesting that pseudonectaries indeed have nothing to do with nectaries.
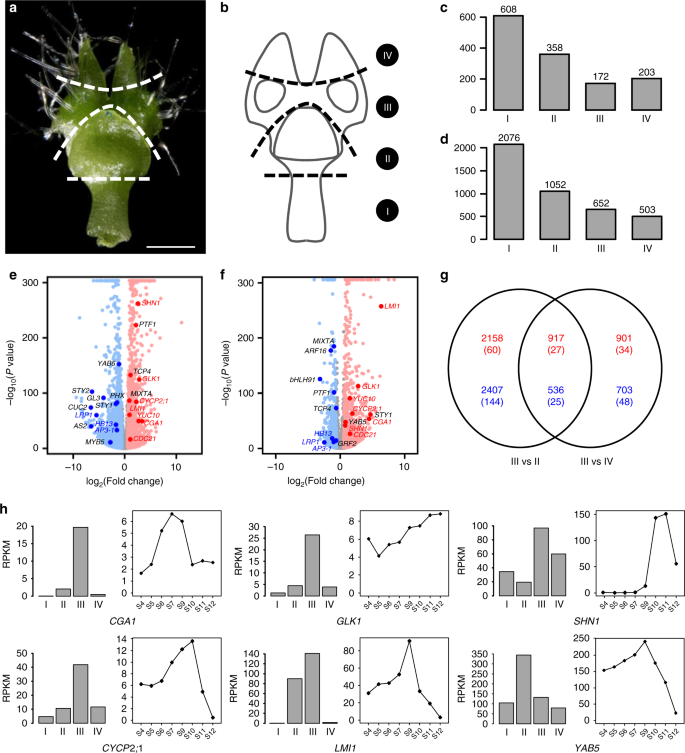
a, b Sampling strategy for RNA sequencing of the S9 petal. I, II, III, and IV represent the sampled four parts. Scale bar: 1 mm. For a, the experiments were repeated three times independently with similar results. Histograms showing the number of genes specifically (c) and preferably (d) expressed in each part. Volcano plots showing differentially expressed genes in Part III relative to Part II (e) and Part IV (f). The up- and downregulated genes are shown with red and blue dots, respectively, while the genes showing no significant expression changes are represented by gray dots. Representative genes homologous to the well-known regulators are highlighted with enlarged dots, with red and blue fronts standing for up- and downregulated genes, respectively, in both comparisons, while black front representing up- or downregulated genes in one comparison. g A Venn diagram showing the numbers of up- and downregulated genes (red and blue, respectively) in the two comparisons shown in e and f. A number of TFs are shown in brackets. h The spatiotemporal expression patterns of representative candidate genes.
To identify the genes that are involved in pseudonectary formation, we also compared Part III with its neighboring regions (i.e., Parts II and IV) by using DESeq244. We found that, compared with Part II, Part III has 3075 (including 87 transcription factor genes; hereafter called TFs) and 2943 (169 TFs) up- and down-regulated genes, respectively (Fig. 4e, g; Supplementary Dataset 1). Similarly, compared with Part IV, Part III has 1818 (61 TFs) and 1239 (73 TFs) up- and down-regulated genes, respectively (Fig. 4f, g; Supplementary Dataset 1), in which 917 (27 TFs) and 536 (25 TFs) were shared by the two comparisons (Fig. 4g; Supplementary Dataset 1). Of the genes that are up-regulated in both comparisons, there are homologs of the genes associated with cell division (e.g., CGA1 and CYCLIN P2;1, CYCP2;1)42,45, chloroplast development (e.g., GLK1)43, wax formation (e.g., SHINE1, SHN1)46, and leaf morphogenesis (e.g., LATE MERISTEM IDENTITY1, LMI1)47 (Fig. 4h). Because these processes are required for the formation of pseudonectaries, it is very likely that they are key regulators of pseudonectary development.
Importance of NidaYAB5 in pseudonectary development
Of the genes that are upregulated in Part III, one (i.e., NidaYAB5; Fig. 4e, f, h) attracted our special attention because it is the ortholog of a known abaxial gene (i.e., YAB5)24 and because ectopic expression of adaxial/abaxial genes have been shown to play key roles in the formation of outgrowths on leaf-like structures48,49,50,51,52. To gain some insights into its function, we first performed detailed mRNA in situ hybridization studies (Fig. 5a–c). We found that, as expected, NidaYAB5 was first expressed in the adaxial side of the upper lip and the abaxial side of the lower lip of the petals. Then, at S6, the signal of NidaYAB5 also expanded to the places where pseudonectaries would be initiated, although the expression level was rather low. Thereafter, the expression of NidaYAB5 in the developing pseudonectaries became stronger and stronger, and eventually reached the summit at S9 (Fig. 4h). Clearly, the ectopic expression of NidaYAB5 strongly coincides with the formation of pseudonectaries.
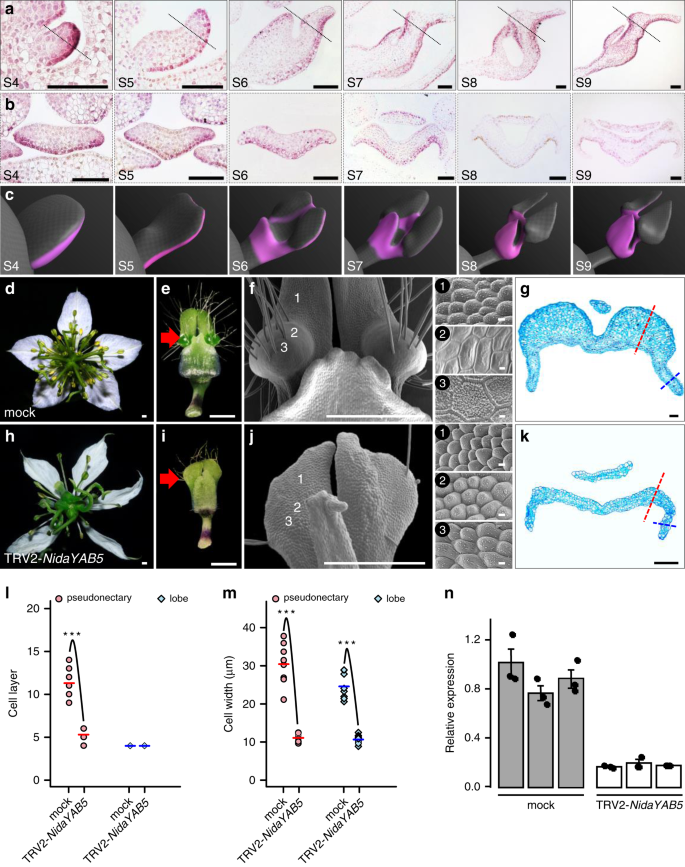
a, b The results of in situ hybridization of NidaYAB5 in petals. Dashed lines in the longitudinal sections (a) indicate the positions at which the transverse sections (b) were made. Scale bars: 100 μm. For a, b, the experiments were repeated three times independently with similar results. c Virtual clay models showing the expression domains (pink) of NidaYAB5 in petals. Phenotypes of the mock (d–g) and TRV2-NidaYAB5-treated flowers with strong phenotypic changes (h–k). The flowers and mature petals are shown in d, h and e, i, respectively. The micromorphology and anatomy of the pseudonectary regions are shown in f, j and g, k, respectively. 1–3 next to f and j indicate the corresponding regions on the surface of the mock and TRV2-NidaYAB5-treated petals. Red arrows point to the pseudonectary region, and dashed lines indicate the pseudonectary (red) and lobe (blue) areas at which the cell layer (l) and cell width (m) were recorded. Scale bars: d–f, h–j, 1 mm; 1–3, 10 μm; g, k, 100 μm. Comparisons of cell layer (l) and cell width (m) at the pseudonectary and lobe areas between mock and TRV2-NidaYAB5-treated flowers. Bars indicate the mean values. The asterisks indicate the significant difference by two-side Wilcoxon rank sum test (P value < 0.001) between samples. The exact P values were listed in the Source Data. Source data for l and m are provided as a Source Data file. n The results of qRT-PCR for NidaYAB5 in petals of mock and TRV2-NidaYAB5-treated flowers. Each treatment includes three biological replicates. Error bars indicate the standard deviation (SD) of three technical replicates of each biological replicate. The measure of the center for the error bars is the mean value of three technical replicates of each biological replicate. Data are presented as mean values ± SD.
To understand the function of NidaYAB5, we attempted to knock down its expression by using VIGS technique. Compared with the tobacco rattle virus (TRV2)-treated flowers (i.e., the mock) and TRV2-NidaYAB5-treated flowers with weak and moderate phenotypic changes, TRV2-NidaYAB5-treated flowers with strong phenotypic changes no longer produce pseudonectaries, whereas all other parts of the petals remain largely unaffected (Fig. 5d, e, h, i, n; Supplementary Fig. 1). Moreover, in the area where pseudonectaries were supposed to be, the polygonal epidermal cells with smooth and grainy surfaces were all transformed into conical cells, the highly specialized cell types that are widely distributed on the adaxial surface of the petal lobes (Fig. 5f, j). When sectioned, the number and size of the cells in the pseudonectary regions decreased dramatically, whereas the number of cells in the lobe regions were largely not affected (Fig. 5g, k–m). This confirms that NidaYAB5 plays key roles in pseudonectary development.
The contribution of pseudonectaries to pollination success
Previous studies have proposed that pseudonectaries may function as nectar guides or visual attractants4,21,22,27,53. To test this hypothesis, we first examined the optical properties of pseudonectaries (Fig. 6a–c). We found that, under ultraviolet (UV) light, pseudonectaries are shiny and reflective, suggestive of UV reflection, whereas all other parts of the petals and the flower are dark black (Fig. 6b), suggestive of UV absorption. Under bee vision, the pseudonectaries are still shiny and reflective, while all other parts of the petals and the flower become dark green (Fig. 6c), suggesting that the pseudonectaries may be seen by bees. In addition, because of the formation of two quasi-perpendicular, geniculate bends on the lower petal lip, pseudonectaries became more conspicuous than any other parts of the flower. When all petals of a flower were considered together, the pseudonectaries form a concentric circle, in which the two from each petal mark the entrance of the nectary chamber (Fig. 6d–j).
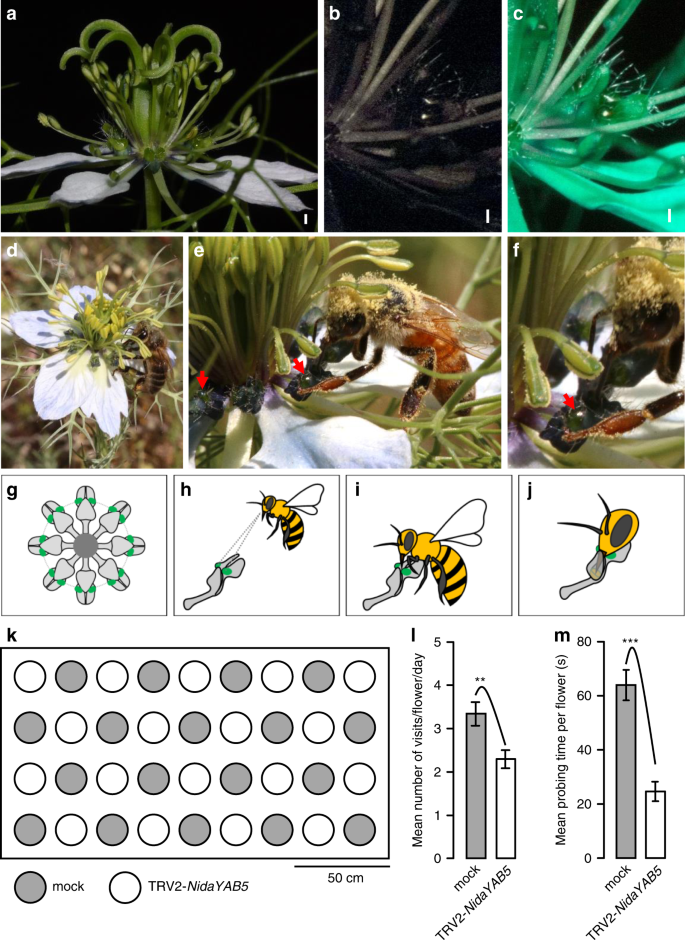
A wild-type flower under visible light (a), ultraviolet light (b), and bee vision (c). Scale bars: 1 mm. d–f Photographs show honey bees (Apis mellifera) forging for nectar. Red arrows indicate the pseudonectaries. The pseudonectary in e is magnified and shown in f. g Petals and pseudonectaries in a wild-type flower, with all other floral organs being omitted. h–j Visitation of a petal by a honeybee. k Schematic layout of the mock and TRV2-NidaYAB5-treated flowers with strong phenotypic changes for pollination studies. Comparisons of the visiting frequency (l) and probing time (m) of honey bees, the most effective pollinators, on the mock and TRV2-NidaYAB5-treated flowers. The asterisks indicate the significant differences by two-side Wilcoxon rank sum test (P < 0.01 and P < 0.001, respectively) between samples. p = 0.006654 for l and p = 1.396e−08 for m. n = 18, both for mock and TRV2-NidaYAB5-treated flowers for four independent experiment days. Error bars indicate the standard error (SE) of the mean visiting frequency or probing time of 4 days. Data are presented as mean values ± SE. Source data for l and m are provided as a Source Data file.
To further understand the function of pseudonectaries, we performed pollination studies. We found that, consistent with previous studies54, the most frequent visitors and effective pollinators of N. damascena are honey bees (Apis mellifera), although the contribution of bumblebees (Bombus lucorum) and wasps (Polistes dominulus) were also substantial (about 10% of the recorded times of visitations). When flowers with and without pseudonectaries (i.e., mock flowers and the TRV2-NidaYAB5-treated flowers with strong phenotypic changes, respectively) were arrayed side by side (Fig. 6k), both types could attract honey bees. However, both the visiting frequency and probing time of honey bees decreased significantly in flowers without pseudonectaries than in those with pseudonectaries (Fig. 6l, m), suggestive of the differences in attractiveness. More interestingly, when a pollinator landed on a flower with pseudonectaries, it tried to check every petal in a clockwise or anticlockwise direction; when it landed on a flower without pseudonectaries, however, it usually flew away after brief tries. Taken together, these results tend to suggest that pseudonectaries can not only attract suitable pollinators but also mark the entrance of the nectar chamber, thereby guiding their visitation.
Source: Ecology - nature.com
