Benchmark regression analysis
In order to make the experimental results more credible, before using the GWR regression analysis, a global OLS test is performed first.
Tables 1 and 2 show that basic OLS regression. In order to solve the multicollinearity problem of data, according to the VIF of variables, the collinearity factors are removed by using the backward stepwise method. lnPrecipitation is removed in columns (1) and (2) step by step.
Additionally, most of the variables have a positive impact on Density of waterlogged sites; only DIVISION and SHDI are negative. We also find the following. (1) The larger the area of construction land is, the more likely the urban waterlogging will occur. (2) The denser the urban landscape, the more prone to waterlogging. (3) The more complex the landscape of building land is, the less likely it is to be flooded. (4) The coefficient of precipitation is large, which has a significant impact on urban waterlogging. (5) Considering the overall indicators, there was no significant difference in all regression factors of the all variables in 4 land use classes and 16 land use classes, and the adjusted R2 are approximately 0.15 in 4 land use classes and 0.20 in 16 land use classes, and the fitting degree is not high.
Since rainfall has a great influence on the model, this factor is eliminated in the GWR Model.
Autocorrelation analysis of urban waterlogging in Shenzhen City
Based on the global Moran’s I theory, 56 small watersheds in Shenzhen where waterlogging occurred were used as spatial units, and the average density of waterlogged sites in each small watershed was used as the observation value. Using Geoda software, a distance weighting matrix (DWM) was selected to analyze the spatial autocorrelation of waterlogged sites. It can be seen from Fig. 1 that the global Moran’s I index was 0.236. After the significance test, the normalized Z value was 2.913335 (>1.96), indicating that the spatial autocorrelation of waterlogged site density in Shenzhen was significant at the 5% significance level. However, because the Z value was not large, the spatial autocorrelation was not very obvious.
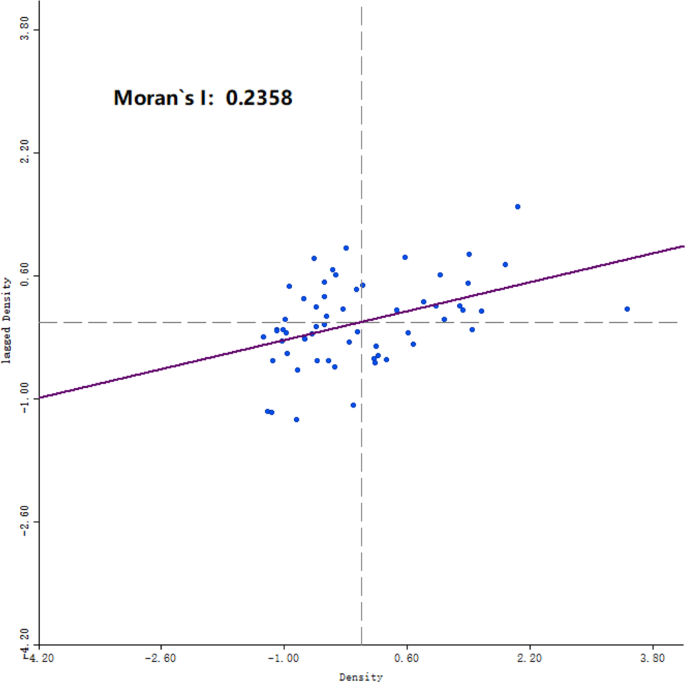
The scatter plot of Moran’s I values for waterlogged site density in Shenzhen City.
It can be seen from the LISA cluster map (Fig. 2) that there was a wide range in the spatial distribution of the density of waterlogged sites in Shenzhen. Nanshan District, Baoan District, and Guangming New District in the west were low-low accumulation areas, indicating that the resistance to waterlogging disasters in this and surrounding areas was strong. A small part of Longhua District and Dapeng New District were high-high accumulation areas, indicating that these and surrounding areas were prone to waterlogging disasters. Small parts of Dapeng New Area were low-high accumulation areas, indicating that these areas with a low waterlogged site density were surrounded by waterlogging-prone areas, which represented a low to high transitional area of waterlogging. Overall, there was a weak spatial agglomeration of the density of waterlogged sites in Shenzhen. The only variations occurred in local areas, reflecting the non-stationary characteristics of the spatial distribution of the degree of waterlogging disasters.
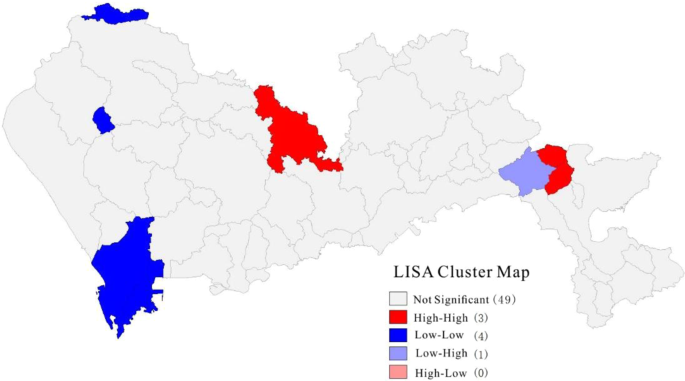
An aggregated local indicators of spatial association (LISA) map of waterlogged site density in Shenzhen City.
GWR model establishment and test results
Due to the differences in the distribution of urban landscape patterns, the spatial distribution of waterlogged sites in the urban area was characterized by non-stationary features. Therefore, the land use types in Shenzhen were divided into four and 16 categories to calculate the landscape pattern index. The two groups were established and a total of 10 landscape pattern indexes in each group were obtained and used as independent variables. At the same time, due to the influence of daily rainfall and topography, the GWR4.0 software was used to construct the GWR model with the average slope and average rainfall as independent variables.
It can be seen from Table 3 that when the land use was divided into four types, the Built up _DIVISION had the greatest influence on the density of waterlogged sites, with a negative correlation, i.e., the more broken the patches of built-up land, the more serious the potential waterlogging disaster. The SHDI also had a significant negative correlation with the density of waterlogged sites, which means that the more complex the patch of built-up land, the more serious the potential waterlogging disaster. Of the three landscape pattern indexes that had a positive correlation with the degree of waterlogging disaster, the most influential was the Built up _COHESION, i.e., the greater the potential for the built-up land to experience a waterlogging disaster.
When the land use was divided into 16 types, the Built up_ DIVISION and SHDI had a significant negative correlation with the density of waterlogged sites. The greater the value of Built up_ LPI, CONTAG, and Built up_ COHESION, the greater the potential for a waterlogging disaster.
Regardless of whether the land use type was divided into four or 16 categories, the impact on waterlogging disasters followed the order of Built up_ DIVISION > SHDI > Built up_ COHESION > CONTAG > Built up_ LPI. This was mainly because the values of Built up_ DIVISION and SHDI were smaller than those of the other indexes, and therefore the regression coefficient values were large. In addition, it can be seen from Table 4 that the regression coefficient of each landscape pattern index had an obvious non-stationarity in Shenzhen. The ability to determine this is the largest advantage of using the GWR model in spatial data analysis.
Non-stationarity verification of the GWR model
As shown in Fig. 3, when the land use types were divided into four categories, the regression coefficient of the landscape pattern indexes and the density of waterlogged sites showed an obvious spatial non-stationarity. For Built up_ LPI, Built up_ COHESION, and CONTAG, low regression coefficient values were mainly distributed in Baoan District, Guangming New District, and Longhua District in the northwest of Shenzhen, followed by Nanshan District and Futian District in the southwest and Pingshan District in the central and eastern regions. These areas are the main population centers in Shenzhen, and the land use types are mainly large areas of built-up land and fragmented green spaces, and therefore the Built up_ LPI, Built up_ COHESION, and CONTAG values were high, leading to small regression coefficients. In Longgang District, Yantian District, and Dapeng New District in the northeast, south central, and southeast of Shenzhen, due to the complex land use type, the Built up_ LPI, Built up_ COHESION, and CONTAG values were low, resulting in a large regression coefficient.
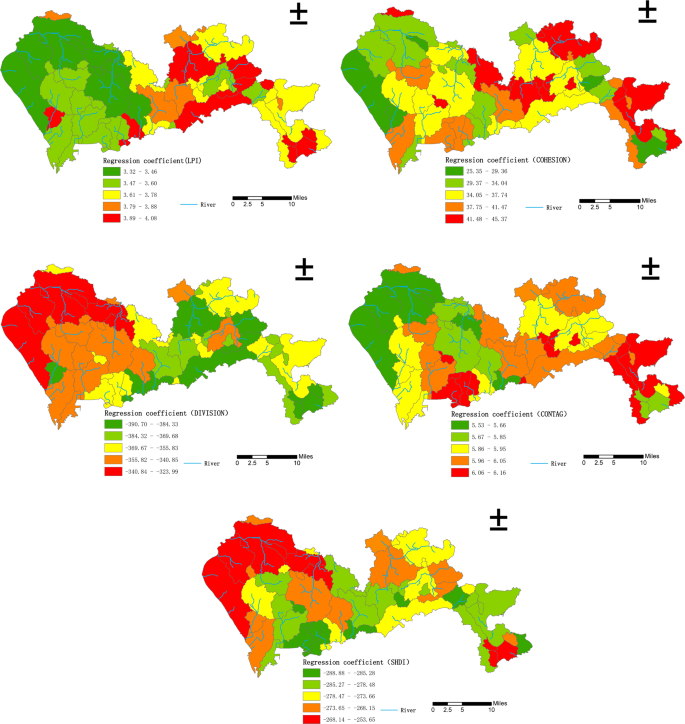
Distribution of regression coefficients for the relationships between the density of waterlogged sites and landscape pattern indexes (4 land use classes) in Shenzhen.
For Built up_ DIVISION and SHDI, low regression coefficients were mainly distributed in Futian District, Luohu District, and Yantian District in the south-central part of Shenzhen, followed by part of the Dapeng New District in the southeast and part of Longgang District in the northeast. These areas are located in the old communities of Shenzhen, where urban planning in the early years of the city’s development was inadequate. The land use type is mainly fragmented built-up land and small patches of green land, and therefore the Built up_ DIVISION index and SHDI index values were high, resulting in small regression coefficients. Baoan District, Guangming New District, and Longhua District, located in the western part of Shenzhen City, had a relatively large regression coefficient due to the relatively simple land use type and large patches of built-up land, resulting in low Built up_ DIVISION index and SHDI index values.
Overall, under the rough classification accuracy of land use, the regression coefficients of Built up_ LPI, Built up_ COHESION, and CONTAG had a spatial distribution pattern of west low-east high. In contrast, the regression coefficients of Built up_ DIVISION and SHDI had a spatial distribution pattern of west high-east low.
When the land use type was divided into 16 categories, the regression coefficients of the landscape pattern index values and the density of waterlogged sites also displayed an obvious spatial non-stationarity. For the Built up_ LPI, Built up_ COHESION, and CONTAG indexes, the spatial distribution of the regression coefficients was similar to that when the land use types were classified into four categories, with a spatial distribution pattern of west low-east high. Additionally, the regression coefficient for CONTAG had significant layering characteristics. For the Built up_ DIVISION and the Built up_ SHDI the spatial distribution of the regression coefficients was similar to that when the land use type was divided into four categories, with a spatial distribution pattern of west high-east low. Additionally, the regression coefficient for Built up_ DIVISION displayed clear layering characteristics, as shown in Fig. 4.
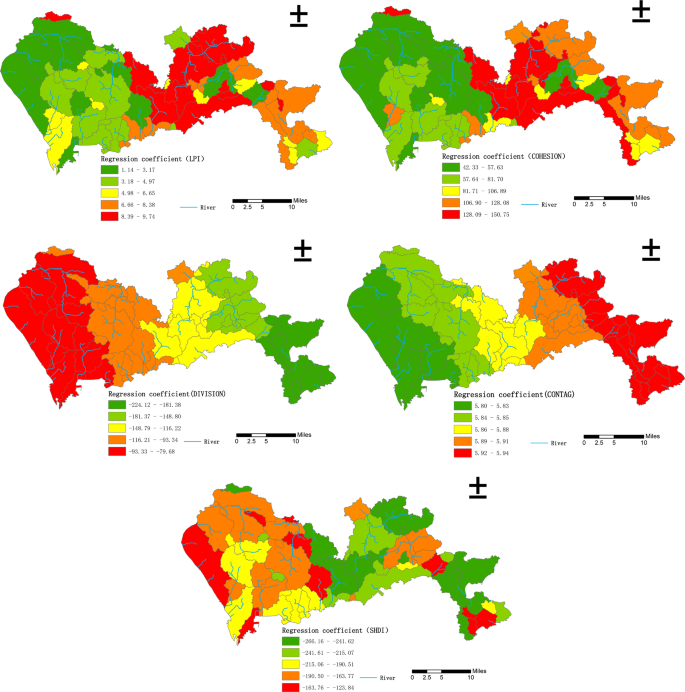
Distribution of regression coefficients for the relationships between the density of waterlogged sites and landscape pattern indexes (16 land use classes) in Shenzhen.
Comparing the landscape pattern indexes calculated by the GWR model established by dividing the land use type into four or 16 categories, it was found that under the rough classification, the regression coefficient of CONTAG changed slightly but the regression coefficient for Built up_ DIVISION changed substantially. The regression coefficients corresponding to the various landscape pattern indexes under the fine classification displayed greater spatial fluctuations than under the rough classification. The reason for this may be that after the land use types were subdivided, the differences in the various landscape pattern indexes were more obvious, as a result, the variation in the range of regression coefficients increased accordingly.
Because the regression coefficient distribution map displayed by Arc-GIS could not show the degree of each area affected by altitude, a spatial three-dimensional (3-D) scatter plot was produced using the Origin 9.0 software to represent the relationship between the landscape pattern indexes and the impact of waterlogging disasters at different latitudes, longitudes, and altitudes. Because the regression coefficients of the Built up _ DIVISION and SHDI were both negative, for the convenience of display in the 3-D scatter plot, the absolute values of the two indexes were selected.
As shown in Fig. 5, in the GWR model constructed by dividing the land use type into four categories, there was little spatial difference in the regression coefficient values and the values for Built up_ LPI and Built up_ COHESION when the altitude exceeded 100 m were significantly less than the regression coefficient values below 100 m. This indicates that the degree of damage from waterlogging disasters at high altitudes was less affected by the landscape pattern than at low altitudes. The regression coefficient of the other three landscape pattern indexes did not change significantly on the vertical scale.
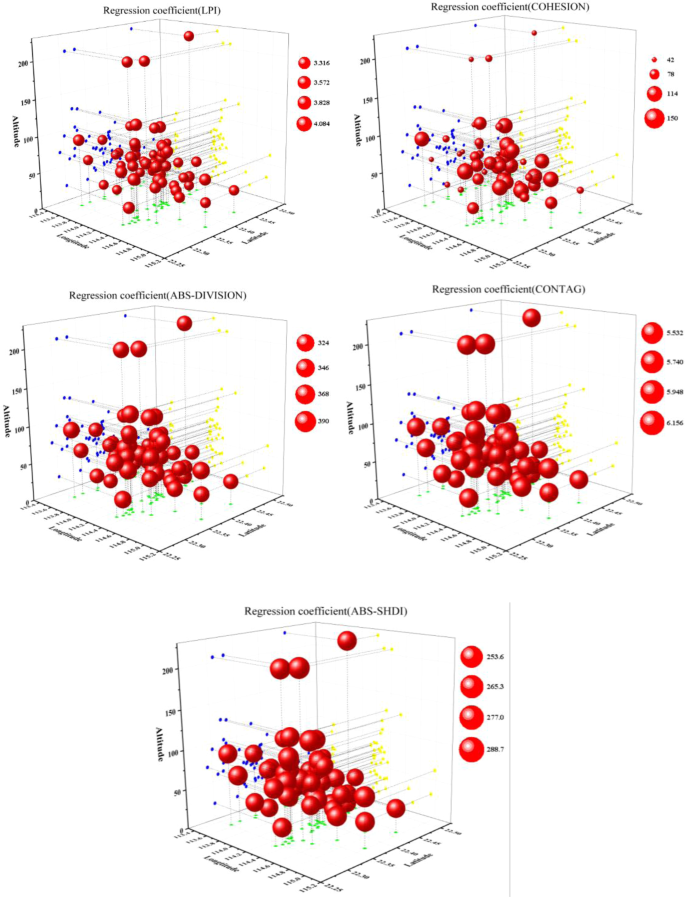
Three-dimensional 3-D scatter plot of regression coefficients for the relationships between the density of waterlogged sites and landscape pattern indexes (four land use classes) in Shenzhen.
As shown in Fig. 6, in the GWR model constructed by dividing the land use type into 16 categories, the regression coefficients were significantly different in space. For Built up_ LPI, Built up_ COHESION, and Built up_ CONTAG the regression coefficients below 100 m were significantly smaller than the regression coefficients when the altitude was above 100 m. This indicates that the degree of damage from waterlogging disasters at high altitudes was less affected by the landscape pattern than at low altitudes. For the regression coefficients of the other two landscape pattern indexes, there was no significant change in the vertical scale.
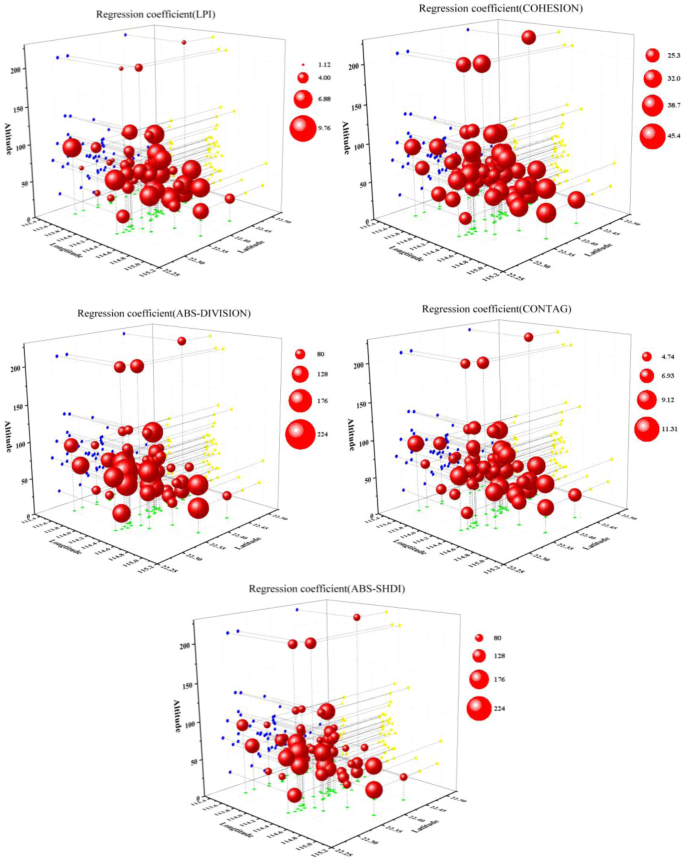
Three-dimensional 3-D scatter plot of regression coefficients for the relationships between the density of waterlogged sites and landscape pattern indexes (16 land use classes) in Shenzhen.
Source: Ecology - nature.com
