Insects
The FAW populations from Nigeria originated from ~270 larvae collected from corn fields in Ijaiye Farm Settlements, in Akinyele local government area of Oyo State (7°39′07.6″N; 3°49′51.2″E) in 2018. The field larvae from Nigeria were shipped to Germany in October 2018. Populations from Benin originated from mass rearing colonies at IITA Cotonou. This population was established from larvae collected in corn fields in 2016 and mated every second month to field individuals collected from corn plants. In December 2018, egg masses from Benin were shipped to Germany where ~600 larvae emerged. The Florida rice-strain was collected in a grass field in Moore Haven (+26° 53′ 3.04′′, −81° 7′ 21.17′′) in May 2010 (~300 larval specimens), and the corn-strain originated from corn plots at a University of Florida research station in Citra, northern Marion county, in September 2018 (~200 larval specimens).
All specimens (from Florida, Nigeria and Benin) were shipped to Germany, where they were reared on artificial pinto bean diet in climate chambers at 26 °C and 70% RH, with reversed light:dark (L:D) cycle and 14:10 L:D photoperiod. Adults were fed with 10% honey water and mated randomly in single pairs. All adult pairs from the field that produced fertile offspring were genetically analyzed to identify their strain (see below) and genotype-specific colonies were established and continuously reared. All experiments were conducted in Germany. Experiments with African populations and the Florida corn-strain were conducted within the first 4 months of laboratory rearing, while the Florida rice-strain was reared for eight years in the laboratory in Germany before experiments were conducted. Unfortunately, we were not able to maintain a stable corn-strain population from Benin (CCOI-CTPI) in the laboratory, which is why experiments conducted with this population usually have lower sample sizes than the other populations.
Genetic strain identification
Strain identification was assessed by screening adults for one mitochondrial marker (COI) and one nuclear marker (TPI), which are known to be diagnostic for both strains in North and South America28,29. DNA extractions were performed in a 96-well plate using Chelex 100 Resin (Bio-Rad Laboratories, Hercules, CA, USA). One adult leg was put in one well together with two metal beads and 300 µl 10% Chelex (diluted in ddH2O). The tissue was homogenized in a tissue lyser for 4 min at 30 Hz. The samples were heated for 30 min at 95 °C and 300 rpm spinning, after which they were frozen at −20 °C overnight. Then each plate was thawed, mixed, and centrifuged at 4000 rpm for 30 min. The supernatant was filtered through a fritted deep well filter plate (Thermo Fisher Scientific, Waltham, MA, USA) and used for strain analyses. Identification of the mitochondrial marker was performed as described by Unbehend, et al.17, i.e. after amplification of the COI gene, two strain-specific digests with MspI and SacI were conducted to analyze the strain-affiliation via gel electrophoresis. The TPI marker was analyzed according to methods used by Nagoshi28, i.e. a part of the TPI gene was Sanger-sequenced at the MPI-CE and ten single nucleotide polymorphisms were used for strain identification. The sequences were analyzed with Sequencher 5.2.4 (Gene Codes Corporation, Ann Arbor, MI, USA).
Electrophysiology
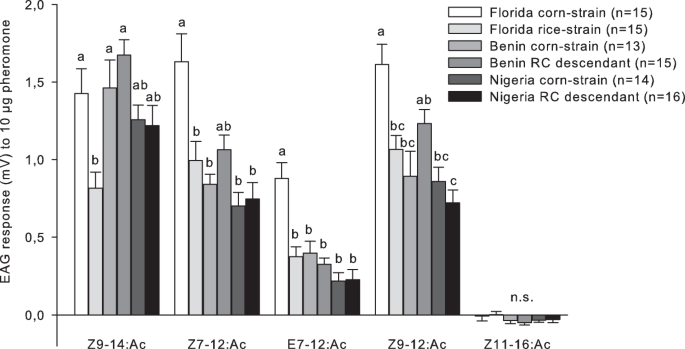
To identify the male antennal response to Z9–14:Ac, Z7–12:Ac, E7–12:Ac, Z9–12:Ac, and Z11–16:Ac, EAG recordings of 0–5 days old virgin males were performed with populations from Benin, Nigeria, and Florida. Samples from Florida were included in the analysis as we found no study in the literature that analyzed the EAG response of American populations to all five compounds. Male heads were severed, gently crushed to eliminate movement of the antennae, and placed on a fork-shaped electrode holder (Syntech, Buchenbach, Germany) using an electrolyte gel (Spectra 360 Electrode Gel, Parker Laboratories, Fairfield, NJ, USA). Three amounts (0.001 µg, 0.1 µg, and 10 µg) of each pheromone compound were presented from the lowest to the highest concentration. The lowest pheromone amount (0.001 µg) and 100 times higher amount of 0.1 µg pheromone were chosen as they reflect the range of the female pheromone production. The highest amount of 10 µg pheromone was used as maximum stimulus to identify responses that might not be detected at lower amounts. Ten µl of each pheromone component in each amount were pipetted onto a small piece of filter paper (1 cm2) and placed into a glass Pasteur pipette. Control pipettes contained filter paper with 10 µl hexane alone. A stimulus controller (CS-55, Syntech) produced a flow of 1 l/min charcoal-filtered air over the antennae. Antennae were stimulated with 0.5 s odor puffs, using a randomized sequence for each recording. Before and after testing three different odors, the control stimulus was presented. The inter-stimulus interval was 30 s. Signals were recorded with Syntech software (Autospike Version 3.9) and statistically analyzed with a one-way analysis of variance (ANOVA) followed by a Tukey’s HSD post hoc test in R version 3.2.038. To meet assumptions of normality and variance homogeneity, the spike amplitude (in mV) was log(x + 1) transformed.
Pheromone analysis
The sex pheromone of 2–4 days old virgin females from Benin and Nigeria was analyzed in three experiments. Pheromone data of FAW females from Florida have been previously described by Unbehend, et al.17 and were included in this manuscript for comparison. In the first experiment, GC-MS analysis was performed to evaluate whether the five pheromone compounds that have been found in FAW females from America (Z9–14:Ac, Z7–12:Ac, E7–12:Ac, Z9–12:Ac, Z11–16:Ac) are also present in populations from Africa. Glands were extracted 2–4 h into scotophase. The gland was excised from the female abdomen and singly placed into a glass vial containing 50 µl hexane (Carl Roth, Karlsruhe, Germany) plus 125 ng pentadecane (Sigma-Aldrich Chemie GmbH, Munich, Germany) as internal standard. After 30 min, the gland was removed and extracts of 10 females per region and strain were pooled and reduced from 500 µl to 30–50 µl under a gentle stream of nitrogen. Three µl of the reduced extract were analyzed with GC-MS (5977 A MSD and 7890B GC Systems, Agilent technologies Inc., Santa Clara, CA, USA). The GC was equipped with an INNOWAX column (30 m, 0.25 mm id, 25 μm film thickness, Agilent Technologies) and helium was the carrier gas (1 ml/min). The inlet temperature was 240 °C. The GC was programmed from 60 °C with a 2 min hold to 180 °C at 30 °C/min, then to 230 °C at 5 °C/min, and finally to 260 °C at 20 °C/min with a final 5 min hold. The MS transfer line was held at 260 °C, the MS ion source at 230 °C, and mass spectra were taken in EI mode (at 70 eV) in the range from 29–350 m/z. An internal standard containing 100 ng Z9–14:Ac, Z7–12:Ac, E7–12:Ac, Z9–12:Ac, and Z11–16:Ac (Pherobank, Wageningen, The Netherlands) was used as reference to confirm the presence of compounds by comparing retention times and mass spectra. To verify the presence of the isomers Z7–12:Ac and E7–12:Ac, selected ion monitoring (SIM) was conducted for the masses 67 and 81 with a dwell time of 50 ms.
In the second experiment, we extracted glands of single females from Benin and Nigeria and determined the relative and total amount of pheromone by GC analysis. Glands were extracted as described above and GC analysis was conducted on a HP7890 GC with a splitless inlet attached to a high resolution polar capillary column (DB-WAXetr (extended temperature range)) and a flame-ionization detector (FID). Chemical analysis and GC programming was performed as described by Unbehend, et al.17. Gland extracts were concentrated from the volume of 50 µl to 4 µl, after which the whole extracts were injected into the GC. To confirm retention times, an internal standard containing 100 ng Z9–14:Ac, Z7–12:Ac, E7–12:Ac, Z9–12:Ac, and Z11–16:Ac, and pentadecane was injected into the GC. All pheromone data were log transformed to stabilize the variance and analyzed using a generalized linear model (GLM) in R38.
In the third experiment, we assessed whether the pheromone composition in the gland was similar to the pheromone release from the gland and sampled pheromones from the gland surface of calling females with fused silica optical fibers coated with PDMS.
The PDMS sampling was conducted with one population, the corn-strain from Nigeria, according to methods described by Lievers and Groot24. PDMS fibers (100 μm polydimethylsiloxane; Polymicro Technologies Inc., Phoenix, AZ, USA) were cut in 15 mm long pieces and rubbed for 2.5 min over the pheromone gland of females that called for at least for 15 min, after which the fibers were extracted for 30 min in 50 µl hexane and 125 ng pentadecane. After PDMS sampling, the pheromone glands of the already sampled females were excised from the female abdomen and extracted as described above. All extracts were analyzed via GC as described above.
Mating observations
To determine the onset time of mating, single pair matings of African populations were observed as described by Schöfl, et al.19. One to four day-old virgin adults were set up in single pairs in clear plastic cups (16 oz.) and fed with 10% honey solution. Matings were set up during the photophase and placed in a walk-in climate chamber (26 °C, 70% RH, L:D 14:10) at least two hours before scotophase. Couples were observed throughout the 10 hours of scotophase, with a 30 min interval. All pairs were observed for one or two consecutive nights starting at the first night after the mating. The onset time of the first mating, regardless of whether it occurred in the first or second night, was used for comparing the timing of mating behavior. Mating behavior of laboratory populations from Florida were previously described by Haenniger, et al.20 and included for comparison. Data were log transformed and analyzed with an ANOVA followed by a Tukey’s HSD post hoc test in R38.
Source: Ecology - nature.com
