Stationary colony model
Here, we study the stationary colony model, which is easier to analyze mathematically than the growing colony model. We consider the simplest possible model in which the colony is in a stationary state, with a constant age structure of workers.
Body size and number of specialized workers
The ant workers are adults, and their body sizes do not change once they emerge from the pupal stage. Their body size is determined by the amount of resources supplied in the growing period. Two phenotypes exist: workers specialized for work in the colony (body size ({x}_{1}) and number produced per day ({n}_{1})) and workers specialized for foraging outside the colony (body size ({x}_{2}) and number produced per day ({n}_{2})). Note that ({n}_{1}) and ({n}_{2}) are the daily influx of workers, and they replenish the loss of workers due to daily mortality to maintain the same composition. For simplicity, we assume that the cost of producing a worker is proportional to the body size. In this paper, we term ({x}_{1}) and ({x}_{2}) as the body size of workers in the two castes, but to be more accurate, they indicate the costs for producing workers in the two different castes.
The total amount of work within a colony is given by the summed number of workers of different ages, which decreases with age owing to mortality (Fig. 1a). The workers specialized for the work in the colony suffer daily mortality (u), and their age structure is ({n}_{1}exp [-ua]) for (0 < a < {a}_{max}). Each day, a surviving worker of this type performs a task of amount ({S}_{1}({x}_{1})). Here, we assume that it is a sigmoid function of body size ({x}_{1}), which is an assumption commonly adopted when discussing optimal egg size13. This indicates that a very small worker cannot perform well; however, beyond a certain size, the performance rapidly increases with body size, followed by performance saturation for large sizes (See Fig. 2). Hence, the total amount of tasks performed by these specialized workers in the colony is as follows:
$$I={int }_{0}^{{a}_{max}},{n}_{1}exp [-ua]{S}_{1}({x}_{1})da={n}_{1}{S}_{1}({x}_{1}){C}_{1},$$
(1a)
where ({C}_{1}=,frac{1}{u}(1-exp [-u{a}_{max}])). ({C}_{1}) implies the effective number of days for a newly emerged worker to contribute to the colony until its death (by either daily mortality or maximum age).
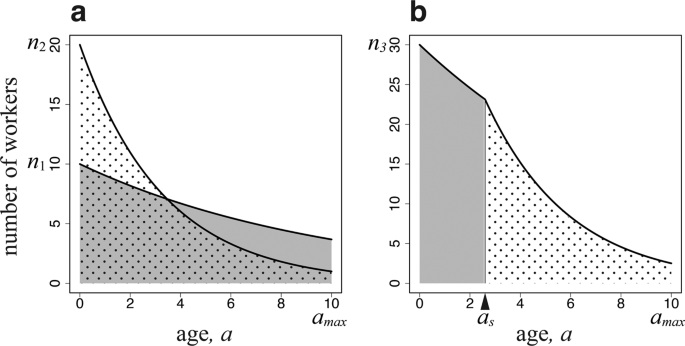
Number of workers engaging in two tasks as a function of age. The horizontal axis is (a), i.e., the time since emergence (age polyethism). (a) There are two groups of workers, each specialized in one task (caste polyethism). (b) There is a single type of worker engaging in both tasks according to age. The parameters used are as follows: (u=0.1), (v=0.2), ({a}_{max}=10); (a) ({n}_{1}=10), and ({n}_{2}=20); (b) ({n}_{3}=30), and ({a}_{s}=2.6).
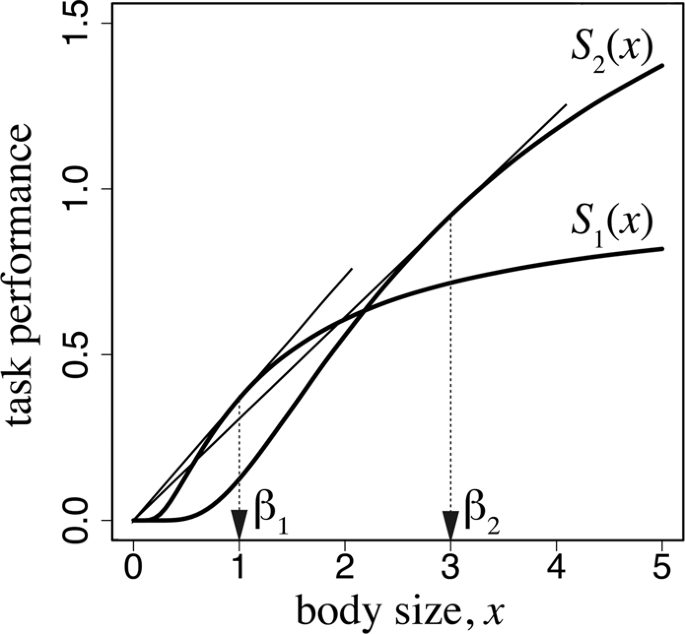
Task performance as a function of worker body size. The parameters used are as follows: ({alpha }_{1}=1.0), ({beta }_{1}=1.0), ({alpha }_{2}=2.5), and ({beta }_{1}=3.0).
Similarly, the age structure of workers specialized for foraging is ({n}_{2}exp [-(u+v)a]) for (0 < a < {a}_{max}). Foraging is accompanied by a higher daily mortality than is working in the colony, and we denote the excess mortality by (v). Let ({S}_{2}({x}_{2})) be the foraging performance per day by a surviving worker. The total foraging performance of the entire colony per day is the product of the per capita foraging performance ({S}_{2}({x}_{2})) and the number of workers of age (a) integrated from 0 to ({a}_{max}), and is given as follows:
$$F={n}_{2}{S}_{2}({x}_{2}){C}_{2},$$
(1b)
where
$${C}_{2}=frac{1}{u+v}(1-exp [-(u+v){a}_{max}]).$$
Here, we discuss the performance of producing ants of the whole colony. This requires both the work within the colony and the work out of the colony. The abundance of one task (say working within the colony) cannot compensate for the shortage of the other task (foraging) and vice versa. The performance of the entire colony should be limited by the performance of the most limited task between the two (Liebig’s law of the minimum14,15). We denote the work performance in the colony by (I) and that of foraging by (F). Additionally, we adopt the following simple assumption:
$$B=,{rm{min }}[I,F].$$
(2)
Note that, by scaling task performance functions ({S}_{1}(x)) and ({S}_{2}(x)) appropriately, we can always make the most efficient use of labor is achieved when the total performance of two tasks are equal: (,I=F). Wakano et al.8 adopted equation (2) for the performance of the colony. They studied the situation in which (I) and (F) are multiplied by stochastically changing coefficients, because they are considering the effect of environmental fluctuation, which we do not consider in this paper. In the equation above, (B) is the amount of resources for producing new workers and new reproductive individuals (such as new queens and males). Let (R) be the fixed amount of resources to be used for producing new workers per day. Because the success of the colony is the production of reproductive individuals, we can use (B-R) as a criterion to measure the performance of the entire colony. Here, we treat (R) as a fixed constant, and we regard (B) as the quantity to maximize in the following argument.
We search for a combination of ({n}_{1}), ({x}_{1}), ({n}_{2}), and ({x}_{2}) that achieves the maximum (B) in equation (2) under the following resource constraint:
$$R={n}_{1}{x}_{1}+{n}_{2}{x}_{2},$$
(3)
where (R) is a constant given as a parameter of the model.
In SI Appendix A, we provide the analysis of this optimization problem. The results show that the optimal sizes of the two workers ({x}_{1}) and ({x}_{2}) can be obtained from the following formulas:
$${S}_{1}({x}_{1})/{x}_{1}={S}_{1}text{‘}({x}_{1}),$$
(4a)
$${S}_{2}({x}_{2})/{x}_{2}={S}_{2}text{‘}({x}_{2}).$$
(4b)
These equations are the same as the optimal solutions in the model of the optimal number and size of eggs13. As illustrated in Fig. 2, the optimal body size ({x}_{1}) is the value of the tangential point obtained from drawing a line passing through the origin to the curve of function ({S}_{1}({x}_{1})). Similarly, the optimal size of foraging workers ({x}_{2}) can be obtained by drawing a line passing through the origin to the curve of function ({S}_{2}({x}_{2})). This implies that the body size of each caste is determined by the graph of the task performance as a function of body size for each task. Different tasks may require different body sizes, as represented by the difference between ({S}_{1}(x)) and ({S}_{2}(x)). Consider the case in which a worker of a smaller body size is sufficiently efficient in work within the colony; therefore, the optimal size for the caste specialized for working inside the colony is small (in terms of the cost for producing one worker). By contrast, if efficient foraging requires a larger worker, the optimal size for the foraging ant caste becomes larger.
In Fig. 2, we adopted ({S}_{i}(x)={alpha }_{i}exp [-frac{{beta }_{i}}{x}]) for (i=1,,2). For these functions, the optimal sizes in equation (4) are simply ({x}_{i}={beta }_{i}) ((i=1,,2)).
The numbers of workers produced per day for the two castes are determined as follows:
$${n}_{1}=frac{R}{{x}_{1}}frac{frac{{x}_{1}}{{S}_{1}({x}_{1}){C}_{1}}}{frac{{x}_{1}}{{S}_{1}({x}_{1}){C}_{1}}+frac{{x}_{2}}{{S}_{2}({x}_{2}){C}_{2}}},$$
(5a)
$${n}_{2}=frac{R}{{x}_{2}}frac{frac{{x}_{2}}{{S}_{2}({x}_{2}){C}_{2}}}{frac{{x}_{1}}{{S}_{1}({x}_{1}){C}_{1}}+frac{{x}_{2}}{{S}_{2}({x}_{2}){C}_{2}}}.$$
(5b)
The derivation of these results is provided in SI Appendix A.
The amount of resources used for the small workers is ({n}_{1}{x}_{1}) per day and that for the large workers is ({n}_{2}{x}_{2}) per day. Equations (5a) and (5b) indicate that the amount of resources available for new worker production per day, (R), is split between the small workers and large workers at a ratio of (frac{{x}_{1}}{{S}_{1}({x}_{1}){C}_{1}}) to (frac{{x}_{2}}{{S}_{2}({x}_{2}){C}_{2}}). It is noteworthy that ({S}_{i}({x}_{i})/{x}_{i}) can be interpreted as the efficiency of investment in the production of workers of type (i) measured by the daily amount of task (i) to be performed per unit resource investment. ({C}_{i}) is the expected number of days that a worker lives. Hence, equation (5) implies that the amount of resources to be used in the optimal colony strategy is to be invested in a manner inversely proportional to the task-performing efficiency. More resources should be allocated to the task with the lower efficiency. For example, in a habitat with abundant food availability, a smaller fraction of resources should be allocated to forager production than in an environment with scarce food resources.
When workers perform both tasks in an age-dependent manner
We now consider a colony that consists of workers of the same size ({x}_{3}), which performs both tasks depending on age. As illustrated in Fig. 1b, they engage in work in the colony before switching age ({a}_{s}) and in foraging outside the colony after ({a}_{s}). The shaded and dotted areas are individuals working in the colony and foraging outside of the colony, respectively. Foraging is accompanied by a higher daily mortality than working in the colony. Let ({n}_{3}) be the number of newly emerging workers per day. If they switched tasks based on age, the younger workers would engage in tasks with smaller daily mortality, while the older workers would perform tasks with larger daily mortality. This is optimal for the entire colony. Because the older workers have a shorter time remaining until the maximum age ({a}_{max}) than the younger workers, the risk of higher mortality would be less important than in the younger workers, as the latter have more days before reaching ({a}_{max}). This pattern has been observed in many species1,7, and was confirmed by computer simulations of colony growth8. Therefore, we assume this pattern in our study. We chose the switching age ({a}_{s}) to be the optimal age to attain the maximum colony performance. Furthermore, we optimized the size ({x}_{3}) and the number of workers ({n}_{3}) to be produced per day. The total amount of work within the colony and that of foraging are as follows:
$$I={int }_{0}^{{a}_{s}},{n}_{3}exp [-ua]{S}_{1}({x}_{3})da={n}_{3}{S}_{1}({x}_{3}){A}_{1}({a}_{s}),$$
(6a)
$$F={int }_{{a}_{s}}^{{a}_{max}},{n}_{3}exp [-u{a}_{s}]exp [-(u+v)(a-{a}_{s})]{S}_{2}({x}_{3})da={n}_{3}{S}_{2}({x}_{3}){A}_{2}({a}_{s})$$
(6b)
respectively. Here, we define two quantities:
$${A}_{1}({a}_{s})=frac{1}{u}(1-exp [-u{a}_{s}]),$$
(7a)
$${A}_{2}({a}_{s})=exp [-u{a}_{s}]frac{1}{u+v}(1-exp [-(u+v)({a}_{max}-{a}_{s})]).$$
(7b)
Each implies the effective number of days to contribute to the colony through the respective task to be made by a newly emerged worker. The objective function is, again, the colony performance given by equation (2), which is maximized under the resource constraint: (R={n}_{3}{x}_{3}).
According to the analysis in SI Appendix B, the optimal solutions of ({a}_{s}) and ({x}_{3}) satisfy the following:
$$frac{frac{d}{d{a}_{s}},mathrm{ln},{A}_{1}({a}_{s})}{frac{1}{{x}_{3}},-frac{d}{,d{x}_{3}},mathrm{ln},{S}_{1}({x}_{3})}=frac{frac{d}{d{a}_{s}},mathrm{ln},{A}_{2}({a}_{s})}{frac{1}{{x}_{3}},-frac{d}{,d{x}_{3}},mathrm{ln},{S}_{2}({x}_{3})}.$$
(8)
We also have ({S}_{1}({x}_{3}){A}_{1}({a}_{s})={S}_{2}({x}_{3}){A}_{2}({a}_{s})), indicating that the total amount of work within the colony and that of foraging outside the colony must be balanced in the optimal use of labor ((I=F)). Using these two equations, we can solve the optimal solution numerically (i.e., the age of switching ({a}_{s}) and the size ({x}_{3})). The optimal number of eggs is then calculated as ({n}_{3}=R/{x}_{3}).
To determine the behavior of the model, we specify a task-performance function as follows: ({S}_{i}(x)={alpha }_{i}exp [-{beta }_{i}/x],) with (i=1,2). According to the analysis in SI Appendix B, we can determine the optimal worker size ({x}_{3}) and the optimal age of switching ({a}_{s}) which satisfy equations (7) and (8), using these particular forms of task performance functions. When workers engage in both tasks in an age-dependent manner, the optimal worker size ({x}_{3}) lies between ({beta }_{1}) and ({beta }_{2}), which are the optimal sizes for specialized workers (see equations (B.7a) and (B.7b)).
Competition between specialized castes and age-dependent switching
We now consider the competition between a type with caste polyethism and another type with age polyethism. The worker sizes and numbers are chosen to maximize the colony performance, as described in the previous two sections.
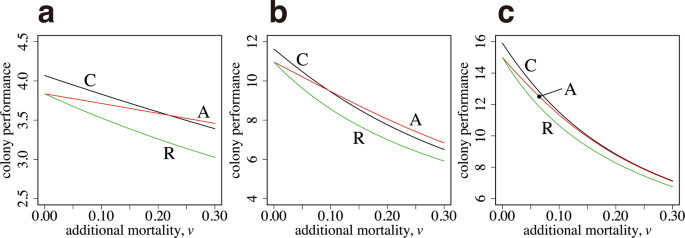
We start with the case in which the performance–size relationships for two tasks, ({S}_{1}(x)) and ({S}_{2}(x)), are equal. Therefore, the optimal body size is the same for both tasks. A curve, labeled as A in Fig. 3a, illustrates the colony output of the case with age polyethism, with the number of new workers ({n}_{3}) and switching age ({a}_{s}) chosen as the optimal values, given the constraint (I=F), the latter being from the need that (I) and (F) must be equal to realize the optimal. The curve labeled as C is the result of optimal caste polyethism, with ({n}_{1}) and ({n}_{2}) chosen to maximize the colony performance (B), given by equation (2). The horizontal axis is (v), which represents the additional daily mortality for foraging. The mortality of workers working within the colony is fixed as (u=0.1). As (v) increases, the colony performance declines but that of age polyethism is always greater than that of caste polyethism. We also calculated a curve, labeled as R, which indicates the performance of “reverse age polyethism”, in which foraging (the activity with a higher mortality) is first performed and then ants switch to work in the colony (the activity with a lower mortality) later in life. The performance is always worse than that of age polyethism with the correct order. Note that if we multiply the same factor to all the rate constants in the model, the qualitative behavior of the model remains the same. What controls the relative advantage of different polyethism in Fig. 3 is the ratio between mortalities (v/u).
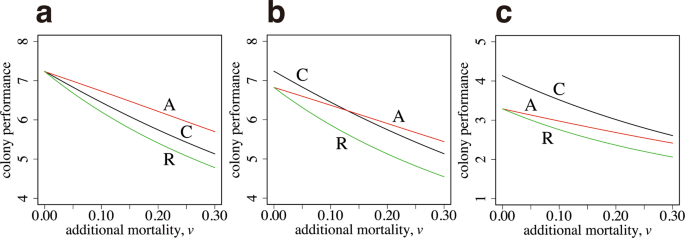
Colony performance of age polyethism and caste polyethism. (a) The task-performance function is the same between the two tasks (({alpha }_{1}={alpha }_{2}=1.0,) ({beta }_{1}={beta }_{2}=1.0)). (b) The optimal size for foraging is larger than that for the in-colony work (({beta }_{1}=1.0), ({beta }_{2}=2.0)). The parameters in (b) are as follows: ({alpha }_{1}=1.0), and ({alpha }_{2}=2.0). (c) The optimal sizes differ more (({beta }_{1}=1.0), ({beta }_{2}=5.0)). The parameters in (c) are as follows: ({alpha }_{1}=1.0), and ({alpha }_{2}=2.0). The other parameters used are as follows: ({a}_{max}=5.0), (u=0.1), and (R=10).
Figure 3b illustrates the case in which the optimal body size differs between two tasks. Two curves, labeled as C and A, cross each other. For a small (v), caste polyethism generates a greater performance than age polyethism. However, for a large (v), age polyethism performs better than caste polyethism.
Figure 3c illustrates the case in which the optimal body size differs significantly between two tasks; the optimal size for foraging is five times larger than that for working within the colony. Caste polyethism performs better than age polyethism for all values of (v) shown in the figure.
Figure 4a illustrates the relative success of the caste specialization over age-dependent task switching in a contour map. The horizontal and vertical axes represent the additional mortality due to foraging (v) and the ratio of two optimal sizes ({beta }_{2}/{beta }_{1}), respectively. The contour map shows that caste polyethism is more advantageous when ({beta }_{1}) and ({beta }_{2}) differ more strongly and when the additional mortality (v) is small; while age polyethism is more advantageous in the opposite situation. Figure 4b illustrates the optimal worker sizes. The horizontal axis represents the ratio of two optimal sizes. If ({beta }_{2}/{beta }_{1}) is small, all workers are of the same size ({x}_{3}); however, if ({beta }_{2}/{beta }_{1}) is large, dimorphic workers are produced with sizes ({x}_{1}) and ({x}_{2}). We can see the transition from single-sized workers (with age-dependent switching of tasks) to the two castes differing in body size.
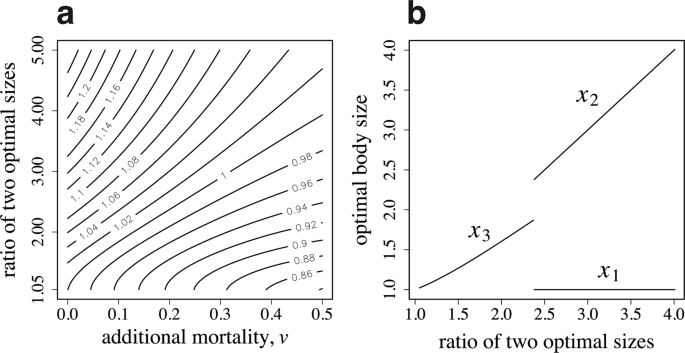
Age polyethism versus caste polyethism. (a) Contour map of the relative advantage of specialized castes to age-dependent task switching. Numbers by the contours indicate the ratio of colony performance (B) of caste polyethism to age polyethism. (b) The optimal size of workers to produce. The parameter used in (b) is (v=0.2). The other parameters are as follows: ({beta }_{1}=1.0), ({alpha }_{1}=1.0), ({alpha }_{2}=2.0), ({a}_{max}=5.0), (u=0.1), and (R=10).
Effect of maximum worker age
The advantage of age polyethism (i.e., performing foraging after the work in the colony) is caused by the existence of the maximum age of workers. This effect diminishes as the maximum age becomes larger. Figure 5 illustrates that, when the maximum age of the workers is very large and only a negligible portion of the workers can reach the maximum age, performing foraging after working in the colony becomes similar in terms of colony performance to performing foraging before working in the colony.
Effect of maximum worker age. This figure is similar to Fig. 3. The maximum worker ages are as follows: (a) ({a}_{max}=2.5), (b) ({a}_{max}=10), and (c) ({a}_{max}=20). Other parameters are the same as those in Fig. 3b.
Growing colony model
We previously focused on the situation of a stationary population. However, in the early stage of colony development, we should consider the optimal polyethism in the colonies that grow exponentially with time. In these colonies, all of the resources obtained should be allocated to produce new workers instead of reproductive individuals. We assume that the production of new workers is limited by the performance of labor by current workers, but not by the egg production capacity of queen(s). Then we replace equation (2) with (R=,{rm{min }}[I,F]), which implies that the amount of resources usable for new worker production is equal to the resources obtained by the colony per day. All of the variables become functions of time (t).
We here assume that the model does not contain density-dependent processes, Then, starting from any initial distribution, the population eventually begins to grow exponentially, in which all of the age classes increase by a factor of ({e}^{rt}), in which (r) is the Malthusian parameter, or the dominant eigenvalue in a dynamics model. The rate of exponential growth is the criterion for colony performance. We search for the optimal task allocation strategy that achieves the maximum value of (r). This logic was proven by Taylor et al.16 and Leon17 in the context of life history evolution. We provide an analysis for the optimal polyethism in SI Appendix C.
Quantitatively, the results are the same as those of the model for stationary populations explained in earlier sections. For example, if the colony consists of two castes specialized for working in the colony and foraging outside the colony, the worker sizes should evolve according to equations (4a) and (4b): exactly the same sizes as those for the stationary colony. Next, the ratio of resource amounts to be allocated to the two castes is inversely proportional to the task-performing efficiency per unit investment; however, the quantities C1 and C2 representing the effective number of days to survive include the time-discounting effect with rate r (see SI Appendix C for details). Equations similar to equations (5a) and (5b) hold, but (R) must be replaced by the supply of resources available for the production of workers, and the ratio must be modified considering the time-discounting factor—a task performed in the future is less effective than the same task performed in the present in an exponentially growing population. A similar modification occurs in a single phenotype with task switching based on age (see SI Appendix C).
Source: Ecology - nature.com
