Hbt. salinarum cell growth during low salt stress and re-inoculation in high salt optimal conditions
In extreme halophiles, low salt conditions elicits the induction of stress response systems suggesting that part of the halophilic population could tolerate significant diminutions of environmental salt conditions. To test this hypothesis, Hbt. salinarum cultures were diluted in growth media containing different NaCl concentrations and growth was measured for 7 days. Cells exposed to 2.5 M NaCl maintained their ability to divide for a few days (Fig. 1). The growth rates, however, were up to 5 to 8 times lower than for control cells in 4.2 M NaCl. Growth then slowed down progressively, suggesting that cells entered a phase similar to a stationary phase. The stressful effect of low salt concentration appeared to be particularly pronounced at concentrations lower than 1.5 M NaCl (Fig. 1A). Below 1.5 M, growth curves exhibit a typical logarithmic biphasic killing pattern described in many bacteria exposed to harmful environmental stress32, which may reflect an initial exponential phase corresponding to a sensitive population and a second phase with a much slower decline curve follow by a plateau. Interestingly, we observed that all stressed cells inoculated into hypersaline physiological medium switch back to a normal growing cell population after a given time period (Fig. 1B), suggesting that recovered cells, including those that have undergone extreme low-salt shock, possess the capacity to multiply again. Cells incubated in 2.5 M started to grow instantaneously. A lag phase of three days was recorded for cells incubated during 1 hour in 0.5 M NaCl (Fig. 1B1) and of 7 days for cells incubated during one week in 1.5 M, 1 M or 0.5 M NaCl (Fig. 1B2). The observations suggest that part of the low salt stressed cells can undergo a reactivation process when they encounter optimal saline conditions.

(A) Normalized cell density of Halobacterium salinarum as a function of time for different salt (NaCl) concentrations. Cells grown in 4.2 M NaCl were harvested then cultivated at 37 °C under aerobic conditions in rich medium with 2.5 M, 1.5 M, 1.0 M and 0.5 M NaCl. (B) Growth kinetics of Hbt. salinarum during recovery. Cells were shocked in 2.5 M (■), 1.5 M (▲), 1.0 M (●) and 0.5 M (x) NaCl for 1 hour (B1) or 7 days (B2) and then were incubated in 4.2 M NaCl for recovery. Growth was monitored as optical density of the culture. Each experiment was carried out in triplicate. Errors bars represent standard errors.
Flow cytometry analysis of Hbt. salinarum cells structural integrity under low salt stress and high salt reactivation
The viability of stressed Hbt. salinarum cells was assessed by flow cytometry analysis33. Mainly used for eukaryote and bacterial analysis, the extreme physico-chemical conditions around Hbt. salinarum were limiting for the application of flow cytometry. The method was tested for the first time on extreme halophiles in this study and we confirmed its effectiveness by using SYTO 9/Propidium iodide staining, a powerful indicator of membrane integrity (LIVE/DEAD™ Baclight™ bacterial viability kit, Molecular Probes)14. Propidium iodide (PI) fluorescent nucleic acid stain identifies damaged cells that lost membrane integrity (PI+) (especially significant considering the key role of the membrane in bioenergetics and maintenance of the electrochemical potential of K+, Na+, and H+ ions33), while SYTO9 DNA labeling distinguishes cells from debris, empty cell ghosts, and DNA-damaged subpopulations (Syto−).
Aspects of different cell populations are shown in scanning and transmission electron micrographs in (Fig. S1). The cell populations were analyzed after 1 hour (Fig. 2A) and 24 hours (Fig. 2B) incubation at 37 °C under agitation in growth media containing 4.2 (control), 2.5, 1.5, 1.0 and 0.5 M NaCl, respectively. As expected, the accumulation of PI+/PI−, Syto− and lytic cells increased proportionally to the diminution of environmental salt concentration and stress duration. After moderate salt stress (2.5 M), however, a significant part of the initial population remained intact, even after 7 days (Fig. 2C). It is noteworthy that after 1 hour in 0.5 M NaCl a significant proportion of the cells retained structural and DNA integrity (Fig. 2A). After a prolonged incubation in low salt concentrations (24 hours and 7 days), the majority of the harvested cells displayed considerable DNA damage and membrane injury (Fig. 2B,C). However, for cells incubated in NaCl 0.5 M for 24 hours or in NaCl 1 M and 0.5 M for 7 days, the (Pi+/Pi−) decreased significantly to reach values close to that of unstressed cells. A possible explanation for these results is that most cells are lysed under these extreme conditions, and the signal is dominated by a small fraction of surviving cells.

Flow cytometry analysis of membrane integrity (PI labeling) and DNA staining (Syto labeling) of Hbt. salinarum cells. The cells were incubated for 1 hour (A) and 24 hours (B) and 7 days (C) in standard growth medium (4.2 M NaCl, control) or in low NaCl conditions (2.5 M, 1.5 M, 1.0 M and 0.5 M At the top, PI+ (membrane integrity) cell populations detected at 645 nm (PI). At the bottom, histograms of Syto9 (DNA labelling) staining showing changes in the fluorescence intensity (at 528 nm) of cells exposed to various salt concentrations. Damaged (Syto−) and undamaged DNA (Syto+) populations are indicated by arrows. Each experiment was carried out in triplicate. Errors bars represent standard errors.
To monitor reactivation, low salt (0.5 M NaCl) stressed Hbt. salinarum samples were subsequently analyzed after harvesting and incubation for 1 and 24 hours, respectively, back in physiological saline medium (Fig. 3). After 1 hour incubation (CR-1h), the (Pi+/Pi−) ratio decreased indicating less membrane damage compared to the initial stressed cells; on the other hand, the Syto− and Syto+ pattern while similar to that of the stressed cells (Fig. 2A) shows a gradual shift towards Syto+ values indicating fewer cells with DNA damage. The tendency is confirmed in CR-24h, in which only one population is observed with undamaged DNA and intact membranes. Taken together, these results indicated that a significant sub-population of Hbt. salinarum cells can maintain its membrane integrity and is competent to recover from low salt stress.
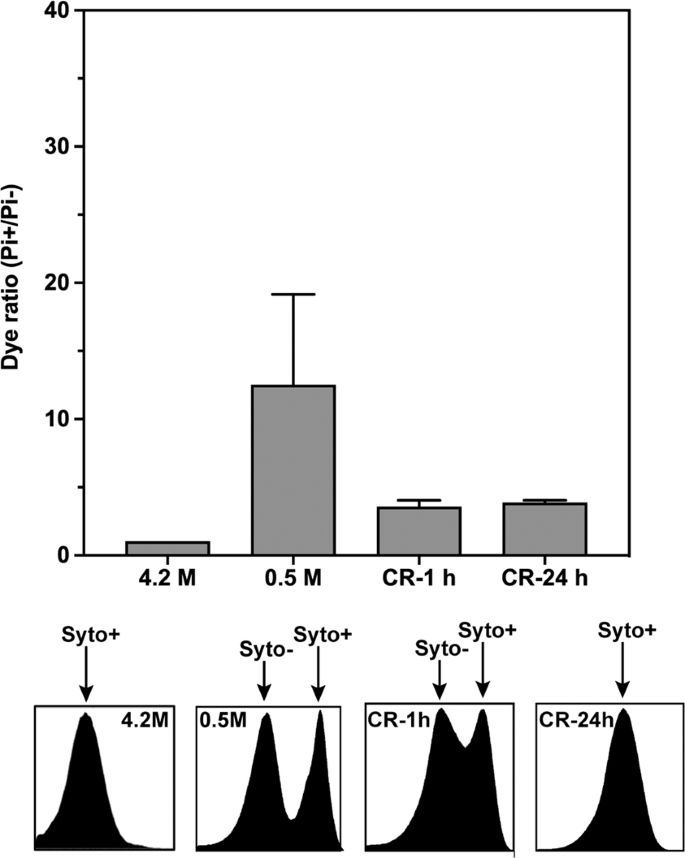
Flow cytometry analysis of membrane integrity (PI labeling) and DNA staining (Syto labeling) of Hbt. salinarum recovered cells. The cells were incubated in 4.2 M NaCl (control) or after low salt shock (0.5 M-1h) for one hour followed by cell recovery in 4.2 M NaCl for 1 hour (CR-1h) and 24 hours (CR-24h). At the top, PI+ (membrane integrity) cell populations detected at 645 nm (PI). At the bottom, histograms of Syto9 (DNA labelling) staining showing changes in the fluorescence intensity (at 528 nm) of cells exposed to various salt concentrations. Damaged (Syto−) and undamaged DNA (Syto+) populations are indicated by arrows. Each experiment was carried out in triplicate. Errors bars represent standard errors.
Time-lapse microscopy of low salt stressed Hbt salinarum cell populations during high salt reactivation
In an exploration of Hbt. salinarum reactivation, we examined the evolution of cell morphology by time-lapse microscopy (Dichroic Interference Contrast imaging; DIC) during recovery in 4.2 M NaCl following incubation in 0.5 M NaCl (Fig. 4) and 2.0 M NaCl (Fig. S2) growth medium for 1 hour. Stressed cells (0.5 M NaCl) exhibited a round shape about 1 µm in diameter during the first 16 hours of culture in hypersaline conditions. At about 32-36 hours small islets of cells regaining the typical rod-like shape of Hbt. salinarum asynchronously appeared. Interestingly, rod-shaped cell formation did not follow classical binary fission, used by most Archaea for cell division. Cell division rather initiated from flat sacculi that eventually acquired conventional rod morphology. The rod-shape cells then elongated and split into two daughter cells. The cycle was repeated as long as cells were cultured under favorable conditions, consistent with growth rates presented in Fig. 1.

Time-lapse light microscopy. Hbt. salinarum morphological changes were monitored during recovery in 4.2 M NaCl growth medium after a low-salt shock (1 h) at 0.5 M. Cells were grown at 37 °C in the microscopy chamber and observed by Dichroic Interference Contrast. Images were collected every 30 minutes over a period of 48 hours.
Assessment of the metabolic state of stressed and reactivated H. salinarum populations
The effect of low salt exposure on respiration is shown in Fig. 5 (light grey bars). We observed that the respiratory sensitivity of Haloarchaea is NaCl concentration and time-dependent. As illustrated in Fig. 5, lower salt concentration led to a loss of respiratory rate; a phenomenon amplified when the incubation time increased. The longer the shock, the higher the minimum value of salt concentration for which respiration rate reached zero. The O2-uptake rate of stressed cells decreased notably for cells exposed to below 1.5 M NaCl for 24 hours or 7 days. The progressive loss of respiration, under these conditions, parallels slow or stopped Hbt. salinarum growth in the same conditions (Fig. 1). Figure 5 also shows the respiration activity of low salt stressed Hbt. salinarum cells incubated back in a high salt medium (dark grey bars). It shows that the respiratory activity increases rapidly after transfer to 4.2 M NaCl physiological medium (Fig. 5, RRA), even for cells exposed for a long time to extreme low salt concentration (Fig. 5C,D). In all cases, respiration increases instantaneously including for the longest shock (7 days) at the lowest salt concentration (0.5 M NaCl). This cannot be the result of undesired contaminations, as demonstrated by control measurements of the recovery medium alone (data not shown). The observations suggested that a significant part of the cell population is still able to produce energy even during a brutal salt shock or when exposed to prolonged periods of stress at moderately low salt concentrations.

Respiration rate of Hbt. salinarum. Respiration activity (RA, light grey) of cells in low-salt shock (2.5 M, 1.5 M, 1 M and 0.5 M NaCl) measured at 1 hour, 24 hours and 7 days and recovery respiration activity (RRA, dark grey) immediately after transfer of stressed cells in standard 4.2 M NaCl medium. Oxygen consumption of cells was determined at 37 °C using a Unisense oxygen sensor. The experiment starts with basal respiration of unstressed cells (HS 4.2). Harvested cells were then exposed to various low-salt concentrations ((A) 2.5 M NaCl, (B) 1.5 M NaCl, (C) 1.0 M NaCl and (D) 0.5 M NaCl) during different periods of time for respiration measurement. Finally, oxygen consumption of recovered cells was measured immediately after incubation of stressed cells in 4.2 M NaCl. Basal respiration of unstressed cells was set to 100% in each case. Results are mean values for three independent experiments. Time on the x-axis corresponds to the low-salt incubation time. Note that different scales were used in figure (D).
In vivo molecular dynamics parameters in low salt stressed and high salt reactivated samples
As discussed previously, the molecular dynamic state of the cellular proteome represents a robust indicator of cellular fitness14,15,31. Macromolecular denaturation through unfolding leads to lower effective force constants indicating less rigid structures. According to in vitro experiments on a model halophilic protein and to our previous work on Hbt. salinarum cells exposed to moderate salt stress (2 M NaCl)15, a drop in intracellular K concentration should induce important damage to the proteome. Here, we performed in vivo neutron scattering experiments to characterize the molecular dynamics parameters of the Hbt. salinarum proteome exposed to low salt.
Samples were measured on the IN13 spectrometer at the ILL (8 µeV energy resolution sampling a 0.1 ns time scale), as described in Vauclare et al.15. Sample preparation for the neutron experiments is described in Materials and Methods. A centrifugation step prior to sample load in the measurement cell eliminated most of cell debris and lysed material. We considered, therefore, that the measured signal was dominated by the fraction of intact cells in the low salt stress samples to provide relevant information on their functional state. The experiments displayed in Fig. 6 correspond to Hbt. salinarum cultures exposed to 2.5 M and 0.5 M NaCl concentrations for 1 hour or 24 hours. The effective average force constant <k’> (N/m) stabilizing macromolecular structures within the cell was calculated from the temperature dependence of mean square displacements (MSD). The <k’> value fell progressively with lower salt concentrations and longer exposure times, indicating a softening of the resilience of macromolecular structures, as observed previously for heat-stressed cells and cells exposed to a moderate low salt stress for 1 h14,15. The scattering vector modulus (Q) range of IN13 extends from 0.3 Å−1 to almost 5 Å−1, corresponding to a length scale from a few ångströms (at low Q) to a fraction of an ångström. The analysis was limited to the low Q end, where the time-length window is appropriate for MSD of macromolecular internal motions as well as the larger fluctuation amplitudes involved in unfolding processes (Fig. S3). Unfolded proteins have been measured by neutron scattering to display lower resilience than folded states34 so that the effective force constants in the low salt samples in Fig. 6 indicated less rigid macromolecular structures, reflecting perturbation in the folding state of a significant part of the Hbt. salinarum proteome. Even if the unfolded structures tended to aggregate, it is not unlikely on the time scale of internal motions that such aggregates would be less resilient than the compact cores of native states34. We subsequently measured the effective average force constants of Hbt. salinarum after 1 hour and 24 hours of high salt recovery (Fig. 7). The 2.5 M NaCl and 0.5 M NaCl concentrations, with further incubation at 4.2 M NaCl for 1 hour, were chosen to represent a moderate and an extreme stress conditions. The <k’> values for the low salt stressed samples are given by the dashed blocks (data from Fig. 6). The <k’> values of the recovered samples (solid grey blocks) have themselves recovered the physiological value of the 4.2 M NaCl control (white block), indicating that a major part of the cells that resisted the low salt conditions had rapidly regained a favorable internal macromolecular environment, a necessary precondition for the recovery of membrane integrity, respiration and viability.

Mean effective force constant <k’> of Hbt. salinarum, for different conditions. Columns represent values for a given salinity and incubation time (1 hour, light grey or 24 hours, dark grey). The white column is the control sample at physiological salt molarity. Errors bars represent standard errors.

Mean effective force constant <k’> of Hbt. salinarum. The reactivated samples (CR, solid grey blocks) are compared to the corresponding value under stress (dashed patterns) and the control (white column). Errors bars represent standard errors.
Source: Ecology - nature.com
