The main and interaction effects for total N, S, and SOC, and extractable P, K, Ca, Mg, and soil pH are presented in the ANOVA table (Supplementary Table S1).The concentrations of studied macronutrients and soil pH did not show evident trends as a function of residue management methods over 20 years (1995-2005-2015), but the macronutrients concentrations and pH differed among the treatments mostly in the top 10 cm soil depth in 2015. Thus, we mostly discussed the macronutrient status and soil pH in the upper 10 cm soil surface in year 2015 i.e. after the application of same treatments for 84 years.
Soil pH
After 84 years of WW-F rotation, FYM plots had markedly greater soil pH than the rest of the CR-LTE treatments in the 0–30 cm soil depth (Fig. 1A,B). The addition of FYM replenishes the soil with basic cations and maintains soil pH. Soil pH at top 20 cm soil depth was significantly lower in the NB90 and SB90 than in the FYM, PV, FB, SB, NB45, and SB45 which can be attributed to the greater nitrification from the ammoniacal N fertilizer in NB90 and SB90 than others. Greater acidity was observed at the 10–20 cm soil depth than the other soil depths in the NB90 and SB90 plots, possibly due to the fertilizer placement in that depth (Fig. 1A,B). We did not observe differences in soil pH between residue burn and no burn plots (excluding FYM and PV plots).
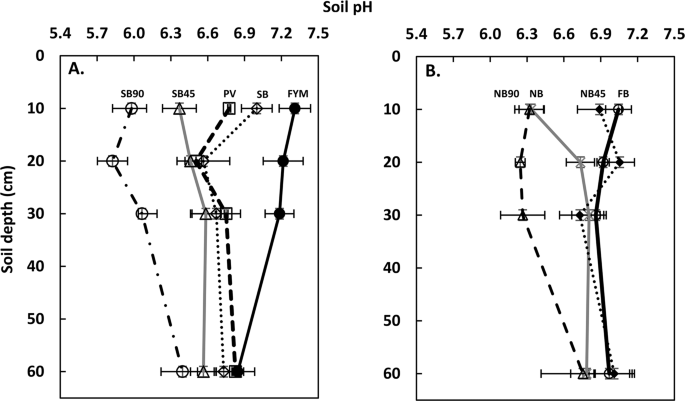
Soil pH depth function as affected by the different agricultural practices of CR-LTE in 2015. (A) PV, FYM, SB, SB45, and SB90. (B) FB, NB, NB45, and NB90. FB = Fall burn; FYM = Farmyard manure; PV = Pea vine; NB = No burn; SB = Spring burn; and 45 and 90 after NB and SB represents the rates (kg ha−1) of inorganic N applications in respective treatments.
Soil organic carbon (SOC) and total N
Although we did not observe any significant trends for macronutrients over the time, remarkably high concentrations of macronutrients were observed in FYM plots. The manure used in FYM plots supplied an average (10 years average) of 1482, 111, 31, 27 kg ha−1 of C, N, P, and S respectively6. In addition to this, typical solid livestock manure contains 2.3, 0.26, and 0.51% of K, Ca, and Mg respectively15. In 2015, the concentration of SOC in the 0–10 cm depth was significantly higher in FYM (14.6 g kg 1) than in the other treatments which were similar to each other (Fig. 2A). Similarly, the concentration of N in the top 10 cm was significantly greater in FYM than in the rest of the plots (Fig. 2B). At 0–10 cm depth, the FYM had a nitrogen concentration of 1.30 g kg−1 whereas FB, which had the lowest N concentration, had 0.76 g kg−1. The FYM plots received extra amounts of carbon and nitrogen along with the other nutrients which can be attributed to the greater concentrations of SOC and N in the FYM plots than the rest of the plots. This increase in N and SOC concentration can be corroborated by the fact that more organic C input to the soil increases the accumulation of organic N16 and reduces its mineralization17. Previous research has shown that manure incorporation increases the soil organic matter and the levels of soil macronutrients and their availability18,19,20,21.
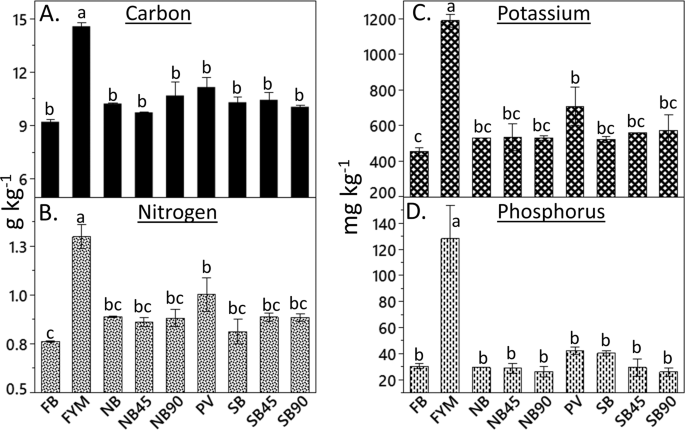
The effect of 84 years of residue management methods on soil nutrients in upper 10 cm soil surface. (A) Concentration of soil organic carbon, (B) Concentration of total nitrogen, (C) Concentration of Mehlich III extractable potassium, and (D) Concentration of Mehlich III extractable phosphorus. Bars sharing the same letter are not significantly different at the 0.05 probability level. FB = Fall burn; FYM = Farmyard manure; PV = Pea vine; NB = No burn; SB = Spring burn; and 45 and 90 after NB and SB represents the rates (kg ha−1) of inorganic N applications in respective treatments.
The decrease in the concentrations of SOC and N in these plots was reported previously8. Similarly, other researchers reported significant SOC and N declines during the 1990s in all the CR-LTE plots except in the FYM plots6,22. Machado et al.23 reported a significant decline in SOC over the time in 0–60 cm depth profile when compared to the SOC level from 1976 to 2005 in the same experiment. However, our results did not show a decreasing trend in 20 years’ time period for any studied nutrients in the CR-LTE plots. With this contradictory finding in SOC between our study and the previous studies in CR-LTE, we can speculate that the 20 years’ time period may be a short time period to manifest significant changes in the nutrient’s dynamics. In semiarid climate like our research site, ecological processes are very slow and takes more than couple of decades to detect marked change in SOC6.
According to Rasmussen et al.22, the application of inorganic N increases SOC compared to no N application because of its positive effect on the amount of crop residue produced. However, we did not observe significant differences in the SOC and soil N concentrations as a function of inorganic N application although significant grain yield differences in these plots were reported for different N application rates6. Similarly, Camara et al.11 reported significant yield differences in different N application rates in other LTE at CBARC. The results from this study agree with a study by Ghimire et al.8 who reported that varying N fertilizer application rates did not affect the concentrations of N or SOC. The plausible reason for unresponsive SOC or soil N to inorganic N application could be due to a rapid decomposition of crop residue in N applied plots compared with the plots without N application. The high N content of the crop residue enhanced residue decomposition when incorporated into the soil6,24. As a result, crop residue contribution was insufficient to significantly impact SOC and soil N in the SB45, SB90, NB45, NB90, SB, and NB plots24. In addition to the rapid decomposition of high N residue, fourteen months fallow period aggravate the depleted SOC pool by depriving the pool with organic matter for prolonged time.
Mehlich III extractable phosphorus (P) and potassium (K) in soil
The concentration of K was significantly higher in the FYM plots than in the rest of the CR-LTE plots (Supplementary Table S2). Potassium in the 0–10 cm soil depth of the FYM plots increased compared to the other CR-LTE plots in 2015 (Fig. 2C). The FYM and PV plots received more K with the addition of organic matter (OM) than the rest of the plots, but K concentrations were significantly higher only in FYM plots (Supplementary Table S2). The FYM plots had 37% greater K concentration in the top 10 cm soil than the K at the same soil depth in PV. The increased concentration of K with the addition of FYM had been reported in other studies25,26. Since manure contains high K, repeated application of manure in the FYM plots could have maintained or increased extractable K compared to the other CR-LTE plots. Another plausible reason for this is that organic manure triggers cation exchange sites to release organic colloids which in turn attracts K from non-exchangeable pools and eventually increases the K availability27.
The concentration of P in FYM plots was significantly higher at the 0–10 and 10–20 cm soil depths than in the rest of the CR-LTE plots for all the studied years (Supplementary Table S3). In 2015, phosphorus concentration in the top 10 cm soil depth was 80% higher in FYM plots than in SB90 plots which had the lowest P among the treatments (Fig. 2D). The reason for greater concentration of extractable P in the FYM plots than the rest of the CR-LTE plots is due to the manure application in the FYM plot. Generally, when manure application is based on N requirement by crop, P and K will be over applied28. Another reason for increased P in FYM plots could be due to the decreased P adsorption to mineral surfaces and improved microbial population with manure addition, which enhances release of readily available P29. Overall, the concentration of extractable P at all studied depths was in the following order: FYM > PV > NB90, with the other treatments being between PV and NB90 (Supplementary Table S3).
Soil total Sulfur (S) and Mehlich III extractable magnesium (Mg)
Among CR-LTE plots, FYM had higher S concentration than the other plots at all depths except in the 30–60 cm depth in 2015 (Fig. 3A,B). Greater S under FYM treatment is plausible because S is an integral part of OM and FYM received more organic matter than the other plots. All other CR-LTE treatments were comparable in S concentration at 30–60 cm depth (Fig. 3A,B).
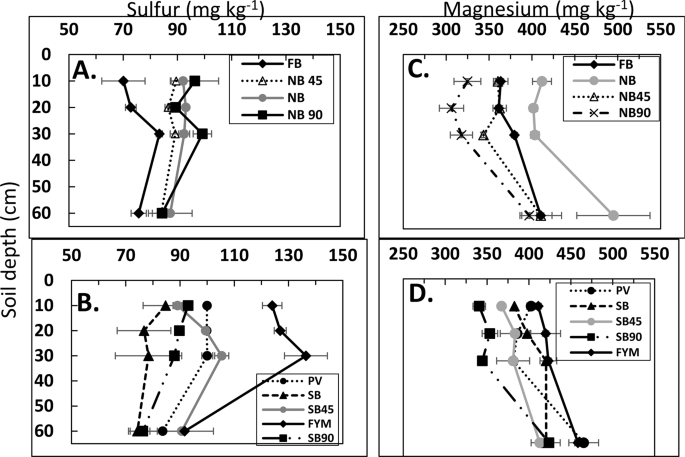
Soil depth function of total sulfur in 2015. (A) FB, NB, NB45, and NB90 plots, (B) PV, FYM, SB, SB45, and SB90 plots. Soil depth function of Mehlich III extractable magnesium in 2015. (C) FB, NB, NB45, and NB90 plots and (D) PV, SB, SB45, SB90, and FYM. FB = fall burn; FYM = Farmyard manure; NB, NB45 and NB90 = No burn with N applied at 0 kg ha−1, 45 kg ha−1, and 90 kg ha−1, respectively; PV = pea vine; SB, SB45 and SB90 = spring burn with N applied at 0 kg ha−1, 45 kg ha−1, and 90 kg ha−1, respectively.
In the 0–10 cm soil depth, the concentration of extractable Mg was greater in the FYM and PV plots than in the SB45, SB90, NB45, and NB90 plots (Fig. 3C,D). The higher amount of extractable Mg in FYM and PV plots could be attributed to the addition of OM through manure or pea vines that directly contributes to the soil Mg. The higher concentration of Mg in 30–60 cm soil depth than in the topsoils could be due to the displacement of Mg by K. Due to the competition between these ions for exchange sites, with K having the larger molecular size than Mg, potassium ion can easily displace Mg30. The concentration of K was greater in topsoils than in subsoils in this study and so, Mg could have been moved to lower soil depth (Supplementary Table S2).
We did not observe differences in soil macronutrients between residue burn and no burn plots (excluding FYM and PV plots) (Supplementary Tables S2–S5). Perhaps the more favorable seedbed temperature and reduced insect/disease incidence in burned plots during germination may have offset the loss of nutrients to the atmosphere caused by burning. Increased biomass yield can be expected from the favorable seed bed and reduced insect/pest incidence. The biomass eventually decomposes and releases several nutrients. However, this benefit of burning could be annulled when residue is burned which increases nutrient loss to the atmosphere. Nevertheless, burning of residue, especially fall burning, is not recommended in the inland PNW as farming in most areas is performed on 8 to 30% slopes (some slopes as steep as 45%) and soils on such slopes can be vulnerable to erosion in the absence of cover for a prolonged period. Burning of residue could also result in erosion-induced nutrient loss over time.
Total concentration of nutrients in wheat grain and straw
There were main and interaction effects of year and treatments on the nutrient accumulation in wheat grain and straw (Supplementary Table S6). Significant treatment effects were observed for total concentrations of C, P, K, Ca, and Mg in wheat grain. Total concentration of C in wheat straw was affected by the treatment. Only the significant effects are discussed below.
Wheat tissue nitrogen (N) and sulfur (S)
Nitrogen and sulfur are two important nutrients for wheat grain and straw because the concentration of N and S determines grain and straw quality. Higher grain N was found in the NB90 treatment compared with plots without inorganic N application (FB, SB, and NB), while N in grain in the NB90 plots was comparable to that in the FYM plots (Supplementary Table S7). The NB90, SB45 and SB90 plots had similar grain N concentrations in 2015 (Supplementary Table S7). In this study, grain N linearly increased with time (Fig. 4A), which could possibly be due to the less rainfall during the 2015 growing season compared with the rainfall in 2005, which was also lower than the rainfall in 1995 (Supplementary Fig. S1). Water stress increases N in grain31.
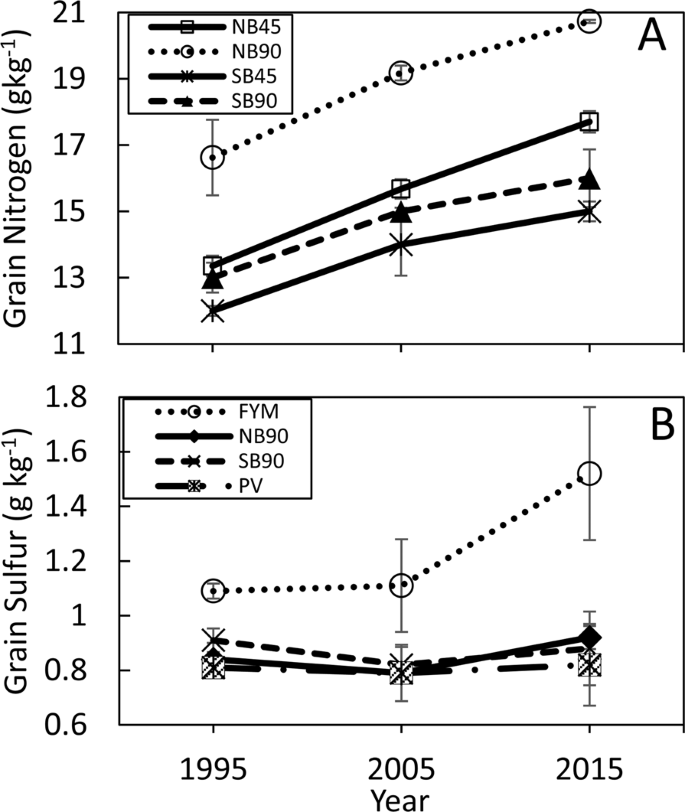
Effect of nitrogen (N) rates on grain N over time (A) and effect of organic amendments and N on grain S over time (B). FB = fall burn; FYM = Farmyard manure; NB, NB45 and NB90 = No burn with N applied at 0 kg ha−1, 45 kg ha−1, and 90 kg ha−1, respectively; PV = pea vine; SB, SB45 and SB90 = spring burn with N applied at 0 kg ha−1, 45 kg ha−1, and 90 kg ha−1, respectively.
Grain S of 1.2 mg S g−1 is considered as the minimum threshold limit for S deficiency in wheat32. The concentrations of S in grain were noticeably higher in FYM plots than the rest of the CR-LTE treatments, and increased from 1995 to 2015 (Fig. 4B and Supplementary Table S7). Only FYM plots had S above the measurement threshold level. Wheat grain has a higher pearling index and decreased dough elasticity when grain S is below the threshold level, which is not a desired trait for marketable grain33.
Wheat tissue carbon (C) and phosphorus (P)
Carbon concentration in wheat grain was affected by treatments and was greater in the SB45, SB90, NB45, NB90 than in FB and SB (Table 1). The accumulation of N in grain has positive correlation with C in the grain34, and SB45, SB90, NB45, NB90 plots had greater N than in FB and SB plots. This could be the reason for greater concentrations of C in the N applied treatments than in the plots without N application. Regarding C in the straw, FYM plots had the highest concentration of C among the CR-LTE (Table 1) suggesting the more pronounced effect of organic N (manure) on C in straw than from inorganic N.
The concentration of P in grain under the FYM (3.21 g kg−1) treatment was significantly higher than that under the rest of the treatments (Table 1). Nitrogen application decreased grain P in both the spring burn and no burn treatments (Table 1), which could be due to the low soil pH in the inorganic N applied plots. Wang et al.27 reported higher P in manure treated soil and subsequently higher P uptake by wheat in FYM treatment. The results from this study agree with the preceding report, as FYM had highest soil P and the highest grain P.
Wheat tissue total cations (K, Ca, and Mg)
Organic and inorganic amendments affected the concentrations of K, Ca, and Mg in grain (Table 1). The FYM plots had higher concentrations of K, Ca, and Mg than in the inorganic N applied plots (Table 1). The results indicate that inorganic N affected the absorption of cations, possibly by the competition of NH4 + (UAN) with K, Ca, and Mg (cations) on the exchange sites and also due to the decreased soil pH. Consequently, low concentrations of K, Ca, and Mg were observed under inorganic N applied plots. The decreased availability of cations in the soil solution were reflected in low cation accumulations in the grain of inorganic N applied plots. Another plausible reason for increased cations in the FYM plots compared to non-organic amended plots is due to the presence of cations in FYM. Applying FYM increases cation availability ion the soils over time. There were no differences in K, Ca, and Mg in grain between residue burn plots and no burn plots (Table 1).
The following inferences can be made from the results of this study:
- (a)
Inorganic N application does neither increase (i) available soil nutrients nor (ii) tissue concentrations of macronutrients over time compared to FYM, and cannot replace FYM application. However, PV application can be replaced by inorganic N application and vice-versa.
- (b)
Excluding FYM and PV plots, both (i) spring burning of plant residues or (ii) no burn treatments have similar impacts on soil and tissue macronutrients over time under dryland WW-F rotation in the PNW.
- (c)
Desirable lower protein content of soft white winter wheat can be obtained by spring burning of residues, but not through “no burn” of residues. The NB90 plots had 12% (2.07% N × 5.8) protein in grain, whereas the SB45 and SB90 (9.4% protein) plots maintained the optimum protein content for soft white winter wheat, which is 9–10%.
- (d)
Soil acidification increased over time by the application of inorganic N, whether the N is applied to burned or unburned residue plots.
Source: Ecology - nature.com
