Systematic review
On the 26th of January 2018 we used Web of Science (version 5.27) to find peer-reviewed research articles from 1900–2018 on plastic ingestion by any organism using the search string ((plastic OR plastics OR microplastic* OR mesoplastic* OR macroplastic*) AND (ingest* OR absorb* OR devour* OR eat* OR digest* OR consum* OR swallow* OR ingurgutat* OR engorg* OR gorge OR graz* OR masticat* OR ruminat* OR prey OR meal OR nourish* OR diet OR sustenance OR gastro* OR stomach* OR intest* OR assimili* OR incorporat* OR embod* OR engulf* OR envelop*) NOT (consumer)) under the heading “Topic”. We searched Science Citation Index Expanded (SCI-EXPANDED) –1900-present; Social Sciences Citation Index (SSCI) –1956-present; Arts & Humanities Citation Index (A&HCI) –1975-present; Conference Proceedings Citation Index- Science (CPCI-S) –1990-present; Conference Proceedings Citation Index- Social Science & Humanities (CPCI-SSH) –1990-present; Emerging Sources Citation Index (ESCI) –2015-present.
The 22,205 records found were listed using the “Relevance” function within Web of Science and the 1999 most relevant results were exported as a.txt file for screening. All 1999 titles were screened for relevance (title screening), and abstracts were also read in cases where the reviewer was unsure. In all cases where the reviewer was unsure, the article was retained for further screening at the next phase (full text screening). To be considered for the Data collection phase (below), an article was required to meet the following criteria: (1) Article seemed like it included some information on ingestion of any type or size of plastic by an organism; (2) article must report on field-based studies where plastics were present in the environment at natural concentrations and size distributions, as lab studies are often non-representative in terms of plastic availability. We excluded reports of plastic consumption by humans and reviews. Only peer-reviewed primary research articles were accepted. Articles found opportunistically after January 2018 were incorporated into the study according to the same inclusion criteria.
Data collection
Articles accepted for data collection reported or illustrated (e.g. via image analysis): (1) the size of the longest axis of ingested plastic (any plastic type) by a taxon of animal or a single animal; (2) the mean or mid-range body length of taxa or individuals containing ingested plastic. We also calculated the weighted-mean of mid-ranges or means provided for specific size-bins of body length as estimates of the wider pool of relevant taxa when the latter was unavailable. Data included as approximations of total body length were reported measurements of capitulum length, curved carapace length, and carapace width. The length of bivalves was recorded as the length of the shell. Descriptions of the exact dimensions measured of animal lengths were often unclear. Here we defined “total body length” as the distance from the most anterior to the most posterior part of an animal. Whether a measurement was classified as “total body length” usually required judgment of the methodology described.
Articles that provided plastic and animal size data for each specimen within a study were relatively sparse. More common were summary statistics for a group of individuals of the same species. Therefore, we prioritised the collection of data on animal species (i.e. groups of individuals). Where data were available for individual animals within a group as well as for the group as a whole, only data for the latter were retained to avoid pseudoreplication. Any data on individual animals were summarised for the lowest ranked taxonomic group possible. Data on single or smaller groups of individuals of greater taxonomic resolution were prioritised over summarised data for higher taxonomic levels.
Where data were available only for subgroups where different plastic measurements were made (e.g. in surface area in some individuals or in lengths for others), we used only data expressed as linear length. Where data were available only for a single animal, summary statistics for a group were replaced with the actual values recorded for that individual. The number of animals in a group was recorded. Where data on an animal were repeated in more than one study, we used the most precise data available only to avoid pseudoreplication.
The largest piece of plastic ingested by a group of individuals is likely to be more representative of the true maximum for an entire population than a single individual. Since matching a specific individual to a specific plastic fragment was seldom possible for groups of individuals, we used the mean body length in relation to a plastic fragment ingested by any group member. We focused on the precision of the relationship between body size and plastic size, by giving precedence to body length measurements of specimens that contained plastics (i.e. not all animals in a study would contain plastics), over data for wider groupings of animals (e.g. the mean body length of all animals in a study).
Ingested plastics were defined as those found in the main digestive tract of an animal via necropsy or tissue digestion. We excluded data on plastics in faeces or regurgitates, live animals or observations of plastic ingestion in behavioural studies. Regurgitated material might reflect material that could not be ingested further into the gastrointestinal tract while faeces would contain only those plastic fragments that could pass through the gastrointestinal tract and not be retained. Where available, the longest axis of the smallest ingested plastic fragment and the type of magnification used to detect plastics, was noted for each record. However, the absence of this information did not disqualify an article. The full set of collated data is provided with this article.
The use of reported values was prioritised, but in their absence, data were also collected on animal and plastic lengths from images using ImageJ (version 1.51J8). Measurements were made of the longest straight axis of a plastic fragment, calibrated according to the scale indicators in images, using a segmented line to measure long, coiled pieces of plastic material. Where coils of plastic could not be discriminated as a single piece, the maximum axis of the coil as a whole was measured. We used the image of highest resolution available. Only plastics that were wholly visible in an image were measured.
Decimal degree latitude and longitude coordinates were approximated from reported coordinates, or site descriptions where coordinates were unavailable, using Latlong. In the case of many sampling sites, an approximate central point was used for all sites in a study.
All species, including one proposed species of fish yet to be confirmed, were classified as “marine only”, “marine and brackish”, “marine, brackish and freshwater” or “freshwater only”, according to FishBase28 and SeaLifeBase29. Any records from SeaLifeBase were classified as “marine only” by default, with additional descriptions of tendencies for brackish or freshwater environments added to fit one of the four water type classifications. If available, data on depth range were also gathered from either FishBase or SeaLifeBase.
Data analysis
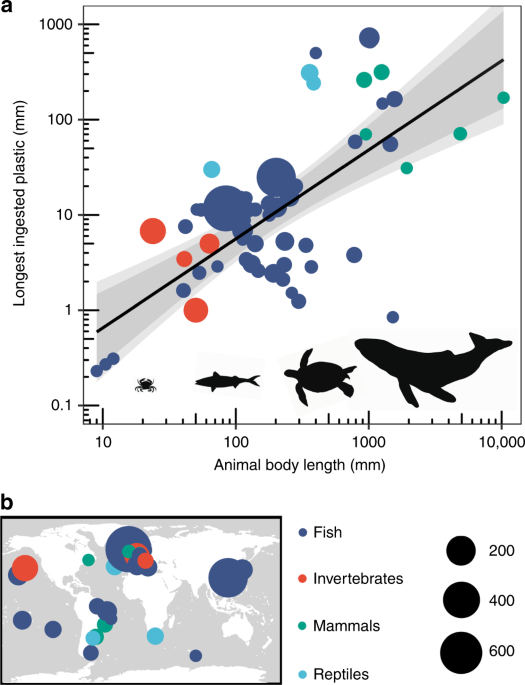
The universal allometric log10-log10 relationship between animal and ingestible plastic size was modelled and visualised as a linear regression using Microsoft Excel (version 16.16.7) and R (version 3.6.1; “Action of the toes”), within the RStudio environment (version 1.1.463).
Validation of the allometric relationship
To validate the plastic-animal size relationship (Fig. 1), we selected a subset of the data at random (10%) and a parameterisation dataset (90%). We repeated this procedure 1000 times to allow for a suitable understanding of the robustness of the allometric relationship and the potential limitations of this data for making predictions. In each instance, the parameterisation dataset was used to construct the allometric relationship, and predictions were made for the collated validation dataset. Predictions for the linear regression were constructed using the ‘predict’ function in the ‘stats’ package (version 3.4.3) in R (version 3.6.1; “Action of the toes”). We then used root mean square of errors (RMSE), in conjunction with a linear regression between predicted and observed values, to compare the predicted and observed data for the validation dataset to understand the relative accuracy of the plastic-animal size relationship for the 1000 simulated iterations.
Plastic ingestion risk for zooplankton
We used the global zooplankton distribution map provided by Strömberg et al.20 to demonstrate the utility of the plastic-animal size relationship (Fig. 1). Strömberg et al.20 combine primary production information with The Coastal and Oceanic Plankton Ecology, Production and Observation Database, COPEPOD30, to produce a map of global zooplankton mass distribution. The body size range of the zooplankton represented is not provided in Strömberg et al.20. To gain this information, we downloaded biometric data for all organisms listed as “zooplankton” on COPEPOD and extracted the size range listed for all organisms. This dataset included measurements of total length and prosome length; the range found to be 0.12–13.5 mm. The animal-plastic size relationship provided herein estimates an animal 13.5 mm in length is able to ingest a piece of plastic 0.86 mm long.
We used the modelled global plastic distribution maps provided by Eriksen et al.8 (Fig. 2 therein) that are separated into four plastic size classes: 0.33–1.00 mm, 1.00–4.76 mm, 4.76–20.00 mm and >20.00 mm. The four map images were imported into ArcGIS (version 10.5.1) in raster format, and georeferenced to a 10 m resolution ocean map sourced from Natural Earth Data (ne_10 m_ocean.shp, https://www.naturalearthdata.com/downloads/10m-physical-vectors/10m-ocean/). Interactive supervised classification of the images produced raster files, and the eight exponential classes of count concentration from 1 to 1,000,000, were transformed into a linear scale using y = 10(6/8)x, which represented the maximum concentration of plastics found in that pixel.
We used the model prediction of global plastic count concentrations (number of pieces km−2) for the size class (0.33–1.00 mm) as the fraction of plastic the zooplankton presented by Strömberg et al.20 may ingest. Using this plastic size classification provides a buffer against underestimating environmental risk by: (1) Using the longest animal body length recorded to specify plastic length (as opposed to the mean size) and (2) exaggerating the maximum size of ingestible plastics to include those up to 1 mm, a buffer of 0.14 mm. To gain a map of all plastics present at the surface of the oceans and seas, we summed the values of the four size class maps presented by Eriksen and colleagues8.
We processed the global zooplankton distribution map image provided by Strömberg et al.20 in a similar way to the plastic maps. The image was imported into ArcGIS (version 10.5.1) in raster format, and georeferenced to the 10 m resolution ocean map sourced from Natural Earth Data. Interactive supervised classification of the image produced a raster file, and the five exponential classes of count density from 0 to 100 were transformed into a linear scale using y = 10(2/5)x, to represent the maximum density of plankton found in that pixel. To understand the fraction of plastics zooplankton can ingest (Fig. 4a), we divided the number of plastic pieces (0.33–1.00 mm in length) by the density (mg C m−3) of zooplankton, to map risk levels. A comparable risk map for all plastics in the oceans (Fig. 4b), was produced by dividing the total number of plastics (sum of all four size classes presented by Eriksen et al.8) by the density of zooplankton.
Reporting summary
Further information on experimental design is available in the Nature Research Reporting Summary linked to this paper.
Source: Ecology - nature.com
