Effects of organic amendments on the temporal variation of soil CO2 emissions
Regardless of organic amendment types and their application rates, SCO2 emission spiked following the organic amendment and then gradually decreased; it reached the lowest levels in three months after the start of the experiment (Fig. 3). Figure 3(a–c) depicts SCO2 emissions, rainfall, and applied irrigation for three organic amendments types, application rates, and control during the study period in growing season 1 (2017–2018), whereas Fig. 3(e–g) depicts the same data for the same treatments during the growing season 2 (2018–2019). A comparison of air and soil temperatures at 5 cm and 50 cm depth during the growing seasons 1 and 2 are detailed in Fig. 3d,h, respectively.
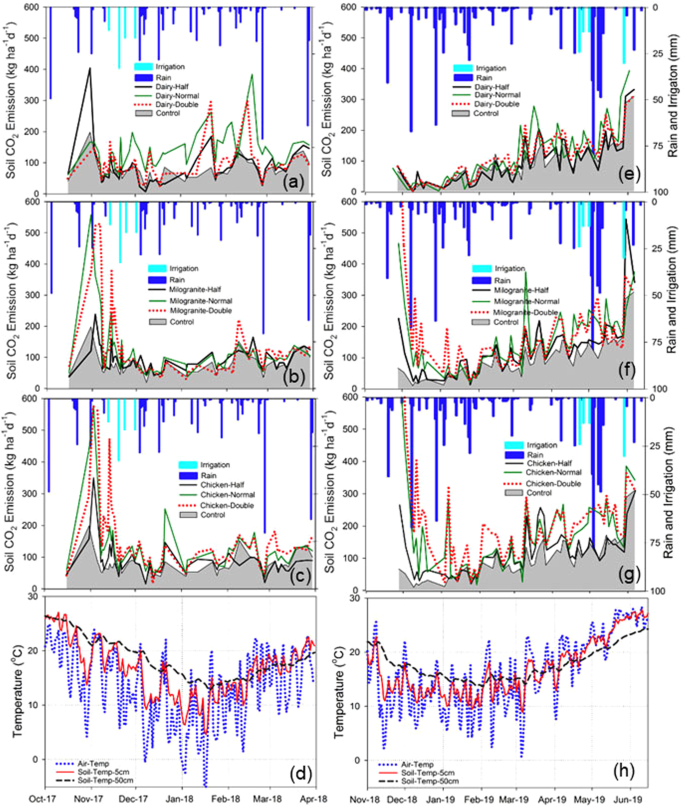
Temporal distribution of soil carbon dioxide emissions, rainfall and air and soil temperatures during the two growing seasons. Figure 3a–c,e–g compare daily rainfall, CO2 emission from control and soils amended with dairy manure, chicken manure, and milorganite, respectively, in growing season 1 and 2. Figure 3d,h compare air temperature and soil temperatures at 5 and 50 cm soil depths, respectively, in growing seasons 1 and 2.
Except for the dairy amendment, both milorganite and chicken amendments showed high SCO2 emission rates following the organic amendment application. On the other hand, medium and high application rate treatments released more CO2 before harvesting compared to the low application rate treatments. High SCO2 emission continued for a week before it started to decrease. Amended treatments had higher SCO2 emissions than the control treatment during both growing seasons. However, soil temperature and rainfall significantly impacted SCO2 spatio-temporal emissions; SCO2 emissions were elevated for amended and controlled plots after each rainfall event and under warm soil conditions. Similar amounts of rainfall were received during the two growing seasons (487 mm-Season 1 and 464 mm-Season 2); however, only season 2 showed an increasing trend in SCO2 emission from sowing to harvesting. There were similar emission rates during the first week of the two growing seasons; however, SCO2 emission rates were consistently higher throughout the second growing season (Fig. 4).
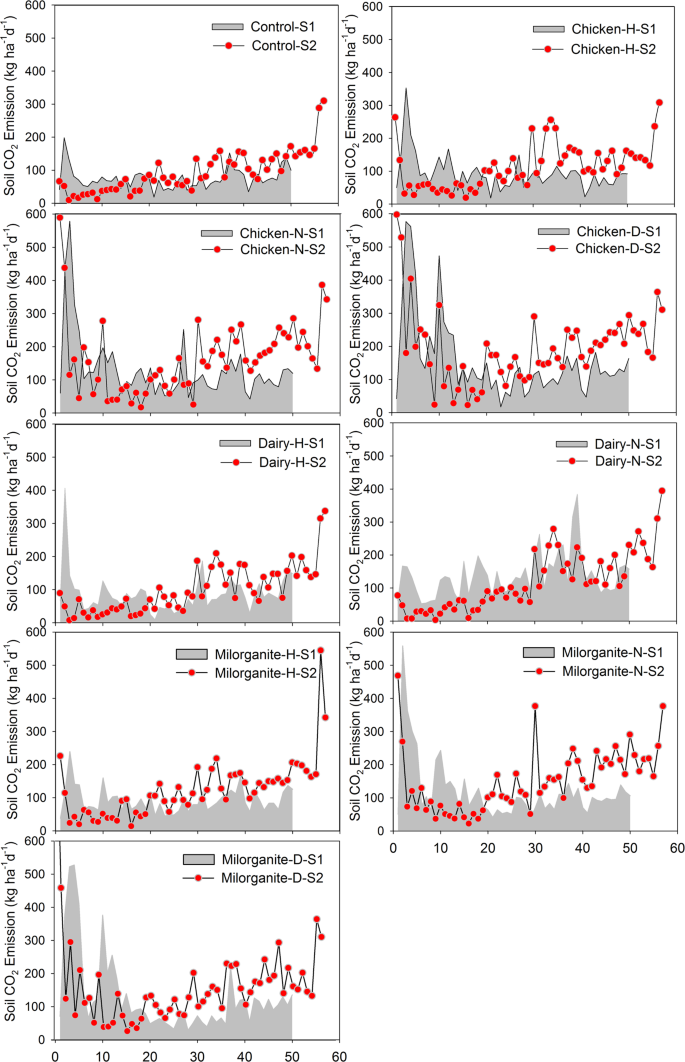
Comparison of soil CO2 emissions during growing season 1 and 2 from sowing to harvesting (x-axis in days) to evaluate the impact of three organic amendments and their corresponding application rates (n = 50 days for growing season 1 (S1) and n = 57 days for growing season 2 (S2)). Note: N = Normal, H = Half, and D = Double application rates.
Effects of organic amendments on the spatial variation of soil CO2 emissions
Spatial variability of SCO2 emission was analyzed for selected dates focusing on before and after plantings, harvesting, and during the growing seasons (Fig. 5). The area within the collar, where the CO2 was measured, was kept the plant free to eliminate any plant respiration impact on measured CO2 emission at each plot. Although the experimental plots might occupy relatively small areas, spatial distribution maps showed high spatial variability in SCO2 emission during the two growing seasons. However, high spatial variability of SCO2 emission was observed during the week when amendments were applied during the two growing seasons (Fig. 5). Results showed high spatial variability after the amendment application on October 31, 2017 (growing Season 1) and November 28, 2018 (growing Season 2). After the amendment application, the impact of organic amendment types and their application rates on SCO2 emission were high. However, season 2 showed higher (101–500 kg ha−1 day−1) SCO2 emission rates than season 1(51–350 kg ha−1 day−1). On the other hand, both seasons showed a gradual decrease in SCO2 emission after the amendment application.
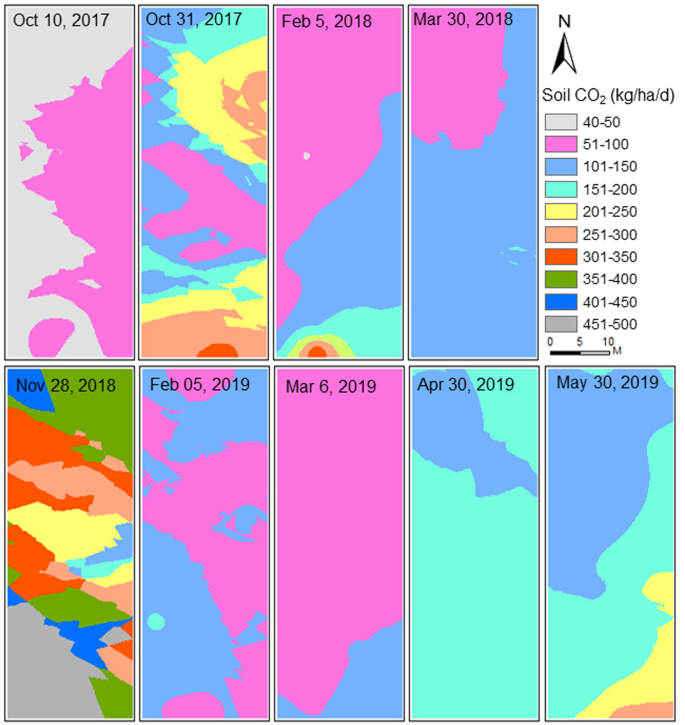
Spatial distribution of soil carbon emissions before and after the application of the organic amendment and during the growing seasons.
The range of SCO2 emission on February 5 of 2018 and 2019 was different, but most of the study areas had SCO2 emission between 51 and 150 kg ha−1 day−1 in two different growing seasons. During growing season 1, the southern portion of the study area showed slightly higher SCO2 emission, which was reduced after February 2018 when the air temperature increased in March 2018. Similarly, during growing season 2, SCO2 emission gradually decreased until March 2019, but gradually increased between March and May 30, 2019, which was our last measurement of the season. For example, the observed range of SCO2 emission ranged from 51 to 150 kg ha−1 day−1 in March 2019 and 101 to 200 kg ha−1 day−1 in April, which was increased to 101 to 300 kg ha−1 day−1 by May 30, 2019.
Effects of organic amendment types and application rates on soil CO2 emissions
Results of this analysis showed SCO2 emissions were significantly (p < 0.01) affected by organic amendments and application rates (Table 3). The analysis also showed all organic amendments and application rates had higher SCO2 emission rates than the control treatments (Table 3 and Figs. 6 and 7). Treatments with the highest chicken manure application rate had the largest SCO2 emission (167 kg ha−1 day−1-season 1, and 205 kg ha−1 day−1-season 2), and treatments with the lowest dairy amendment application rate had the lowest SCO2 emission (87 kg ha−1 day−1-season 1, and 101 kg ha−1 day−1-season 2). However, on average, season 2 had higher SCO2 emission than season 1, except for treatments with dairy at medium application rates. In compared to controls, SCO2 emission increased for each organic amendment and application rate (Fig. 7).
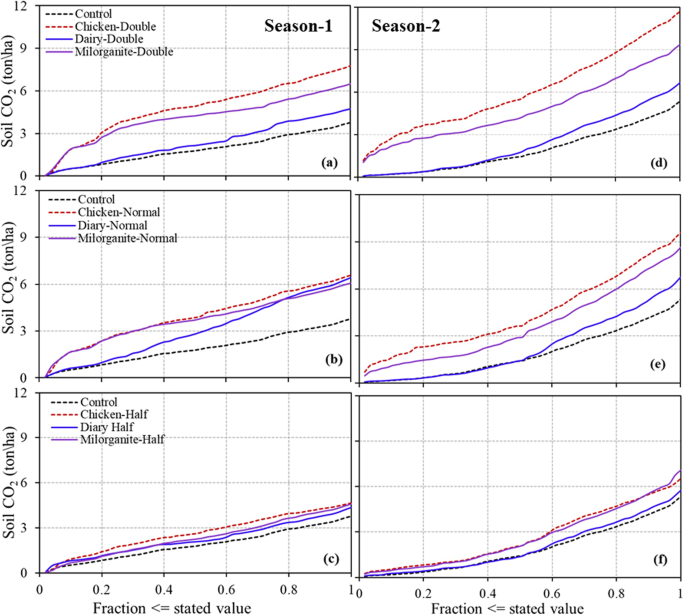
Cumulative soil CO2 emissions in growing seasons 1 and 2 with three organic amendments and three application rates (n = 50 days for growing season 1 and n = 57 days for growing season 2).
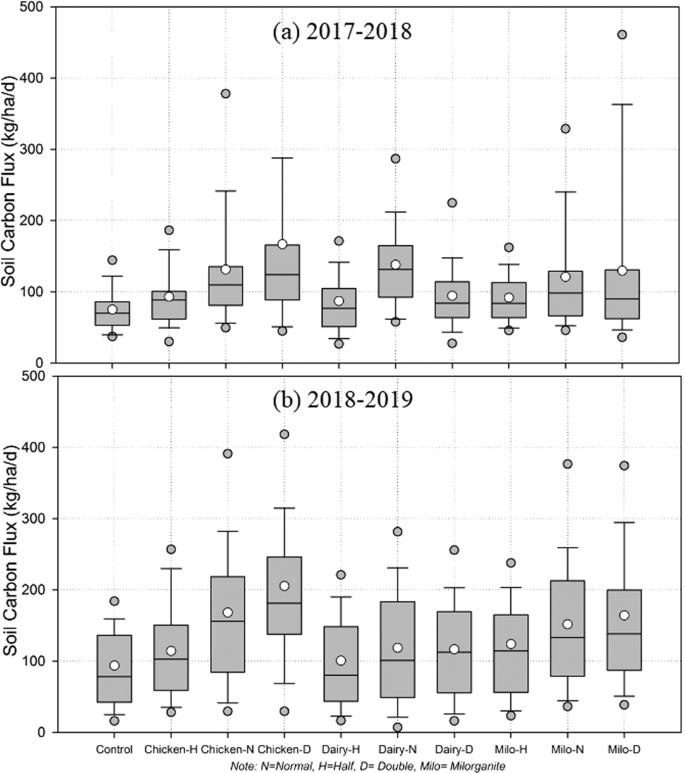
Box and Whisker plots of soil carbon flux from collard greens farm with three different rates and types of organic amendments; (a) growing season 1 (2017–2018), and (b) growing season 2 (2018–2019). Each boxplot presents mean (white circle), median, 25%, and 75% percentiles, and outliers (in a grey circle), describing the distributions of soil CO2 during the growing seasons (n = 50 days for season 1 and n = 46 days for season 2). Note: N = Normal, H = Half, D = Double, Milo = Milorganite.
Growing season 1 showed the highest variability of SCO2 emission on plots treated with chicken at high application rate and lowest variability on controls (Fig. 7, Box and Whisker Plots). On the other hand, there was higher variability in SCO2 emissions for multiple amendments and their application rates during growing season 2. In comparison, all amendments and their application rates during the growing season 2 showed higher variability in SCO2 emissions than growing season 1; however, medium application rates had highest variability during growing season 2. In addition, season 2 showed higher mean, median and range of SCO2 emission compared to season 1. In season 2, all of the amended plots showed a higher range with median application rates, but their means and medians gradually increased with the increasing application rates. However, season 1 had completely different distributions for range, mean and median of SCO2 emission in compared to season 2 (Fig. 7). Soils amended with chicken manure had a higher range at high application rate, and mean and median gradually increased with the increasing amendment application rate, whereas soils amended with dairy manure showed higher range, mean, and medians of SCO2 emission at medium application rate. On the other hand, soils amended with milorganite showed the higher range and mean of SCO2 emission at high application rate but higher median at medium application rate.
Regression analysis showed a good correlation (R2 = 0.67) between SCO2 emission from controls and amended soils with dairy at a low application rate during the growing season 1. All other amendments and their application rates showed low correlation rates (R2 = 0.16 to 0.47); whereas SCO2 emission from multiple amendments and their application rates during the growing season 2 had high correlation rates with SCO2 emission than the control treatments. Carbon dioxide emission from all dairy treatments and low milorganite and chicken application rate treatments showed high correlations than the control treatments (R2 = 0.63 to 0.9) (Table 3). On the other hand, chicken and milorganite with high application rate treatments showed the least/lowest correlations (R2 = 0.03–0.05) with control treatments during growing season 2. In addition, soils amended with chicken and milorganite at high application rate treatments showed poor correlations and higher p-values (>0.01) with control treatments.
Table 4 compares N content for each organic amendments and application rates during two growing seasons and pH values at the end of the first growing season. Results showed the difference of N content between control and amended plots were small during both growing seasons. Control plots showed a slight decrease in N in the second growing season compared to the first growing season at both depths. The N content of the top and deep soil layers was 0.41 g N kg−1 during the first growing season, whereas those layers had 0.29 and 0.28 g N kg−1 during the second growing season, respectively. In comparison, none of the amended plots showed significant higher N content than control treatment plots during both growing seasons. However, in comparison, all of the amended plots showed higher nitrogen content than control treatment during the second growing season. The observed N contents of the topsoil layer amended with dairy manure and milorganite at were increased by the second growing season, however, N contents were decreased amended with chicken manure. On the other hand, all of the amended plots of the deep soil layer, except amended with milorganite at low application rates, showed lower N content by the second growing season.
All of the amended plots including control treatments had higher pH at the topsoil layers than the deep soil layers. The plots amended with dairy manure and milorganite showed an increasing trend in pH with the increasing application rates at both soil layers except plots amended with milorganite which showed a decreasing trend from medium to a high application rate. However, plots treated with chicken manure showed a decreasing trend from low to medium application rate and increasing trend from medium to high application rate at both soil layers. Plots amended with dairy at high application rate showed the highest pH (slightly alkaline, 7.21) in the topsoil layer, whereas plots amended with milorganite at high application rate showed lowest pH (acidic, 5.24) in the deep soil layer.
Cumulative SCO2 emissions from all of the amended plots were higher than those from respective un-amended (controls) plots during both growing seasons (Fig. 6). However, season 2 had higher cumulative SCO2 emissions than season 1 from both amended and un-amended plots. For example, treatments of season 2 had 24% to 35% higher cumulative SCO2 emissions than those of season 1. This difference was only 5% higher during season 2 than season 1 for the dairy manure treatment at medium application rate. Soils amended with chicken manure at all application rates showed the highest cumulative SCO2 emissions in both seasons except for s amended with chicken at low application rate, which had lower cumulative SCO2 emission than soils amended with milorganite at low application rate during season 2. Similarly, soils amended with dairy at all application rates showed lowest cumulative emissions compared to milorganite and chicken amendments during both growing seasons except soil amended with milorganite at medium application rate, which had lower cumulative SCO2 emission than soils amended with dairy at medium application rate during growing season 1. Cumulative SCO2 emissions rates were directly proportional to the rate of application for all of the three treatments (Fig. 6).
Relationships between soil CO2 emissions, total soil organic carbon, temperature and rain
Spatio-temporal variations of SCO2 emission are influenced by climatic parameters (e.g., temperature, and rain) and hydrologic parameters (e.g., soil moisture). The results showed rain and soil temperature influenced SCO2 emission during the growing seasons (Figs. 3 and 4). Relatively warmer air and soil temperatures, especially in April and May, resulted in higher SCO2 emission during the second growing season than the first growing season. Since air temperature influences soil temperature, seasonal variations in soil temperature rely on air temperature. However, although air temperature frequent had higher and lower peaks than the soil temperature, on average, both surface and deep soil temperatures were found warmer than the air temperature during the growing seasons, which might have impacted SCO2 emission. In addition, the combined effect of rainfall and warmer soil and air temperatures could explain the higher SCO2 emission during the second growing season.
Air and soil temperatures were almost consistently higher during the second growing season than those of the first growing season except in November and March. Monthly average air temperature in December 2017, January and February 2018 were 9.5, 6.2, and 13.6 °C, whereas temperatures of the same months during the second growing season (December 2018, January, and February 2019) were 12.2, 10.4, and 13.6 °C, respectively. However, surface and deep soil temperatures were higher in season 1 than season 2. Since the second growing season was warmer than the first growing season, higher SCO2 emission in season 2 indicates air and soil temperatures had more impact on SCO2 emission than the rainfall. In addition, the results showed an increase in SCO2 emission with the temperature rise from February to April (Figs. 3–5).
Control plots showed a decrease in total organic carbon (TOC) in the deep soil layer (16–30 cm) compared to the topsoil layer (0–15 cm) during both growing seasons. The TOC of top and deep soil layers were 3.35 and 3.24 g C kg−1 during the first growing season, whereas they had 2.67 and 2.62 g C kg−1 during the second growing season, respectively. In addition, TOC of the control treatment plots during the second growing season was lower than the first growing season. In contrast, the observed TOC was higher than that of the control treatment during the second growing season for most of the amended plots with different application rates. However, plots amended with chicken manure at high application rate at both soil layers, amended with dairy manure at low application rate at deep soil layer, amended with chicken manure and milorganite with medium application rates at deep soil layers had lower TOC during the second growing season than the first growing season (Table 5).
With respect to control treatments, between growing seasons 1 and 2, the highest increase in TOC (3.63 g C kg−1) was observed in the top (0–15 cm) soil layer of the dairy manure treatment with high application rates; whereas the lowest increase in TOC (0.03 g C kg−1) was observed in the deep (16–30 cm) soil layer of the treatments amended with chicken manure at high application rates. On the other hand, a small decrease of TOC (−0.03 g C kg−1) was observed in the topsoil layer amended with chicken manure at the high application rate.
Source: Ecology - nature.com
