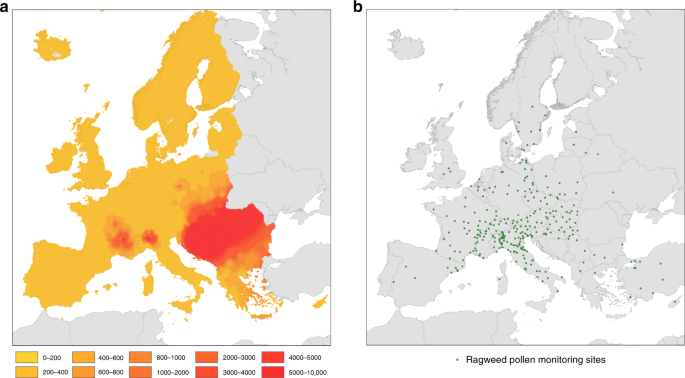
Ragweed pollen exposure map
The estimates of ragweed pollen exposure in Europe are based on the best available information on long-term exposure to Ambrosia pollen for the period from 2004 to 2012. The data were obtained from published work of the mean seasonal total Ambrosia pollen integrals from 296 observational sites found in most large urban regions of Europe (Fig. 1b). We incorporated data from all sites where seasonal pollen integrals cover at least five years in order to secure sufficient data points near and outside the main invasion fronts of A. artemisiifolia (Supplementary Note 1). The final dataset with 296 calibration points for Ambrosia pollen exposure both within and outside the EU was interpolated to a 10 × 10 km2 grid using the common European Geographical Reference System (GCS_ETRS_1989). The gridded data were then extracted for the study area which covers 42 countries within Europe and includes EU27 and the bordering non-EU member countries Albania, Serbia, Macedonia, Bosnia-Herzegovina, Kosovo, Montenegro, Iceland, Norway and Switzerland (Supplementary Fig. 1).
Map of ragweed sensitisation among the European population
The map of ragweed sensitisation rates among the population in Europe is based on a combination of two types of published studies: (a) overall sensitisation rates among the general population obtained from medical centres and (b) ragweed sensitisation rates among sensitised patients collected from medical centres. A thorough review of all European studies was conducted and all peer-reviewed studies based on skin prick and circulating specific Immunoglobulin E (IgE) testing were included, while questionnaire studies were excluded. The review provided 50 data sets on the sensitisation rate among the general population and 80 data sets on ragweed sensitisation among the sensitised population (Figs. 2b, 2c; Supplementary Note 2; Supplementary Data 2).
The two data sets (50 areas and 102 areas) were then interpolated to a 10 × 10 km grid using the common European Geographical reference system (GCS_ETRS_1989). After that, the gridded data were extracted for the study area. Resulting Ambrosia sensitisation rates among the European population were then calculated by multiplying the gridded overall sensitisation rates among the population with the ragweed sensitisation rates among sensitised persons. We used natural breaks in the data to classify the exposure and population data (Figs. 1 and 2). Considering that only a proportion of patients with positive skin prick test reactions express symptoms, we calculated the clinically relevant sensitised population by multiplying the ragweed sensitised population with the clinically relevant ragweed sensitisation rates at the country level15. When determining the population with clinically relevant sensitisation that was exposed to ragweed pollen prior to the establishment of O. communa, we excluded all locations with very low seasonal ragweed pollen estimates (<10 grains per cubic metre during the pollen season12).
Relationship between seasonal Ambrosia pollen integrals and patient numbers
The relationship between the seasonal Ambrosia pollen integrals and the number of patients was calculated with information from the database compiled by the ‘Agence régionale de santé Auvergne-Rhône-Alpes’ (www.auvergne-rhone-alpes.ars.sante.fr/) on health costs related to common ragweed allergies in the Rhône-Alpes region. The Rhône-Alpes region, which is since 1 January 2016 part of the new region Auvergne-Rhône-Alpes, lies in southeastern France and covers an area of 43’700 km2 with approximately 6.5 million inhabitants. The Rhône Valley, which runs north-south through the Rhône-Alpes region, reports the highest common ragweed infestation rates in France10 and, together with the Pannonian plain and Northern Italy, also the highest rates in Europe25.
Since 2007, the Regional Health Agency, in association with the National Aerobiological Monitoring Network, has been collecting data on the annual health costs of ragweed allergies in the Rhône-Alpes region26. These cost calculations are based on the consumption of medical care and medical goods by persons affiliated to the general health insurance scheme and cover 98.9% of all patients. The included costs relate to allergy medication, doctor consultations, allergy tests, oral desensitisation treatments and sick leave when linked to the prescription of anti-allergy drugs during ragweed flowering season (see Supplementary Data 3 for further explanations). The relationship between total seasonal ragweed pollen integrals and number of patients was calculated for the period 2007–2015 using data from all 313 communities in the Rhône-Alpes region (Supplementary Fig. 5). The number of patients is defined as the number of persons receiving reimbursement through the general health insurance scheme for purchasing anti-allergy or anti-asthma medication to treat allergies during the ragweed pollen season from July 7 to October 2126.
We interpolated the community-level pollen exposure from pollen data for 62 monitoring sites in France (Supplementary Fig. 3), using the same approach as for the calculation at the European level. Instead of interpolating the annual total pollen integrals at the grid-cell level, we used the community centroid as the central point for interpolation. We found the highest exposure in the area around Lyon and the area on both sides of the river Rhone which is consistent with the habitat preferences of the plant27 (see Supplementary Fig. 4).
The method for estimating the number of patients is likely to represent the lower bound of the overall effect since only those persons were included which were reimbursed for the consumption of allergy-related medication.
Besides A. artemisiifolia, some other plant species flowering in late summer or autumn also possess allergenic pollen, which may theoretically pose some challenges for allergy epidemiological studies. However, in southeastern France, the two other ragweed species (Ambrosia trifida L. and A. psilostachya DC.) are rare. Moreover, peak flowering of allergenic mugwort species, such as Artemisia vulgaris L., A. absinthium L. and A. verlotiorum Lamotte, is before and after the peak flowering season of common ragweed, and the season of airborne Artemisia pollen hardly overlaps with the season of airborne Ambrosia pollen28. Moreover, seasonal pollen integrals for Artemisia pollen are far lower in southeastern France (Supplementary Fig. 4b) and northern Italy (Supplementary Fig. 6d) than those for A. artemisiifolia and thus only marginally contribute to the consumption of allergy-related medication in these regions (Supplementary Note 3).
To obtain an estimate of the treatment effect, we averaged the total seasonal pollen integrals and the number of patients for each community and the period 2007–2015. We then log-transformed the data and estimated the relationship without a constant using the linear least squares approach. This approach forces the regression to go through the origin which is a necessary condition for modelling the causal relationship between pollen counts and patient numbers. Overall, the specified regression model fits the data well and explains a significant share of variation (Supplementary Fig. 5).
Impact of O. communa on pollen production
In 2014, we selected three sites in northern Italy where A. artemisiifolia and O. communa co-occurred (Corbetta: N45.4709 E8.9368, Magnago: N45.5707 E8.7855, Grugliasco: N45.0654 E7.5923). Half of each site was assigned to experimental exclusion of O. communa in an experimental block design, except for the site in Corbetta for which we did not obtain permission to apply insecticides. In each site-treatment combination, 14 permanent plots of 0.5 × 0.5 m2 were installed covering the range of Ambrosia densities in June 2014 after ragweed had successfully established, and ensuring similar densities across treatments within sites. Starting in July 2014, beetles were experimentally excluded from the blocks assigned by the biweekly application of insecticides while control blocks in these sites were treated with water only. In 2015 and 2016, treatments started in May (corresponding to the period where the first beetle generation of offspring from the overwintering adults develops) and lasted until O. communa disappeared from the sites in autumn. The insecticide treatment constituted of spraying three insecticides (including two contact insecticides and a systemic insecticide; for further details see Lommen et al.29). This method has no direct effects on seed and pollen output or pollen allergenicity of A. artemisiifolia29.
As a proxy for the yearly pollen production per plot30, we estimated the total raceme length rper plot in 2015 and 2016 following (r = n , ast , m , ast e^{v , ast , beta + alpha }), where (n) is the total number of A. artemisiifolia plants in the plot at the end of the season in September (excluding the new seedlings that had just appeared in Magnago in 2015 and which did not produce pollen anymore), (m) is the fraction of these A. artemisiifolia that had matured per site-treatment combination (as a proxy for the fraction of plants that had produced racemes), (v) is the mean log-transformed volume of the matured A. artemisiifolia in the plot (based on all or a sample of ca. 10 plants measured in the plot (N = 47 plots), or the site-treatment mean if no plants in the specific plot had been measured (N = 23 plots)), and (alpha) and (beta) are the intercept and the slope, respectively, of the linear relationship between the log-transformed total raceme length and the log-transformed volume of individual matured A. artemisiifolia, as assessed by a sample of 21 plants taken outside of the plots per site-treatment combination. The analysis excluded plots that contained no A. artemisiifolia plants in 2014 (as these may represent the absence of a soil seed bank), and all plots in one block in Grugliasco where grasses dominated and suppressed ragweed occurrence after 2014. As too few mature plants were available in Corbetta and Magnago in 2016, the respective raceme-volume relationships from 2015 were used instead. The estimated raceme lengths per plot were rescaled to represent racemes per square metre.
Since many plots were estimated to produce a raceme length of 0 (i.e. no racemes), we took a hurdle-model approach for the statistical analysis of the effect of treatment on the raceme length per plot. As in 2016 none of the control plots and all of the insecticide-treated plots produced racemes, we could only do this for the data from 2015. We first assessed the effect of treatment on the probability of a plot producing racemes in 2015 by a generalised linear mixed effect model (GLMER) with treatment as a fixed effect, site as a random effect, and a binomial error distribution, tested against the corresponding null-model. For those plots producing racemes in 2015, we then similarly assessed the effect of treatment on the total length of racemes produced by a GLMER with treatment as a fixed effect, site as a random effect, and a Poisson error distribution with a log-link, which was tested against the corresponding null-model. The models were then used to obtain fitted estimates of the probability to produce racemes and the total length of racemes produced for each treatment, and their product was an estimate of the density of racemes produced (in cm per m2).
In 2015 the insecticide treatment increased the probability of a plot to produce racemes from 0.26 (95% CI = 0.14–0.42) to 0.84 (95% CI = 0.37-0.98; χ12 = 17.496, p < 0.001). When considering plots with raceme production, insecticide-treated plots produced significantly higher densities of racemes than control plots (fitted average 905 cm/m2 versus 260 cm/m2, respectively; χ12 = 6573, p < 0.001). As mentioned above, in 2016 only insecticide-treated plots produced racemes (Fig. 3).
Species distribution models for A. artemisiifolia and O. communa
We collected occurrence data for A. artemisiifolia and O. communa worldwide from the literature, from online resources and from additional occurrence sources (see Appendix S2 in Sun et al.13). In summary, we used WORLDCLIM current climate data (developed by Hijmans et al.31) at 5-min spatial resolution to derive a set of meaningful predictors that are considered critical to plant or insect physiological function and survival of both species. The final model for A. artemisiifolia included annual mean temperature, isothermality, temperature seasonality, max temperature of warmest month, min temperature of coldest month, temperature annual range, mean temperature of driest quarter and an approximation of GDD based on monthly average temperatures (Thom’s formula). The final model for O. communa included max temperature of warmest month, temperature annual range, mean temperature of driest quarter, mean temperature of coldest quarter, precipitation of wettest month, precipitation of wettest quarter, precipitation of driest quarter, precipitation of coldest quarter and standard insect growing degree days (GDD > 13.3 °C as the minimum development threshold temperature for all immature stages according to Zhou et al.32)13. We modelled the current potential distribution for each species in Europe using the integrative modelling framework Biomod2 R-package33. The combination of different modelling techniques generating an ensemble of predictions is proposed as an optimal solution for dealing with the uncertainties of extrapolation34. Generalised linear models (GLM), generalised boosting models (GBM), random forest (RF), and maximum entropy (MAXENT) were therefore calibrated on a random sample of the initial data (80%) and tested on the remaining data sets (20%) with both the receiver-operating characteristic curve (ROC) and the true skill statistic (TSS). We then estimated their area under the curve (AUC) that evaluates the discriminatory power of model predictions. Above techniques were chosen because they have proven to presently be among the most effective species distribution models35. Duplicated presences within a raster pixel were removed. As only occurrences were available, random pseudo-absences were generated36 to fill the absence component of models. The entire training-evaluation procedure was repeated 100 times (25 times for each model), using a different set of calibrated presences and absences within each iteration to ensure robustness of the predictions and provide uncertainty estimates37. A stacked assemblage of predictions across individual models including mean, inferior confidence interval, superior confidence interval of both A. artemisiifolia and O. communa were generated. The suitability of species distributions of two species were then binary-transformed using species-specific thresholds maximising the rate of the number of corrected predicted presences to number of false absences (i.e., to transform the probabilities of presence into presence and absence). Based on these thresholds, we also binary-transformed all confidence interval predictions (Supplementary Fig. 7), which were later used for uncertainty estimation. In our models, AUC ranged from 0.87 to 0.96 across the two species and four model types, which provided useful information for an analysis of climate suitability through modelling of the species distributions. Finally, the overlap maps of O. communa on its host plant A. artemisiifolia that we used for later computations were produced based on their binary mean distribution maps, binary lower confidence interval maps and binary upper confidence interval maps (BIOMOD_EnsembleModeling function in Biomod2)13.
The number of generations of O. communa across the potential distribution in Europe was estimated by experimentally assessing the temperature-dependent developmental time of O. communa along an altitudinal gradient in the Southern Alps, approximately 50 km north of the Milan area. The five field sites were set up on sun-exposed grasslands or in private gardens at 130 m (in the Po plain), 250 m, 480 m, 700 m and 1230 m. Greenhouse-reared, potted A. artemisiifolia plants were exposed to female O. communa in a field cage set up at the lowest elevation. Plants with freshly laid egg batches were individually covered with a gauze bag, firmly attached to the pot with an elastic ribbon, and transferred within 48 h after oviposition to one of the five field sites in a randomised order. At the field site, A. artemisiifolia plants were placed within a 1 × 1 × 2 m gauze cage, dug together with the pots into the soil and regularly watered. Two cohorts of 5–8 plants each were transferred to the five field sites, with the exception of the highest site, which only received plants from the second cohort. The first cohort was set up between 29 June and 2 July 2016 and the second cohort between 8 and 10 August 2016. Each field site was visited at least once a week to record the presence of beetle life stages on each A. artemisiifolia plant. Based on the field study, we calculated an average GDD > 13.3°32 of 288.7 for the period from the egg stage to adult emergence of O. communa (Supplementary Data 8). This value closely corresponds to the GDD reported for O. communa by Zhou et al.32 which was based on growth chamber experiments with constant temperature regimes (307.2). We then used the GDD calculated from our field experiment to map the number of generations of O. communa in relation to the climatic conditions within its potential distribution range in Europe.
Impact of O. communa on airborne Ambrosia pollen concentration in Europe
To quantify the potential impact of O. communa on seasonal pollen integrals in Europe, we exploited retrospective data from northern Italy. We used data on ragweed pollen concentration (number of pollen per cubic metre of air) with a daily resolution for three monitoring sites in the Milan area for the period 2004–2018. The sites are located in proximity (less than 30 km) to the Malpensa airport, where the beetle was initially detected in 2013. Because common ragweed was already established in all potential habitats before the beetle’s arrival, we can calculate the pre-treatment exposure and compare it with the post-treatment exposure. For this purpose, we first obtained a measure of the average daily pollen integral for each station during the two periods and then calculated the average of pollen integrals over the three monitoring sites. Supplementary Fig. 6 shows the average impact of O. communa on daily pollen integrals in the Milan metropolitan area. The average impact of the beetle on ragweed pollen exposure is 86.3%, which implies that the average pollen integrals dropped from 46.2 to 7.5 pollen grains per cubic metre of air. We used this information to estimate the empirical reduction function of pollen concentration due to O. communa. For this purpose, we cumulated the daily pollen integrals before the arrival (2004-2012) and calculated the reduction in pollen concentration at the respective level of pollen concentration in the pre-arrival period. The impact of the beetle is stronger for the lower range of annual pollen concentration (above 90%) and levels out at 83.7% for the higher range (Supplementary Fig. 6b). In terms of human exposure to ragweed pollen, this resulted in a reduction of the number of days with ragweed pollen and reduced pollen integral during days with ragweed pollen (Supplementary Fig. 6c).
In Northern Italy, the population density of O. communa and the feeding damage increased significantly in August, which corresponds with the end of the beetle’s third generation. We thus assumed that all projected areas with at least three beetle generations face the same reduction in total seasonal ragweed pollen integrals as in the Milan area (86%; Supplementary Figs. 6a and 8). For areas with one or two generations we assumed a reduction in seasonal Ambrosia pollen integrals by 30%, due to a likewise reduction in plant densities by early feeding damage that is not compensated for during the growing season (Lommen, unpubl. results). For all other areas, we assumed no effect of O. communa on seasonal Ambrosia pollen integrals.
Reporting summary
Further information on research design is available in the Nature Research Reporting Summary linked to this article.
Source: Ecology - nature.com
