Sample material
In this study, we selected complex geochemical mixtures of various nature (marine, terrestrial, man-altered) and with a high diversity in their properties.
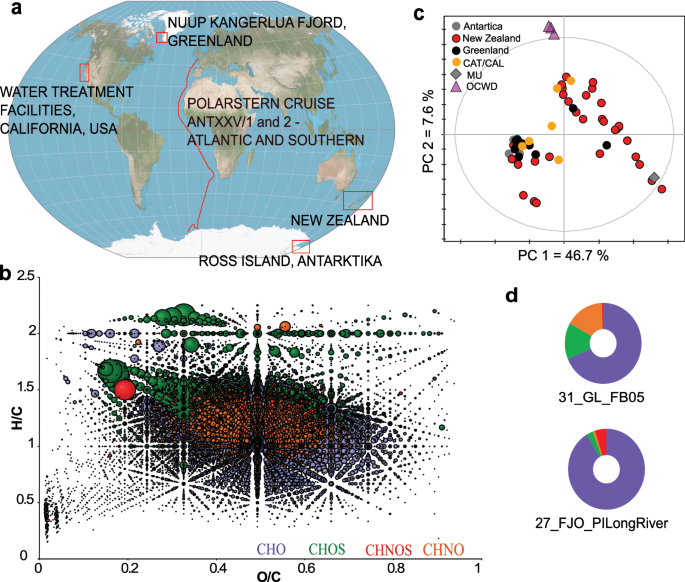
The sampling area and optical properties of water samples collected in Fiordland National Park (NZ) was previously described in detail37,48. Samples were collected at various depths within Doubtful sound, Dusky sound and Preservation inlet. Sampling was undertaken in Austral winter, but the low salinity layer (LSL) was still present which demonstrates the high amount of freshwater transported into the fjords, even under unstable stratification conditions. Photochemical effects were likely to be very minimal and the collected material was mainly subject to microbial transformations. Surface fjord waters started to freeze over at some places and water temperature ranged from 0 °C at the surface to 12 °C at depth in the fjords. Dissolved organic matter (DOM) in New Zealand fjords is derived from pristine low elevation evergreen temperate rain forests and higher elevation evergreen beech forests. The production of organic matter, leached out from soils by high rainfall volumes, is enormous and strongly colors the LSL that sits on top of clear ocean waters37,48.
Further samples were collected in the Catlins region (NZ) and the Catlin River (NZ). This river drains a low elevation temperate rainforest on the East Coast of the South Island of New Zealand. Lake Wilkie is also located in the Catlins and is a coastal highly colored small lake dominated by sphagnum moss species. Samples from the low elevation temperate rainforest were collected on the West Coast of the South Island (NZ) in the so-called Ship Creek, where freshwater is mixing quickly with seawater in this very small estuary, and on Stewart Island along a salinity gradient in the Freshwater River. To be able to constrain higher elevation sources of DOM, we also included samples from a stream draining Tussock grassland and from an evergreen beech forest also located on the South Island of New Zealand.
Additionally, samples were collected during the expedition ANTXXV/1 and 2 of R/V Polarstern along a transect in the East Atlantic Ocean and the Atlantic sector of the Southern Ocean. Samples of surface and deeper waters were filtered and both, the water bodies as well as the filters were tested for their HIV-1-inhibitory potential. Details on the samples are given in Schmitt-Kopplin et al.49 and Ksionzek et al.50.
A third region of sampling was located in Antarctica. Samples were collected from underneath the shelf ice of Ross Island.
Furthermore, sampling was done along the Nuup Kangerlua Fjord, Greenland51.
A last set of samples is of different nature. We included DOM of secondary treated effluent: (i) from the Orange County Sanitation District after it had passed through the microfilteration process of the advanced water purification facility and indirect water reuse facility at Orange County Water District (OCWD)51; (ii) from a deep aquifer raw water that is used as source water to the Mesa Utilities drinking water treatment plant located in Costa Mesa, California; and (iii) from a sewage leakage on Catalina Island, California (CAT/CAL).
Sample preparation
Samples were directly prepared at the sampling sites and thereafter stored on ice or at −20 °C until analysis. Sampling procedures are described in previous publications37,48,49,50,51. All samples were filtered using Whatman GF/F glass fiber filters, acidified to pH 2 with high purity hydrochloric acid and then extracted/enriched by SPE according to previously published protocols52,53. SPE was performed using Agilent Bond Elut PPL cartridges containing a functionalized styrene-divinylbenzene polymer. Following the standard operation procedure, the cartridge volume was adapted according to the sample volume and according to the DOM concentration (5 g or 1 g PPL resin) to achieve a maximum concentration of organic material53.
Ultrahigh resolution mass spectrometry and raw data processing
Ultrahigh-resolution mass spectra were acquired on a Bruker solariX ion cyclotron resonance Fourier transform MS (Bremen, Germany) equipped with a 12 Tesla superconducting magnet and an Apollo II source in negative electrospray ionization mode. Samples were injected with a constant flow rate of 120 µl/h, nebulizer gas pressure of 2.2 bar and drying gas pressure of 4 bar at 200 °C. Accumulations time was 0.4 sec. The applied ESI voltage were 3600 V capillary voltage and −500 V end plate offset. The spectra were acquired using a time transient of 4 MW. MS parameters were optimized to reach a maximum of sensitivity in the m/z range 120–800. Transfer optic parameters were therefore ToF 0.6 msec, frequency 4 MHz and RF amplitude of 175 Vpp. 500 scans were acquired for each sample.
An injection of the reference material from the International Humic Substance Society (IHSS) Suwanne River Fulvic Acid was used for quality control at the beginning of each batch analysis. Spectra were externally calibrated first on clusters of arginine (2.5 mg/l in methanol) and internally calibrated on a fatty acid reference list in negative mode; calibration errors in the relevant m/z range were always below 100 ppb. The spectra were exported from Data Analysis using a Signal/Noise (S/N) minimum of 2 and aligned through an in-house written software using a maximum discrepancy of 1 ppm; the data were stored in a matrix. Missing values were imputed with random variables, reflecting minimal values in the data set. Therefore, a vector was built, which contain the minimum detected intensity for each sample over the entire dataset. Missing values were afterwards imputed by randomly generated integers included in this vector (Excel, 2016, Microsoft). Signal intensities were normalized to the sum of intensities of all detected m/z features per sample54.
Elemental compositions of detected m/z feature were calculated using the in-house written formulae calculator considering H, C, N, O and S (maximal error <0.2 ppm)55. Elemental compositions were filtered according to the seven golden rules, which consider restrictions for the number of elements, LEWIS and SENIOR chemical rules, isotopic patterns, hydrogen/carbon ratios, elemental ratio of nitrogen, oxygen, phosphor, and sulphur versus carbon, element ratio probabilities and presence of trimethylsilylated compounds56. Single charged m/z features with at least one isotopic feature were considered valid. Data from all analyzed samples were visualized in van Krevelen diagrams, in which hydrogen-to-carbon (H/C) atomic ratios (y-axis) against oxygen-to-carbon (O/C) atomic ratios (x-axis) are plotted. Hereby, H/C ratio reflects relative aliphaticity and aromaticity (double bond equivalents – DBE), whereas the O/C ratio relates to oxygenation (oxidation and reduction processes)12. The benefit of such visualization is an easier and faster interpretability of complex mass spectra as areas of certain compound classes can be defined12. Even though attention has to be paid, that this interpretation is not a chemical identification. Detected intensities are represented by bubble sizes.
Database search was done in MassTRIX allowing negatively charged masses (M-H)− and a maximal ppm error of 1 ppm as only restrictions (http://masstrix3.helmholtz-muenchen.de/masstrix3/57,58) and a NIAID (National Institute of Allergy and Infectious Diseases ChemDB: Division of AIDS Therapeutics Database, http://chemdb.niaid.nih.gov) survey was performed manually for all important elemental compositions.
Fragmentation experiments of relevant m/z features
M/z features which were under the top 100 VIPs and which showed at least a fold change of 3 difference between HIV active and non-active samples were selected for fragmentation experiments (n = 10). SORI-CID (sustained off-resonance irradiation collision-induced dissociation) was performed in negative electrospray mode. Mass spectra consisting of 20 scans were acquired on parent and fragment ions (Table S3). SORI power and isolation power were adapted according to requirements of the m/z feature.
Cell culture
HEK293T (for virus stock preparation), LC5-RIC (for EASY HIT assay) and HeLa cells (for HCS) and their culture are described in15,26. Briefly, HEK293T cells were seeded into 6-well plates at 105 cells in 2 ml of cell very-low-endotoxin (VLE)-RPMI 1640 medium (Biochrom AG, Berlin, Germany) supplemented with 10% fetal bovine serum (Biochrom AG) and 1% antibiotic-antimycotic solution (Gibco) before transfection. LC5-RIC cells contain a stably integrated reporter gene for expression of DsRed upon HIV-1 infection. The cells were cultured in cell culture flasks (T-185 Nunc Solo Flask, Nunc International, Wiesbaden, Germany) and maintained at 37 °C, 5% CO2 using DMEM (Gibco, Karlsruhe, Germany) culture medium supplemented with GlutaMAXTM-I (L-alanyl-L-glutamine), pyruvate and 4.5 g/l glucose (all from Gibco, Karlsruhe, Germany), 10% fetal bovine serum (FBS, Biochrom AG, Berlin, Germany), 1% antibiotic-antimycotic solution (Gibco, Karlsruhe, Germany), 1% sodium pyruvate (Gibco, Karlsruhe, Germany). In addition, 0.74 mg/ml geneticin (G418 sulfate; PAA Laboratories, Pasching, Austria) and 0.125 mg/ml Hygromycin B (PAA Laboratories, Paching, Austria) were added every second passage, to ensure stable expression of the CD4 receptor and general stability of the reporter construct. The cells were kept for a minimum of 48 h in medium without geneticin and hygromycin B prior to the experiments. HeLa cells (parental HeLa cell line, ATCC® CCL-2™) were seeded into 384-well plates at a density of 2,000 cells per well in a volume of 25 µl of Dulbecco’s modified Eagle medium (DMEM containing GlutaMAX-1; Life Technologies) containing 10% fetal bovine serum (Life Technologies) and 1% antibiotic-antimycotic solution (Life Technologies) and cultured under 37 °C and 5% CO2 for 24 h prior treatment with complex mixtures. The cells were used for a maximum of ten passages.
EASY HIT- HIV full replication assay
A full description of the assay procedure and virus stock preparation used in this study is detailed in Kremb et al.26. In brief, 24 h after seeding the cells into microwell plates, the cell culture medium was removed and the sample (dissolved in 100 μl cell culture medium) and 20 μl virus inoculum were added to the cells. Samples were prepared by drying of 10 µl of the original solution and re-dissolving in 330 µl of cell culture medium. 100 µl sample was added per well. Experiments were performed in triplicates. Cells were incubated for 48 h after addition of sample and virus inoculum. Cell culture supernatants were then removed from the treatment plate and fluorescence intensities of each culture measured. To measure effects of treatment on production levels of infectious virus, 20 μL of culture supernatants from treatment plates were transferred to uninfected LC5-RIC cells seeded in 96-well plates, plates incubated for 72 h and fluorescent intensities measured. Fluorescent measurements were performed with with a Tecan infinite M200 (Tecan, Crailsheim, Germany) at the monochromator wavelengths of 552 nm for excitation and 596 for emission.
Subsequently, viability of LC5-RIC cells was determined via a MTT test (3-(4,5-dimethylthiazol-2-yl)- 2,5-diphenyl tetrazolium bromid) by incubation of cell cultures with 50 µg of MTT solution (Sigma-Aldrich, Taufkirchen, Germany) in 100 µl of cell culture medium for 2 h at 37 °C as described in26.
High-content screening
High-content Screening of cellular alterations upon MeE-treatment was performed according to a published protocol15 targeting 11 cellular structures (Table 2) and resulting in unique cytological profiles of 134 features. Cells were treated with 25 µl of samples (re-dissolved in DMEM cell culture medium) in 4 replicates. After 24 h of treatment four different cell-staining protocols were applied (described in detail in Kremb et al.15). A Cellomics ArrayScan VTI (Thermo Fisher Scientific) platform equipped with a 10x objective (Zeiss Plan Neofluar, NA 0.3) was used. Images were analyzed using the Compartmental Analysis Bio Application (Cellomics, Thermo Fisher Scientific). A minimum of 500 valid objects were analyzed per well. Cell cycle analysis and analysis of cell loss were accomplished by using the Cell Cycle Bio Application (Cellomics, Thermo Fisher Scientific) using at least 2000 valid objects. Raw data from automated image analysis for each cytological feature were related to corresponding values from control wells where the control was set to 1. All cytological features of a given fraction or reference compounds (LOPAC®1280 – The Library of Pharmacologically Active Compounds, Sigma-Aldrich, Taufkirchen, Germany) were combined to result in a cytological profile.
Statistical analysis
Pearson correlation was used to screen for associated m/z features with the observed anti-HIV-1 activity of the complex extracts (Excel 2016, Microsoft, USA). Therefore, the correlation coefficient of the detected intensity and the observed antiviral potency of the complex extract was calculated for each single m/z feature. We considered correlation coefficients >0.8 as relevant. Principal Component Analysis (PCA) models have been used for data visualization and for discovery of natural occurring patterns as well as for identification of putative outliers. Mean centering in combination with unit variance scaling has been applied for the data of this study (SIMCA-P© 9 (Umetrics, Umea, Sweden)). After exploration of naturally occurring patterns with unsupervised methods, the data has been further analyzed with Partial Least Square Discriminat Analysis (PLS-DA) in SIMCA-P© 9 (Umetrics, Umea, Sweden). R² was observed to be 0.914. A seven-fold cross-validation has been applied, which resulted in a Q² of 0.682. Furthermore, a permutation test for evaluation of putative overfittings has been done with 200 permutations. The regression of the correlation coefficient between the original Y and the permuted Y versus the cumulative R2 and Q2 intercepts the x-axis at R² = 0.0887 and Q² = −0.125. Therefore, the model has met all the required quality criteria to be considered valid and not overfitting. M/z features with a VIP-VALUE (variable importance in projection) >1.98 have been considered relevant. Wilcoxon-Mann-Whitney test has been further used to assess the statistical significance of these m/z features (MultiExperimentViewer MeV v4.6.259). P-values have been Benjamini/Hochberg corrected for multi testing. All cytological profiles were normalized to the average of cytological profiles detected for control cells and subjected to hierarchical clustering using complete linkage clustering with optimized gene leaf order and a Pearson correlation using Multi Experiment Viewer (MeV v4.959, Dana-Farber Cancer Institute, Boston, MA, USA).
Source: Ecology - nature.com
