Temporal variation of the N balance
Based on a coupled human-natural urban N flow analysis, we found that Nr flows in a typical megalopolis have been artificially intensified to sustain the increasing demands for production and consumption with continuous Nr loss in the environment (Fig. 1). The detailed N fluxes among 12 subsystems can be found in Supplementary Figs. 1, 3–14.
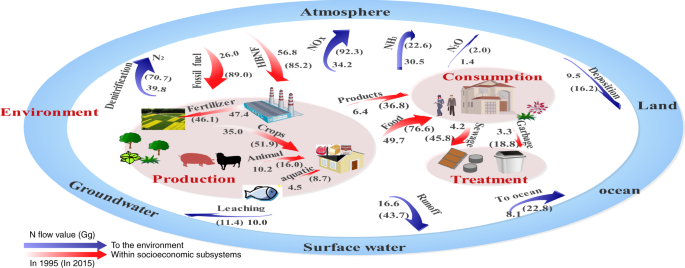
N flows among production, consumption, treatment and environment process groups under anthropogenic perturbations. The numbers in brackets and out of brackets represent N fluxes in 2015 and 1995, respectively. HBNF, Haber- Bosch N fixation. Units are in Gg N y−1.
Over the past two decades, the total annual Nr inputs in Guangzhou increased from 142.5 Gg to 301.5 Gg and showed slight fluctuation (Fig. 2a). Anthropogenic Nr creation (excluding natural BNF) continued to increase from 90.9 Gg in 1995 and reached 180.0 Gg in 2015, contributing to 95.0% of the total Nr creation (BNF, HBNF, and N fixation during fossil fuel combustion) (Fig. 2b). The anthropogenic dominating inputs included trade imports, N fixation during fossil fuel combustion, and HBNF, which accounted for 37.1, 29.5, and 28.3%, respectively. Fossil fuel combustion increased from 26.0 Gg to 89.0 Gg due to the growing demand for industrial production and household utilization in the urban system. The input intensity of Nr fixation from fossil fuel combustion in Guangzhou in 2015 was 119.7 kg N ha−1 y−1, which was much greater than the value of all of China (8.85 kg N ha−1 y−1)15. HBNF was used to produce N fertilizers and other synthetic ammonia products (e.g., plastics, synthetic rubbers, synthetic fibers, detergents, drugs and other products). Our estimate of the HBNF input intensity in 2015 was 114.6 kg N ha−1 y−1, which was higher than the average value in China (~48.9 kg N ha−1 y−1)29. Another important characteristic of Nr inputs in Guangzhou was the heavy reliance on external supplies, especially agricultural products.
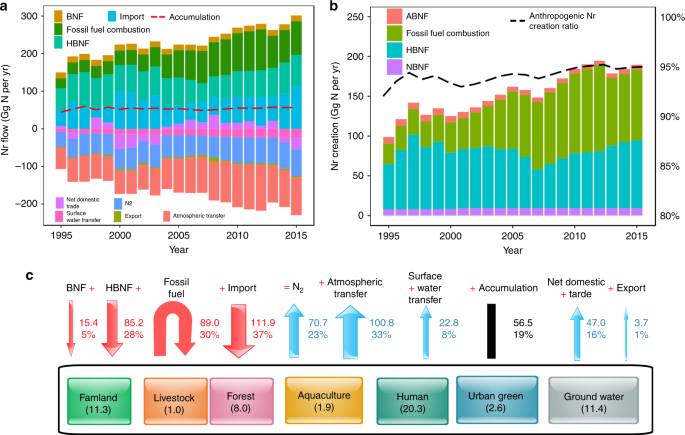
a The Nr input, output, and accumulation. b The Nr creation. c Schematic of N balance in 2015. ABNF, agricultural biological N fixation; HBNF, Haber- Bosch N fixation; NBNF, natural biological N fixation; Atmospheric transfer: Nr transfer to the surrounding areas; Surface water transfer: Nr transfer to oceans.
The total N outputs were 99.2 Gg in 1995 and 245.0 Gg in 2015, and approximately 50.4% was Nr that was ultimately discharged into the environment in 2015 (Fig. 2a, c). This large flux of Nr emissions could lead to serious atmospheric and hydrosphere problems. As a result of Nr inputs and outputs in the coupled human-natural urban system, the Nr accumulations were 44.7 Gg in 1995 and 56.5 Gg in 2015. Human and farmland subsystems contributed to the greatest successive accumulation (Fig. 2a). In 2015, human subsystem contributed to 35.9% of the total accumulation, followed by farmland (20.0%), forest (14.2%), groundwater (20.2%), urban green (4.6%), aquaculture (3.4%), and livestock (1.7%) (Fig. 2c). Over the past two decades, Guangzhou gradually transformed into a typical advanced manufacturing and modern service-based city driven by substantial human consumption. Industrial synthetic products for human consumption resulted in an accumulation due to their long service lives. In contrast, in the entire country, farmland largely contributed to the Nr accumulation due to massive chemical fertilizer input and large cultivation scale24.
To ensure the robustness of the N flow results, we conducted a Monte Carlo simulation to test the propagation of input uncertainties into the successive and final results. The uncertainty results of key N flows in Fig. 2c are shown in Table 1, and the mean, 5th and 95th percentiles are provided. Small uncertainty was observed in the N flows derived from the official statistics. For example, 89.0 Gg (66.7 Gg, 113.0 Gg) N fixation from fossil fuel combustion in 2015 with range of ~25% was estimated by consumption of all types of fossil energy and corresponding NOx emission factors. Nr accumulation was calculated as the difference between inputs and outputs, and all uncertainties in the inputs and outputs may be additive in Nr accumulation, e.g., Nr accumulation in the farmland subsystem was 11.3 Gg (2.1 Gg, 22.5 Gg) with range of ~90%. Besides, we provided uncertainty analysis of partial N flows due to activities data and parameters respectively in Supplementary Fig. 15. Uncertainties due to parameters contributed more than that due to activity data to the full uncertainties. Moreover, we compared partial N flows with previous estimates from China and other cities to validate the rationality of the calculation results, which is provided in Supplementary Table 22 and Supplementary Discussion 2.
Industrial Nr fate analysis
Increased anthropogenic inputs of Nr provide more industrial products (including synthetic and organic products) to meet human demands. During production and consumption processes, a substantial proportion of Nr is lost to the environment. The synthetic products are mainly used as N fertilizer and feed for agricultural purposes and synthetic ammonia products (e.g., plastics, synthetic rubbers, synthetic fibers, detergents, drugs and other products) to meet human consumption demands. Synthetic industrial Nr is generally found near human settlements. Environmental and health problems driven by industrial Nr have become increasingly serious4,10. Here, we performed a life cycle analysis of industrial N to obtain a more holistic understanding of N fate from production to consumption in the urban system (Fig. 3).
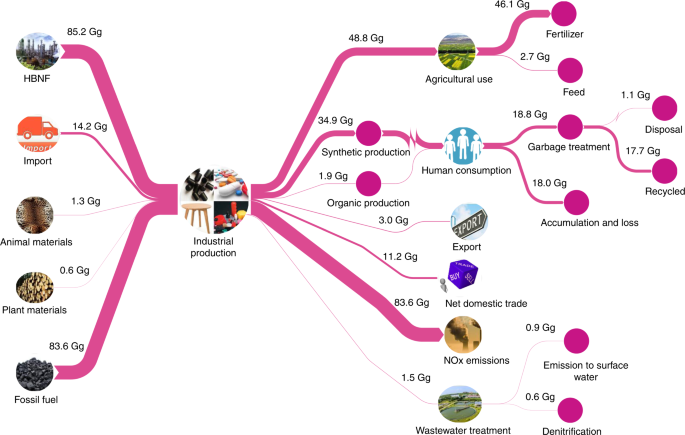
Anthropogenic inputs of Nr through HBNF, import, agriculture materials and fossil fuel provide industrial products (including synthetic and organic products) to meet human demands, a fraction of Nr is for agriculture use and human consumption, the rest is transferred outside the system or lost to the environment. HBNF, Haber-Bosch N fixation. Units are in Gg N y−1.
The Nr flux in the industrial subsystem sharply increased from 125.2 Gg in 1995 to 184.9 Gg in 2015 primarily due to an increase in HBNF and N fixation through fossil fuel combustion. In 2015, 46% of Nr inputs into industrial production were used to support agricultural activities and human consumption, while residual Nr was discharged into the environment or transferred to the external system. The fossil energy input into the industrial system was substantial, resulting in the release of 83.6 Gg of NOx emissions into the atmosphere in 2015 mainly caused by emissions from automobiles, aircraft, internal combustion engines, and industrial furnaces. In Guangzhou, the NO2 concentration (47 μg m−3) exceeded the acceptable maximum rate outlined by the second grade of the Ambient Air Quality Standards in China (40 μg m−3) in 201528, leading to negative environment and human health effects. Therefore, controlling industrial NOx emissions is a vital and urgent issue in Guangzhou.
HBNF is one of the most important new Nr inputs into circulation in Guangzhou. HBNF increased from 56.8 Gg in 1995 to 85.2 Gg in 2015. In 1995, small quantities of HBNF entered the industrial subsystem to provide synthetic ammonia products for human consumption; the most important output from HBNF was fertilizer N (i.e., 52.3 Gg, 92% of HBNF), most of which was designated for farmland use, which is very similar to the HBNF fate observed in China in 2010 (i.e., fertilizer N accounted for 87% of HBNF)24. However, in 2015, synthetic ammonia products accounted for ~41% of the HBNF input in Guangzhou, while the remaining ~57% was associated with agricultural use, leading to the accumulation of synthetic ammonia products in the human subsystem. The total accumulation of synthetic ammonia products in the human system reached 18.0 Gg in 2015, which was approximately six times higher than that in 1995 (3.1 Gg). The load of garbage treatment (mainly from synthetic ammonia waste) increased from 3.3 Gg in 1995 to 18.8 Gg in 2015, most of which was recycled to the human subsystem.
Food Nr fate analysis
Figure 4 shows the life cycle analysis of food Nr fate from production and consumption in Guangzhou. Inputs of Nr to food production (i.e., including crops, livestock, and aquaculture products) increased from 100.1 Gg to 167.8 Gg from 1995 to 2015 mainly due to the growth of import products. Correspondingly, Nr inputs from fertilizer and ammoniated feed slightly declined from 52.3 Gg to 51.5 Gg during this 20-year period. To obtain food, a developed city such as Guangzhou relies on external input more than local production, resulting in relatively low Nr emissions and accumulations from agricultural production in the environment. In 2015, a total of 38.3 Gg of Nr from food production was transferred to the environment, resulting in accumulations in the agricultural system (14.2 Gg), emission to the atmosphere (16.7 Gg), and discharge to the water (7.4 Gg). In contrast to production, consumption by the dense population in the urban system greatly increased Nr emissions in the environment. In 2015, 76.6 Gg food N was input into the human subsystem, resulting in 56.3 Gg released into the environment, 65.0% of which was discharged into surface water bodies. In urban systems, greater attention should be paid to Nr management in food consumption to reduce Nr losses.
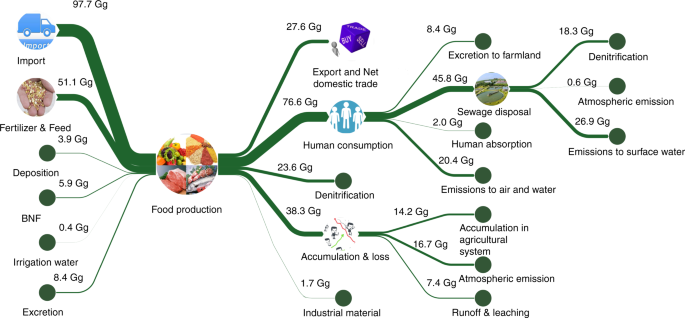
Inputs of Nr to food production include import, BNF, organic and chemical fertilizer, N deposition, feed, and irrigation water, a fraction of Nr is for human food consumption, the rest is transferred outside the system or lost to the environment. BNF, biological N fixation; Units are in Gg N y−1.
Approximately 25% of the Nr input into the farmland was transferred as food to human consumption. The nitrogen use efficiency (i.e., NUE, which is calculated as the Nr contained in harvest crop products divided by the Nr inputs) of the food production system in the farmland was equivalent to that in China30,31 but lower than that observed in North America32 and Europe33, where it was typically above 50%. Moreover, the human absorption ratio of Nr to input declined from 4.4% in 1995 to 2.6% in 2015. Diets changed during the 20-year period, and the ratio of grain protein to animal protein consumed by humans decreased from 2.4 to 2.1.
In China, excreta has been used as fertilizer for centuries34. However, the farmland in the urban system is poorly coupled to the livestock and human subsystems, and the overall N recycling ratios of livestock and human excreta declined from 48 and 70% in 1995 to 42 and 11% in 2015, respectively. Previous studies have examined the entirety of China and explored the consequences of an increasing recycling rate of N from livestock and the human subsystem back to farmland, which shows a substantial reduction in Nr creation24. Therefore, to increase the recycling of Nr, it is necessary to improve decentralized stockbreeding management and the construction of waste disposal facilities in the urban system. Such improvements could ensure the sustainability of agriculture while promoting human health and the environment.
Nr environmental load characteristics
During the natural biogeochemical cycling of N, Nr to atmosphere is primarily transformed into stable N2 through denitrification35. Our analysis demonstrated that in Guangzhou, approximately 23.4% of annual Nr inputs were denitrified as N2; the remainder was transferred to the environment and external system or accumulated in the subsystems. During the 20-year period, the increases in Nr emissions in the environment have been durative and extreme ranging from 83.3 Gg in 1995 to 185.9 Gg in 2012 with an annual growth rate of 7.2%. From 2013 to 2015, the rapid upward trend eased with an average level of 163.0 Gg mainly due to lower NOx emissions. In 2013, the Chinese State Council implemented the Air Pollution Prevention and Control Action Plan36, which aimed to reduce emissions from power plants, industrial boilers, motor vehicles, and fugitive dust, thus encouraging low NOx emissions. The primary sources of atmospheric emissions were identified as NOx, followed by NH3 and N2O, which can cause gaseous pollution through atmospheric flow and secondary reactions, such as haze37. The change in NOx was the most significant as it was estimated to be 34.2 Gg in 1995 and 92.3 Gg in 2015 (Fig. 5a). After 2002, in particular, the release of NOx, mainly by fossil fuel combustion, increased sharply and suddenly, which is consistent with the increase in energy intensity during this period38. The main sources of NOx include fossil fuel combustion from industrial production, which accounted for 73.7% in 1995 and 90.6% in 2015 of the total NOx emission, followed by fossil fuel combustion of domestic consumption and straw burning. NH3 volatilization is mainly associated with the use of chemical fertilizers and biological excretion39. In Guangzhou, due to the reduction in farmland area, chemical fertilizer use contributed to a gradual decrease in NH3 emissions (Fig. 5b). In contrast, the increasingly dense population resulted in a considerable release of NH3 into the atmosphere. Moreover, N2O from denitrification contributed an increasing amount of Nr in the atmosphere, which is a powerful greenhouse gas40, revealing an increase of 1.4 Gg to 2.0 Gg over the past 20 years (Fig. 5c). Previous studies have shown that N2O is mainly derived from agricultural soil41, and our analysis demonstrated that in an urban system, nitrification and denitrification associated with sewage treatment processes can produce more N2O emissions, which accounted for 30.0% of the total N2O emissions in 2015.
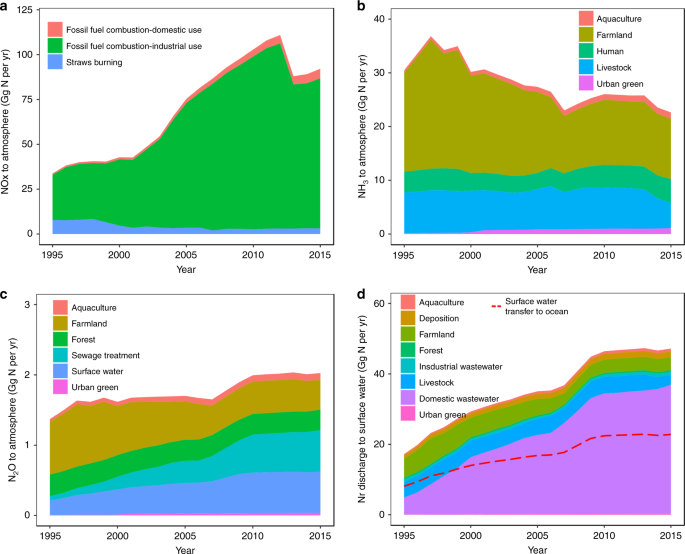
a NOx emissions to the atmosphere from fossil fuel combustion and straws burning; b NH3 emissions to the atmosphere from aquaculture, farmland, human, livestock and urban green subsystems; c N2O emissions to the atmosphere from aquaculture, farmland, forest, sewage disposal, surface water and urban green subsystems; d Nr discharge into surface water from aquaculture, atmosphere, farmland, forest, industry, livestock, sewage disposal and urban green subsystems.
The Nr input into surface water was 17.2 Gg in 1995 and 47.2 Gg in 2015, with 8.1 Gg and 22.8 Gg transferred to the ocean each year (Fig. 5d). Nr inputs from various sources greatly changed over the past twenty years. These changes were mainly driven by human consumption and discharge, which caused an increase in the fluvial transport of N and reflected an increase from 4.9 Gg to 36.6 Gg in domestic wastewater discharge of N to surface water during the 1995–2015 period. In the near future, with the advancement of urbanization and the improvement in living standards, the discharge of domestic wastewater will continue to increase. In contrast, agricultural Nr emissions into surface water in Guangzhou significantly decreased, and in 2015, Nr transferred to rivers from farmland, livestock, and aquaculture subsystem only accounted for 7.8, 6.1, and 1.7% of the total Nr inputs into rivers.
Human drivers analysis
An OLS regression estimate of the extended STIRPAT model was used to examine the contributions of four selected individual factors (i.e., population, dietary choice, energy intensity, and industrial level) to anthropogenic Nr creation. The regression coefficients of all explanatory variables were significant, and the R square was 0.940, indicating a good reliability for goodness-of-fit (Table 2, Supplementary Fig. 16 and Supplementary Discussion 1).
The results showed that population, industrial level, dietary choice, and energy intensity together contributed ~94% to the anthropogenic Nr creation changes in Guangzhou. Over the past two decades, the population in Guangzhou increased by 2.4% per year, resulting in a 2.2% annual increase in anthropogenic Nr creation with a contribution rate of 33%. The population has the greatest potential impact on Nr creation change, which is consistent with the result in China15. The industrial level increased by an average of 0.4% per year, was strongly correlated with Nr creation, and showed a 30% contribution rate. The increase in human production and consumption leads to greater levels of Nr creation from HBNF. Sustainable approaches are needed to reduce the negative effects of the increase in industrial Nr products. In Guangzhou, diets have shifted towards a focus on more animal protein, while the N intake from animal food is increasing at an annual rate of 0.46%. Dietary changes resulted in a 1.2% annual increase in anthropogenic Nr creation with a contribution rate of 18%. A reasonable and balanced dietary structure is encouraged. Energy consumption per unit of GDP during this period rapidly declined by 3.53% per year, which negatively contributed to a 13% change in Nr creation. Therefore, promoting efficiency in energy use has a significant effect on the reduction of atmospheric Nr emissions.
Source: Ecology - nature.com
