Magnetic shaker design
To mimic the honey bee shaking signal, we designed a two part tool made of an activator and a wand (Fig. 4). The activator was placed against the glass on the outside of the observation hive, with the wand inside. Both pieces had two magnets that attracted them to each other through the glass, so that when we moved the activator, the wand moved with it. The activator consisted of a printed circuit board (Supplementary File 1) with a large push button trigger, a battery, and a brushed DC motor (6V Pololu geared 298:1) with a cylindrical, diametrically polarized, magnet glued onto the end of the motor shaft (K&J magnetics, part R424DIA). These parts were attached to a 3D-printed frame (Supplementary File 2). Beneath the motor were the two magnets that were placed against the glass to attract similar magnets in the wand. The wand consisted of a 3D-printed base (Supplementary File 3) with two attachment magnets glued into it, and a flexible metal arm with a 4.8 x 4.8 mm square magnet on the end. This magnet (K&J magnetics, part B3301) was the piece that came into contact with bees. It aligned with the magnet at the end of the activator shaft, but did not sit flush with the glass.
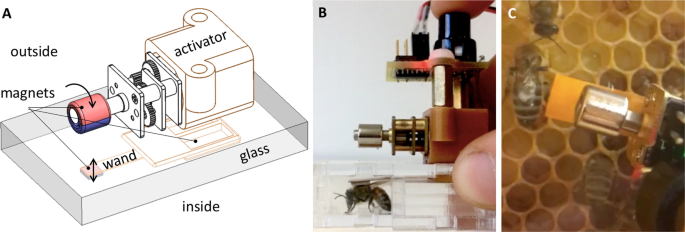
Magnetic shaker, composed of an activator on the outside of the hive and a vibrating wand on the inside to stimulate bees. (A) Design of the shaker. (B) Photo showing side view of the shaker when set up in a plexiglass arena with a bee. (C) Photo showing the magnetic shaker set up inside an observation hive.
When the activator button was pressed, the motor spun at 15 Hz for 1.5 s. This spun the magnet on the end of the activator shaft which, in turn, vibrated the magnet on the flexible end of the wand back and forth, inducing mechanical shaking of the bee at 15 Hz for 1.5 s. This vibration is within the average duration and frequency range of naturally observed shaking signals15.
The wand was designed to approximate the shaking force exerted by one bee on another. The force exerted on a bee by the magnetic shaker is determined largely by the dipole interaction between the magnets on the activator shaft and the wand. For a given separation between the magnets, the force is maximized when the two magnets are oriented to repel. To estimate this maximum force at a typical separation of 10 mm, we oriented the activator magnet to repel the wand magnet and lowered the wand onto a scale. The maximum output force of the magnetic shaker measured 7.8 mN, which represents an upper limit. We estimated that the maximum force of a natural shaking signal, Fbee is on the same order of magnitude of a foraging-aged bee applying its entire body weight ( ~ 100 mg27) onto another bee, i.e., Fbee = 0.98 mN. The peak output force of the magnetic shaker is within an order of the magnitude of the calculated force from a natural shaking signal, from which we inferred that the magnetic shaker exerts forces comparable to natural shaking.
Workers
We set up two honey bee observation hives with marked workers to study bee behavior before and after intervention with the magnetic shaker. We predicted that worker bees would walk faster and change their trajectories in response to the stimulus as they do in response to natural shaking signals6. We examined worker-shaker interactions in two queen-right, two-frame observation hives with approximately 2,500 bees at Cornell’s Dyce Lab for Honey Bee Studies, in Ithaca, NY during July and August 2018. In order to control for age in our study, we introduced cohorts of marked bees by incubating frames of capped, emerging brood from source colonies overnight (35 °C, 50% RH). We marked the bees that emerged overnight with a cohort-specific paint dot, and introduced 300 newborn workers to each of the hives. After introducing a cohort, we waited to observe them until they were 15–17 days old, in the middle-aged caste28. We chose this age because bees in the second and third week are the most common recipients of natural shaking signals, and bees in this age range are typically performing in-hive activities, so we were likely to see them in the colony during the day29.
The observation hives were setup with a single entrance/exit, with all bee traffic routed to a single side of the observation hive6,15). We only collected data on the exit side of the observation hives, where shaking signal activity primarily takes place6. The observer randomly chose whether to start with a shake (vibration) or sham control, and then alternated. To decrease the likelihood of stimulating a single bee multiple times, we collected data on a maximum of 10% of each cohort and chose our subjects randomly.
The observed side of the hive was set up with two grids, a 1 × 1 cm grid for tracking bee movement, and a grid that divided the hive into 9 squares for randomly selecting bees6. One of the 9 squares was chosen with a random coordinate generator, and the bee closest to the top left of the coordinate was followed. If there was no marked bee in the square, a new coordinate was generated. The initial position of the bee was marked on a transparency sheet covering the hive glass. We followed each bee for a total of 16 min (8 min before intervention, 8 min after). To measure the movement of the observed bee, we recorded each time the focal bee crossed a 1 cm gridline using a tally counter. At minute 8, we slowly moved the shaker to position it over the focal bee. Then, the shaker was either activated so that it vibrated for 1.5 s (shaken, n = 38), or was not activated (sham control, n = 39). This interaction was watched closely to make sure that the wand contacted the bee while vibrating. The treatment was not blind to the observer because the wand was activated with the press of a button, and could be heard and seen vibrating. The location of the bee during the intervention was recorded on the transparency.
We continued to follow the bee for 8 min after intervention. At the end of the observation period, the final position of the bee was marked. This gave us 3 positions for trajectory analysis of the bee: the location where we started observing, the location where we placed the magnetic shaker over the bee (shake or sham control), and the location where we stopped tracking the bee. In some trials we did not get all 3 of these locations successfully, so our sample size was lower than for the movement analysis (shaken: n = 32, sham control: n = 36). If the bee was lost after intervention, the time and final movement tally count were recorded and the last place the bee was observed was marked on the transparent sheet. If the bee was shaken by another bee while being observed, the time was noted and we stopped collecting data.
Drones
We also studied drone behavior before and after intervention with the magnetic shaker, in the same observation hives. We predicted that drones would walk faster, get groomed and fed more times, and spend more time being groomed and fed after being shaken, as they do in response to natural shaking signals12. We incubated frames of drone comb from source field colonies overnight (35 °C, 50% RH). Within 24 hours, emerged drones were collected. We glued a numbered plastic tag to each drone so that we could sample each individual and prevent collecting data on a single drone multiple times. We introduced drones on 4 different days to establish a population of 60–100 drones in each colony. Workers have been shown to shake immature drones more than 2 times as often as mature drones12, so we timed our observations of worker-drone interactions when the drones were reproductively immature (2–10 days old30). We chose drones by randomly generating a coordinate indicating one of the 9 squares that divided the hive, and choosing a drone within that square. If there were no drones that had not been previously observed, a new coordinate was generated until a qualified drone was found. During the period of observation (16 min: 8 before intervention and 8 after), we kept track of the distance the drone walked each minute, and the number of times a drone was fed or groomed and for how long, using a stopwatch and tally counter. We intervened at minute 8 by placing the magnetic shaker so that it was contacting the focal drone and either activating it (shaken, n = 54) or not (sham control, n = 47).
Statistical analysis
All statistical analyses were performed in R version 3.5.131. To compare the movement of workers and drones that were shaken compared to those that were not, we built linear mixed-effects models32. We used an autoregressive lag-1 correlation structure in order to reduce the confounding effects of temporal autocorrelation. We built these models to test for differences in movement of bees that were shaken by the wand and those exposed to the sham control, with colony as a random effect, and time since intervention, average movement of the bee in the 8 minutes prior to intervention, and the time of day (morning or afternoon) as fixed effects. We square-root transformed the response variable (movement, in cm).
The trajectories of the workers with respect to the hive exit before and after intervention were analyzed separately for shaken and sham control workers using Moore’s test for paired circular data33. The angle by which each bee changed its trajectory was analyzed using an unpaired Watson two test from the circular package in R34.
For the drone behaviors, we recorded the number of times the drones were fed or groomed by workers, and how long each of these interactions lasted. We then created linear mixed-effects models for: the number of times drones were fed, the number of times drones were groomed, time spent being fed, and time spent being groomed. Each of these models was built using treatment (shake or sham control), the number of times (or for how many sec) the bee was fed or groomed prior to the intervention, the age of the drone, and the date as fixed effects. The colony was treated as a random effect. To make models of the number of times the drone was fed, the time spent being groomed, and the time spent being fed, we square-root transformed the response variable. To analyze the likelihood that a drone would get fed or groomed after our intervention, we used generalized linear mixed models with a binomial distribution. In these models we used treatment group, the number of times the bee was fed or groomed prior to our intervention, and the age of the drone as fixed effects, and colony as a random effect.
Source: Ecology - nature.com
