Regional settings
The study area covers the entire Guizhou Province (N24°30′–29°13′, E103°1′–109°30′; Fig. 2). This area is 128,480 km2 and is characterized by numerous karst geological formations, accounting for 64% of Guizhou Province’s lithology, which contains a variety of different carbonated rock types. The remaining 36% of the lithology (mainly present in the southern, northern and southeastern parts of Guizhou) consists of igneous and metamorphic rocks, which are typically rich in silicon (Si) and have low calcium carbonate contents. The study region is characterized by a subtropical humid monsoonal climate with a MAT of ca. 11 − 20 °C and mean AP of ca. 730 − 2300 mm. The precipitation is seasonally variable, with ~75% of the AP occurring during the summer and autumn (June–November).
Data compilation
To study the vegetation-regolith-bedrock links, 23 CZUs were established (Fig. 2 and Supplementary Fig. 3) with a radius of 20 km and a meteorological observation station at the center of each zone. The selection of sites was based on the quality of precipitation data. To estimate the regolith water-holding capacity of each site, it was necessary to investigate the precipitation patterns and estimate the variation in soil moisture during dry spells, so each CZU should have a meteorological observation station at the center. There are 71 meteorological observation stations in Guizhou Province, but only 30 of them have precipitation data covering a time span of 10 years (i.e., 2001–2010). We also excluded the sites on which the associated meteorological observation was relocated during 2001–2010, as well as sites characterized by <10 identifiable dry spells, resulting in a final selection of 23 sites in total, which satisfy our study design: the selected sites were distributed evenly throughout Guizhou Province, including different bedrock types and along a wide climate range; the sample size was appropriate in order to carry out all the presented statistical analyses because we treated each site as a sample, which makes our statistical approaches robust, and hence, our results are reliable. This particular CZU area extent was chosen based on the recommendation of Liu et al.33, as the meteorological station data are representative of the entire zone, because homogeneous climatic conditions within each CZU can be assumed.
The 23 CZUs are well distributed across the entire study area (i.e., Guizhou Province, Fig. 2). Fourteen of these CZUs are located on carbonate rock, whereas nine are on clastic rock. The remote sensing retrieved terrestrial annual NPP values were obtained from Resource and Environment Data Cloud Platform with a spatial resolution of 1 × 1 km (http://www.resdc.cn/Default.aspx), which was estimated from the light energy utilization model (GLM_PEM)34. This dataset was used to obtain an approximate estimate of the regional vegetation growth for each CZU. The time span for both the climatic and NPP data was from 2001 to 2010.
Predictor variables for NPP
We used a total of seven predictor variables (Table 1) in order to explain the vegetation productivity. These variables were selected since they are related to the hypotheses of this study and widely considered potential drivers of vegetation productivity in Guizhou35,36,37. More details about these variables were provided below.
We used meteorological station data (available at http://data.cma.cn/), which included daily temperature, precipitation and solar radiation covering the period 2001–2010. The associated climate variables (MAT, SD, AP, PDSI) were calculated for each CZU.
In each CZU, three sites were selected for bedrock and soil sampling within each lithologic unit (Supplementary Fig. 3), and the delineation of the geological system was based on the 1:50,000 scale geologic map from the National Geological Archives of China, http://www.ngac.org.cn). In total, 204 sampling sites were established. To avoid artificial disturbance effects, the selected sites were kept as far away from farms, towns and cities as possible. All soil and bedrock samples were taken from fresh road cuts. To reduce the influence of fire events and grazing activity during evaluation of importance of bedrock geochemistry to vegetation productivity, the selected road cuts were covered by intact and undamaged vegetation. At each site, three profiles were sampled, each of which were separated by 5 − 50 m, depending on the length of the road cut. A ring-knife was used to collect soils from 0 − 30 cm depth and fresh bedrock samples were collected using a geological hammer.
In total, 612 bedrock and 607 soil samples were collected (five soil samples were not obtained due to a lack of significant soil coverage). In the laboratory, composite samples were made by thoroughly mixing the replicate soil samples (from the same stratigraphic unit and CZU) before being oven dried (40 °C, 72 h) and sieved (2 mm mesh size to remove plant material and stones). Subsequently, each sample was crushed and milled to 100 μm to allow for soil chemical measurements. The total soil nitrogen (soil N) was measured by a standard Elemental Analyzer (Vario EL, Germany). All bedrock samples were crushed and powdered to 50 μm using a three head grinding machine (XPM-φ120 × 3, China). Replicate bedrock samples (same stratigraphic unit and CZU) were mixed and then fired (550 °C, 12 h). Concentrations of major bedrock elements were measured by X-ray fluorescence spectrometry (M4 TORNADO, Germany). Soil N contents and the major bedrock elemental concentrations were weighted by area fractions of the different stratigraphic units present within each CZU.
Estimation of RWLR
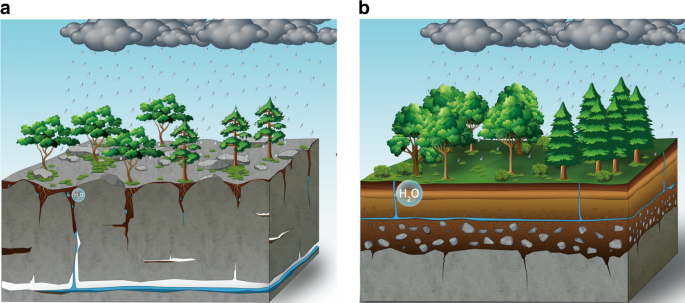
In the karst regions, the hydrological function of substrate is characterized by high-spatial heterogeneity38. More precisely the regolith water-holding capacity is not only influenced by regolith thickness and topography, but also depends on the network of fractures and fissures (Fig. 1). Thus, even in the CZU dominated by geochemically homogeneous bedrock, the variations in the RWLR can be great within a CZU. Hence, the relationship between bedrock geochemistry and RWLR is difficult to detect through direct measurements over a small spatial scale (e.g., considering detailed on-site monitoring).
Nevertheless, large scale surveys of regolith water dynamics can help to determine whether bedrock geochemistry is an important regulator of the RWLR. In this study, we assessed the RWLR across the different CZUs using a satellite-based index. We quantified the variations in soil moisture during dry spells, assumed that a high RWLR corresponded to high variations in soil moisture. The TVDI that has been widely used for soil moisture monitoring is used as a surrogate variable of soil moisture39,40. More importantly, previous studies showed that TVDI was highly correlated with soil moisture in karst regions located in southeast China41,42. In this study, variations in the TVDI during dry spells were used to represent the RWLR (Supplementary Fig. 4).
TVDI is based on an empirical parameterization of the relationship between land surface temperature and vegetation indices43. As TVDI is relatively insensitive to precipitation, it is appropriate to adopt this index to estimate the soil moisture variations related to the RWLR. More precisely, TVDI was calculated as:
$${mathrm{TVDI}} = frac{{T_{{mathrm{obs}}} – T_{mathrm{w}}}}{{T_{mathrm{d}} – T_{mathrm{w}}}}$$
$$T_{mathrm{d}} = a + b ast {mathrm{NDVI}}$$
$$T_{mathrm{w}} = c + d ast {mathrm{NDVI}}$$
where Tobs is the surface temperature at each pixel; Tw represents the minimum surface temperature under the given vegetation conditions, while Td represents the maximum surface temperature, which is estimated from the edge of the NDVI/Tobs space (3). Therefore, Tw and Td are linear functions of NDVI, the a, b, c, and d associated parameters were estimated at the pixel level, and hence, high TVDI values indicate high-surface water deficits.
Furthermore, as the monitoring of soil moisture changes during dry spells requires fine temporal resolution data, the satellite images used to calculate the TVDI were obtained from the MODIS–Terra sensor (i.e., Ts: MODLT1F, 5-day scaled at 1 km resolution; NDVI: MODND1F, with 5-day interval at 500 m resolution. http://www.gscloud.cn/), covering a time period from 2001 to 2010. The Ts and NDVI products includes atmospheric corrections to eliminate the influence of background noise. To match the pixel size of the NDVI map with the Ts map, the 500-m resolution of NDVI images were resampled to 1 km, using the nearest-neighbor-interpolation technique. The TVDI images of Guizhou Province of China were analyzed using ENVI 5.1 software, and then each CZU was extracted using ArcGIS. If the qualities of the NDVI or Ts images were unacceptable for the TVDI estimation, they were excluded.
For each CZU, the RWLR was calculated as the average variation in TDVI during dry spells (Supplementary Fig. 4). In this study, a dry spell was defined as the period of 5 or more consecutive days with no precipitation:
$${mathrm{RWLR}} = mathop {sum}limits_{i = n} {overline {frac{{{mathrm{TVDI}}_{b,i} – {mathrm{TVDI}}_{a,i}}}{{Delta T_{ab,i}}}} } times 100$$
n represents the number of observable dry spells from 2001 to 2010; i represents the ith dry spell, a and b represent the ath and bth TVDI (b > a), ∆Tab represents the time interval between a and b.
Statistical analysis
To compare the importance of the RWLR in predicting the NPP with other variables, and to evaluate the predictive power of the bedrock concentrations of the major elements for the RWLR, the ITA44 was performed. This approach allowed us to determine the relative variable importance (RVI) of each explanatory variable. All possible combinations of explanatory variables were tested. The best model subset for NPP and RWLR was identified by summing the Akaike weights of the highest ranked models until the value exceeded 0.95. The RVI for each of the candidate variables was calculated by summing the Akaike weights for all models in which the variable occurred in the best model subset.
To avoid collinearity among variables, we pre-selected the candidate variable based on our hypothesis and the performance of the prediction, which was estimated using a linear model (LM). Wherever two variables exhibited strongly collinearity (Pearson’s | r | > 0.70)45, we excluded the variable showing weaker (greater Akaike information criterion (AIC)) with the response variables. One exception was BRSi and BRCa, which were strongly correlated (Supplementary Table 1) but we did not exclude either because both showed a significant relationship with RWLR and the AIC values were very close; and they even showed a high collinearity, but they might influence the RWLR via different mechanisms. Therefore, we separated the RWLR models into two subsets, with BRSi excluded in one model subset, and BRCa excluded in the other subset.
The LMs were conducted using R3.1.0 software46, and the model selection was performed using the “dredge” function in R package MuMIN47.
Structural equation model of vegetation productivity
To explore the interactions between bedrock geochemistry, RWLR, and NPP, and assess the indirect influence of bedrock geochemistry on NPP, a SEM48 was developed to understand the relationships among bedrock geochemistry, the RWLR, climatic factors, soil nutrients and NPP. The use of a SEM allows for the direct and indirect effects of candidate variables to be considered. Furthermore, SEM can be used to test whether the integral model is statistically acceptable. In our SEM, the RWLR and vegetation productivity were treated as response variables, whereas the bedrock geochemistry, and climatic and soil variables were treated as explanatory variables. First, we designed an SEM to investigate the relative importance of bedrock geochemistry on vegetation productivity through regulation of the RWLR. Additionally, we assessed the influences of climate and soil variables on the NPP, as well as the relationships with the RWLR.
Since this study is characterized by a rather small sample size (23 CZUs), a model simplification is required. We considered only those explanatory variables showing significant relationships with the response variables in our SEM analysis. An additional component for the SEM was developed to evaluate the residual correlations and modification indices after model’s execution. The root mean square error of approximation (RMSEA) and the comparative fit index (CFI) were used to evaluate the goodness of fit. The final SEM was chosen when the following criteria were met: p-values of χ2 and the goodness of fit test p > 0.05; CFI > 0.9, and lower 90% confidence intervals (CIs) for RMSEA < 0.05 (ref. 18). The SEMs were calculated using the R packages “sem”49 and “lavaan”50.
Calculation of the NDVI-temperature relationship
To estimate the influence of bedrock on changes to the response of vegetation activity to temperature variability, 12 largest karst regionss from mid-latitude bands (30°–60°) of the Northern Hemisphere were selected to detect their temperature variation signals of vegetation productivity. We chose this area because: first, the mid-latitudes in the Northern Hemisphere exhibits obvious climate seasonal variation, and climate change will most probably have a significant influence on the vegetation productivity51,52. Second, A total of 61% of the world’s karst regionss are distributed in this zone53. Moreover, the carbonate rock areas located in deserts were discarded from further analysis, as the NDVI-values highlighted the lack of any significant vegetation development in these areas.
The temperature variation signal of vegetation productivity is calculated as the correlation coefficient between NDVI (obtained from Global Inventory Modeling and Mapping Studies, spatial resolution: 0.5°; biweekly data from 1982 to 2011)54 and growing season mean temperature (April–September, obtained from Climate Research Unit55, the spatial resolution and temporal range are consistent with NDVI) (RNDVI-GT) at the pixel level. To assess the influence of bedrock on the relationship between vegetation activity and temperature, we employed a buffer zone approach. We compared the RNDVI-GT within carbonate rock areas and buffer zones outside the carbonate rock areas boundaries by Mann–Whitney Wilcoxon test. The width of these buffer zones is 50 km (1 pixel), because this width minimizes the influence of climate and results in similar numbers of pixels in the inner and outer areas.
Source: Ecology - nature.com
