Rural population
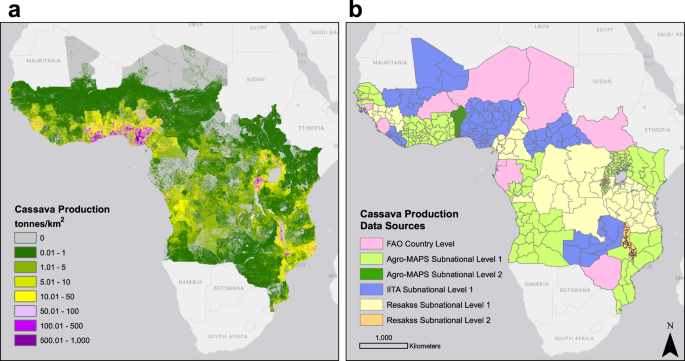
Representation of human population density was used to redistribute data on cassava production per province or district in 30 countries of West, central, East and southern Africa. Data were obtained from the LandScan 201422 raster population density layer developed as part of the Oak Ridge National Laboratory (ORNL) Global Population Project at a resolution of approximately at ~1 km by 1 km (~30′′ by 30′′). The LandScan model uses country sub-national census data and combines it with additional datasets including land cover, roads, urban and rural locations to redistribute the populations according to a weighting scheme. Populations living in densely populated urban areas are unlikely to grow cassava and thus, areas with a population density higher than 5,000 inhabitants per 1 km2 were masked out and deemed unsuitable for cassava farming.
Cassava production and harvested area data
Sub-national data about cassava production and harvested area per administrative unit were obtained and compiled from several sources: FAO Agro-MAPS (www.kids.fao.org/agromaps), ReSAKSS (www.resakss.org) and personal communication with the International Institute of Tropical Agriculture (IITA). These sources were later compared according to the administrative resolution, year of data records and amount of missing data. Based on these three criteria, the preferred data source was manually identified to strike the best balance most recent records, fine resolution and finally considering number of missing records (Online-only Tables 1 and 2). For some countries no sub-national statistics on cassava production or harvested area were available. In those instances, country level FAO estimates (www.fao.org/faostat) for 2014 were used for cassava production and harvested area estimates (Online-only Tables 3 and 4). Collated data represented statistics from various years, as agricultural censuses are taken rarely, often every 10 years or even less frequently. Country-level FAO cassava production and harvested area estimates from 2014 were used to standardise values in the administrative units across each country so the totals represented those of the 2014 national-level estimates.
Administrative units
Due to frequent changes in administrative divisions in various African countries, polygon shapefiles provided with respective sources of cassava production statistics were used to represent the extent of administrative zones. Administrative division shapefiles for Uganda provided by FAO Agro-MAPS were unfit for use due to the corrupted topology of the layer and the lack of a match between the unique identifiers and names of the districts listed in the production data file. In this case, the country administrative shapefile for the first level of administrative division was downloaded from GADM (www.gadm.org). Unions between districts that have been historically merged were applied in order to link them correctly to the Agro-MAPS statistics file.
Missing data
In multiple subnational administrative units, production, or harvested area data respectively were missing (Online-only Tables 3 and 4). Based upon personal communication with country experts it was established that cassava is grown in those areas. In those areas cassava per capita production/harvested area values were calculated individually based either on the average value of all administrative units from the same country adjacent to the unit with missing data or based on values in districts representing the same or similar agro-ecological zones (Online-only Table 5).
The Ugandan country outline shapefile obtained from GADM had relatively small areas that lacked alignment with neighbouring Kenya and Democratic Republic of Congo (DRC) shapefiles. It resulted in two areas containing a proportion of pixels with missing values within the bounding boxes defined by the following sets of coordinates: 35.797°E, 4.146°N, 33.963°W, 1.569°S and (30.993°E, 3.463°N, 30.742°W, 2.514°S. Missing value pixels in these bounding boxes were replaced with a constant value obtained from the range of values in neighbouring pixels (0.02 for production and harvested area per capita 2014 adjusted values).
Disaggregation
For each administrative unit, cassava production in tonnes and harvested area in hectares per capita values adjusted for 2014 FAO reported country totals (Prod_percapita_2014 and HA_percapita_2014) were calculated. They were obtained by dividing the adjusted production total (Admin_unit_prod2014 and Admin_unit_ha2014) (Eqs. 1 and 2) by the rural population (Admin_unit_pop2014) (areas at or below 5,000 inhabitants per pixel) in each administrative unit (Eqs. 3 and 4).
$$Admin_unit_prod_2014=frac{Admin_unit_prod}{Country_prod}times Country_prod2014$$
(1)
$$Admin_unit_ha_2014=frac{Admin_unit_ha}{Country_ha}times Country_ha2014$$
(2)
$$Prod_percapita_2014=frac{Admin_unit_prod_2014}{Admin_unit_pop2014}$$
(3)
$$HA_percapita_2014=frac{Admin_unit_ha_2014}{Admin_unit_pop2014}$$
(4)
A linear relationship between population number and cassava production was assumed up to a maximum allowed threshold value. The per capita cassava production and harvested area values were evenly allocated across all pixels by multiplying the number of people by the per capita value. It was assumed that a maximum of half of the area of the pixel can be allocated to cassava production (approx. 50 hectares) and the production per hectare does not exceed 20 tonnes per hectare. Thus, cassava harvested area per pixel cannot exceed 50 hectares and cassava production per pixel cannot exceed 1,000 tonnes. For those districts where cassava harvested area exceeded 50 hectares or production exceeded 1,000 tonnes in one or more pixels, the amount in excess was deducted and redistributed between the remaining pixels until the condition was satisfied and no pixel in a given administrative unit exceeded the assumed maximum production/harvested area threshold value.
Source: Ecology - nature.com


