Microbial community classes are determined by local conditions
We analysed 753 bacterial communities sampled from water-filled beech tree-holes in the southwest of the UK32 (see Supplementary Table 1 and Supplementary Fig. 1). Communities were grown in a medium made of beech leaves as substrate for 7 days and then their composition interrogated through 16S rRNA sequencing (see Methods). We analysed the β-diversity of these communities according to two different metrics: the Jensen-Shannon divergence (DJSD)35, and a transformation of the SparCC metric (DSparCC, see Methods36).
We found that there was a strong relationship between spatial distances and the two β-diversity distances (Mantel test: r = 0.21; p < 10−3 for DSparCC and r = 0.19; p < 10−3 for DJSD). This correlation was unexpected because the communities were sequenced following cryo-preservation and subsequent growth under laboratory conditions, so the communities did not necessarily reflect their composition in the original environments. To test if this trend was maintained across the different scales, we clustered samples that were closer in space, and retrieved the classifications found at 10 distance thresholds spanning five orders of magnitude (from < 5 m to >100 km). We used three statistics (ANOSIM, MRPP and PERMANOVA37,38, see Methods) to test whether the β-diversity distances within clusters were significantly smaller than those between clusters for the 10 classifications. In all cases, the three tests supported the hypothesis that communities within locations were significantly more similar than between locations (permutation tests, p < 10−3, see Supplementary Fig. 2).
We studied how the statistics changed across the 10 distance thresholds. We observed an increase in the mean community dissimilarities within clusters (quantified with the MRPP statistics) and a decay in the ANOSIM R statistics (Fig. 1c and d), whereas PERMANOVA remained roughly constant across scales (Supplementary Fig. 3). To interpret these trends, we analysed the behaviour of these metrics with synthetic data in which artificial β-diversity distances matrices were generated under different scenarios that altered the mean and variance in β-diversity distances within and between locations and across scales (Supplementary Figs. 4–5). The increase in the MRPP statistics with increasing spatial distance in the experimental data may be indicative of an important role for dispersal limitation20. However, the distance-decay in the ANOSIM-R statistic matched the experimental data (Fig. 1d) only when the variance of the simulated β-diversity distances was large (Supplementary Fig. 7 middle column, bottom). To give a sense of the implications of this finding, 3% of the β-diversity distances between samples 100 km apart should be as high as those within 5 m of each other (Supplementary Fig. 8, right). Such a finding either could indicate substantial long-distance dispersal over 100 km, or alternatively that there are similar selection pressures at some distant locations.
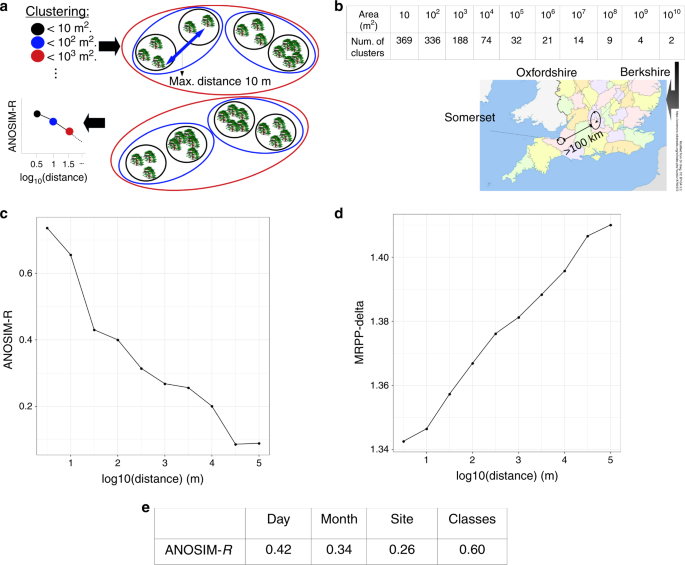
a Illustration of the procedure. Trees are clustered within areas A of increasing sizes, leading to one classification every order of magnitude (ellipses of different colours). We approximated these areas by stopping the clustering at spatial distances thresholds equal to (sqrt{A}), e.g., the classification for areas of 100 m2 (blue ellipses) is obtained by stopping at d = 10 m. For each classification, an ANOSIM and MRPP value was computed to test if the similarity of the communities within the clusters is larger than between clusters, and the statistics were plotted against the spatial threshold. b Number of clusters at each spatial threshold. The three counties from which the communities were sampled are shown in the map. The classification at the last threshold consists of two clusters separated by > 100 km. c, d Observed ANOSIM and MRPP statistics for each of the distance thresholds, reflecting a decay in the similarity of the communities (see Main Text for details). e ANOSIM values for communities clustered according to the day and month in which were sampled, the site from which they were collected (optimal classification of spatial distances), and the six community classes (optimal classification of β-diversity distances).
We explored this alternative hypothesis that similar communities found at distant locations result from similar underlying environmental conditions. We performed unsupervised clusterings with DJSD and DSparCC, revealing in both cases six distinct community classes (Fig. 2a and b, Supplementary Figs. 9–10 and Supplementary Table 2 for global characteristic metrics such as diversity). The whole set of communities are dominated by Proteobacteria, and the community classes were distinguished at the genus level (95% sequence similarity), including a higher presence of the genera Klebsiella and Pantoea (classes 1, red; and class 3, pink); Paenibacillus and Sphingobioum (class 2, green); Serratia (class 5 blue); Sphingomonas, Streptomyces and Pseudomonas (classes 4, yellow) and low abundant genera like Brevundimonas and Herbaspirillum and, again, Pseudomonas for class 6 (grey). In the following, we refer to class 1 (red) as the reference class because it encompassed the largest number of communities (Supplementary Table 2). We refer to the remaining communities by their most-distinctive taxon as Paenibacillus (class 2), Klebsiella (class 3), Streptomyces (class 4), Serratia (class 5). For class 6, we observed that although the Pseudomonas genus was also high in other communities, classes 4 and 6 were dominated specifically by Pseudomonas putida (Supplementary Fig. 10), which we selected as representative of class 6. In ref. 39, we use a network approach to identify modules of co-occurring species that confirm the key role of the taxa selected as representatives.
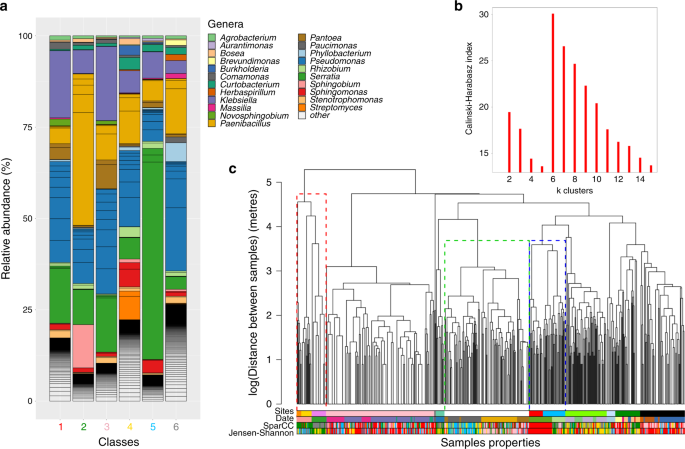
a Genus frequencies in each of the six community classes found after unsupervised clustering of the communities using DSparCC. Only the 15 most abundant genera in each community class are shown, with the remainder classified as others. b Calisnki–Harabasz index versus the number of final clusters in the classification, showing a maximum at six classes. c The dendrogram represents the clustering of the samples (leaves in the tree) according to their spatial distances. The coloured bars represent membership of each sample to different classifications (from top to bottom): the sites, the day of sampling collection (Date) and the classes found using either DSparCC and DJSD. Dotted rectangles in the dendrogram indicate examples of: (green) locations where one site was sampled on different days; (blue) two sites sampled on the same day: (red) a mix of both situations. It is apparent that the date is a better match to the community classes than the site, which is confirmed with a comparison between the classifications (Supplementary Table 3).
We illustrate how these classes are distributed in space by representing the class identity of each community as a coloured bar, alongside the site and date in which the community was sampled (Fig. 2c). As expected from the previous analysis, some communities belong to the same class even if they were distant in space. This can be noted in the dendrogram of Fig. 2c, which shows how distant sites (dendrogram) could have similar compositions (colour, representing the classes; see also examples in Supplementary Fig. 11). In addition, in Fig. 2c, we have highlighted in the figure (dotted rectangles) some of the cases in which there is a better correspondence with the date of sampling than with the site. To test this observation, we showed that a classification based on the date of sampling is consistently more similar to the β-diversity classes than the site (Supplementary Table 3). Moreover, computing the ANOSIM statistics when tree-holes are clustered according to sampling location (Site values in Fig. 2e) or according to the sampling date (Day and Month values) consistently showed that the specific date (Day) is more informative than the site. The Day was also more informative than the Month, suggesting that seasonal environmental conditions were not the main drivers of the similarities, but that they were rather owing to daily variation in local conditions. Notably, the value of the ANOSIM statistics when the classification considered are the community classes, reaches the same value than the one found at 50 m (Fig. 1c).
In summary, the classification successfully grouped communities into just six groups, with communties within classes often separated by far >50 m. In addition, the date of sampling was more informative than the sites. Taken together, the results suggest that the classes capture similarities in local environmental conditions even in tree-holes that were spatially separated by considerable distances.
Community classes reflect different functional performances
If environmental conditions determine compositional differences in the communities, we expect that these differences are translated into different community functional capacities. We investigated this question analysing data that quantified the functional performance of the communities32. The sampled communities were cryo-preserved after sequencing, and later revived in a medium made of beech leaves as substrate. Cells were grown for 7 days while monitoring respiration and, after this period the following measurements were taken: community cell counts, community metabolic capacity (measured as ATP concentration) and community capacity to secrete four ecologically relevant exoenzymes40 related with (i) uptake of carbon: xylosidase (X) and β-glucosidase (G); (ii) carbon and nitrogen: β-chitinase (N); and (iii) phosphate: phosphatase (P).
Visual inspection of the functional measurements shown in Supplementary Fig. 13 indicated substantial differences in the functional capacities among the community classes. In some cases, communities belonging to different classes were clearly separated, which is apparent in the histograms in Supplementary Fig. 13. Therefore, we explored if these differences among the community classes were significant using structural equation models (SEM)41. Toward this end, the first step was to identify the most likely structural model that explained how the functions are interrelated. We found a model with an excellent fit (RMSEA < 10−3, CI = (0–0.023), AIC = 7493 see Methods and Supplementary Fig. 15), showing that measurements related to uptake of nutrients were all exogenous, including ATP production, cell yields and CO2 production (Fig. 3). In addition, ATP production influenced yield, which in turn influenced CO2. Among exoenzyme variables, N influenced ATP and, notably, only X affected yield, whereas G and P influenced both ATP and CO2.
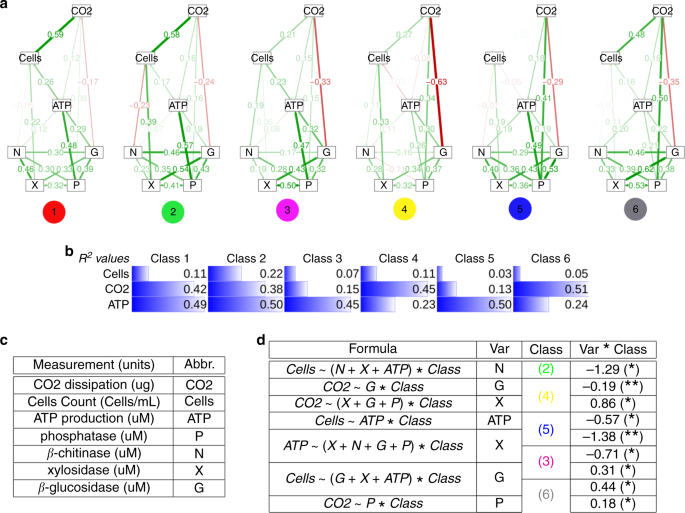
a Diagrams of the final SEMs. The standarized coefficients for each of the six classes are shown on the corresponding pathway. b R2 values for the three endogenous variables in the SEM model. c Experimental measurements used in this study and their abbreviations. Four independent replicates of each function were measured and then averaged to conduct the analysis. d Causal analysis of the influence of the exogenous variable (Var) for each SEM pathway (determined by the response variable and Var in Formula) when the identity of the classes is included as a factor. Confounding factors involved in the pathway are also included (remainder variables in Formula). The column Class reflects the class identity of any significant coefficient found in the interaction terms of the regression with its value shown in the column Var * Class (significance code: *p value < 0.01, **p value < 0.001).
Assuming that variables are structurally related in the same way independently of the community, we investigated whether the parameters of the model were significantly different for each community class (up to six parameters per pathway, see Methods). To address this question, we considered three scenarios: (i) a model in which all the parameters were constrained to be the same for all the classes; (ii) a model in which each class had a different parameter for each pathway; (iii) an intermediate model, in which some parameters were constrained for some classes. Accounting for penalisations for models with more degrees of freedom (see Methods and Supplementary Results 2), the best model belonged to scenario (iii) (RMSEA < 10−3, CI = (0–0.035), AIC = 6658, see Fig. 3 and Supplementary Table 6). This result supports the hypothesis that the classes had differentiated functional capacities (Supplementary Table 7 and Supplementary Fig. 16).
We then explored whether distinctive pathways for each class could be determined. Given the complexity of the SEM models, we first ruled out the possibility that differences in pathway coefficients were owing to the influence of other (confounding) variables. To control for this possibility, for each pair of endogenous–exogenous variables, we searched for its set of confounding variables with dagitty42. Next, for each pair of variables involved in a pathway, we performed a linear regression including its adjustment set of confounding factors, and an interaction term with a factor coding for the different classes. Coefficients should be interpreted as deviations with respect to the reference class (see Methods). The significant interaction terms (Fig. 3d) show how the relationships among the functional variables differed among the community classes. For example, the analysis revealed that cell yield was negatively influenced by β-chitinase activity for the Paenibacillus class, for ATP production for the Serratia class, while being positive related with β-glucosidase for the classes of Klebsiella and P. putida. We therefore concluded that the community classes had significantly different functional capacities, which produced the different relationships we observed in the models.
Community classes depict different genetic repertoires
To get a more mechanistic understanding of the above results, we analysed the genetic repertoire of each community class by performing metagenomic predictions with PiCRUST43, and further statistical analysis with STAMP44. The Nearest Sequence Taxon Index is 0.059, reflecting a high-quality prediction43 likely because most of the dominant genera in this system are found in gut microbiomes (e.g., Fig. 5 in ref. 45).
The fraction of exo-enzymatic genes belonging to Paenibacillus, Streptomyces and P. putida classes was significantly larger than the fractions found for the Klebsiella, Serratia classes and the reference class, suggesting that the former classes are specialised in degrading a wider array of substrates (Fig. 4).
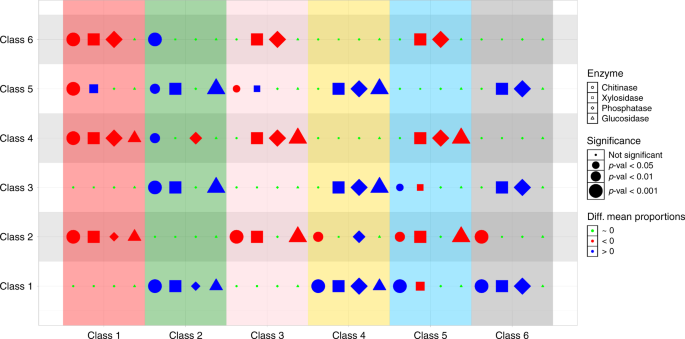
The significance of differences in mean proportions of chitinase (circles), β-xylosidase (squares), β-glucosidase (triangles) and phosphatase (diamonds) were tested across all pairwise combinations of community classes. Red (blue) symbols denote that the class in the correspondent column has a significantly lower (higher) mean proportion of the enzyme than the class shown in the row. The size of the symbol is larger for more significant differences. All tests are provided in Supplementary Fig. 4.
Clustering the KO annotations into KEGG pathways (see Methods) showed that the 6 community classes differed in their genetic repertoires. Furthermore, these divergent genetic repertoires suggested different ecological adaptations, which are summarised in Fig. 5. Consistent with PCA analysis of the KEGG pathways (Supplementary Figs. 19–22), we divided the classes in two groups: the reference, Klebsiella and Serratia classes carried the genetic machinery for fast growth, whereas Paenibacillus, Streptomyces and P. putida classes carried the genetic machinery for autonomous amino-acid biosynthesis. Evidence for fast growth in the reference, Klebsiella and Serratia classes comes from the large fraction of genes related with genetic information processing (Supplementary Fig. 25), mostly related with DNA replication such as DNA replication proteins genes, transcription factors, mismatch repair, homologous recombination genes or ribosome biogenesis—the latter being a good genetic predictor of fast growth46. Second, communities from these classes also carried a larger fraction of genes related with intake of readily available extracellular compounds (Supplementary Fig. 26), including ABC transporters, phosphotransferase system, or peptidases and environmental adaptations including motility proteins, synthesis of siderophores and the two-component systems. Rapid replication often requires a more accurate control of protein folding and trafficking, as the number of proteins and mRNAs increase with increasing growth rates47. Consistent with this hypothesis, we found a significantly inflated fraction of genes involved in folding stability, sorting and degradation, including chaperones and genes involved in the phosphorelay system (Supplementary Fig. 27).
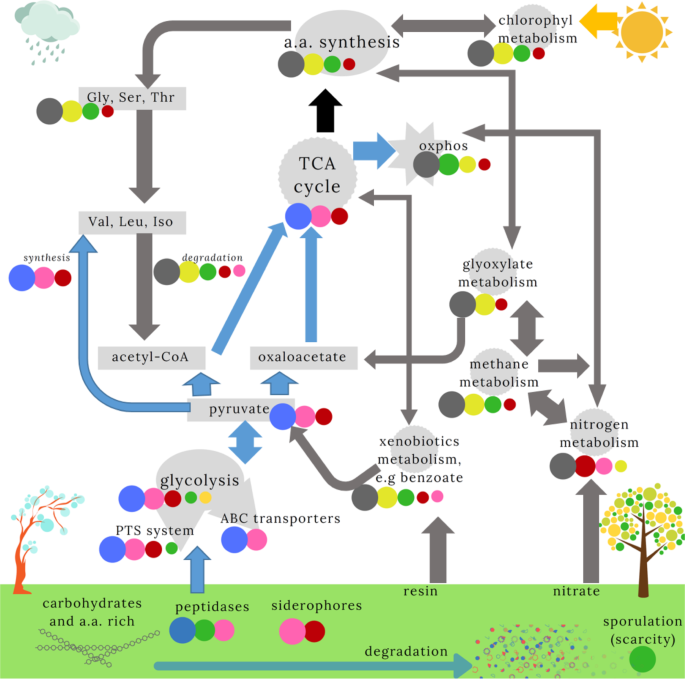
Pathways from the KEGG database that were most relevant for describing the classes are shown. We ranked the mean proportion of genes in each pathway (see Supplementary Results 3), indicated by the size of the circles (Fig. 4). Only classes with significant pairwise post hoc comparisons are shown. P. putida (grey) and Serratia (blue) classes appear to dominate orthogonal pathways. We therefore indicated how the pathways were influenced by the dominant community (indicated by the arrow colour). The link between the TCA cycle and amino-acid synthesis (black arrow) is unclear. We further illustrate the substrates and hypothetical environmental conditions expected for Serratia (rain/cold) and P. putida (dry/hot) communities. We suggest the other communities are intermediates between these two classes. The Paenibacillus class, with a large number of sporulation and germination genes, may reflect conditions of very low nutrient availability.
A second series of evidences pointing towards orthogonal ecological strategies came from differences in the metabolic pathways associated with the community classes. Serratia-dominated class (5) had an inflated fraction of genes related to carbohydrate degradation, including genes involved in glycolysis and in the trycaborxylic acid (TCA) cycle (Supplementary Fig. 28). In contrast, the Paenibacillus, Streptomyces and P. putida classes were associated with genes involved in alternative pathways like nitrogen/methane metabolism, and in secondary metabolic pathways related with degradation of xenobiotics/chlorophyl metabolism. Notably, the genes involved in the exoenzymes that were experimentally assayed were higher in these classes, suggesting that they were adapted to environments with more recalcitrant nutrients (Fig. 5). In addition, Paenibacillus, Streptomyces and P. putida classes had a remarkable repertoire of genes for amino acids biosynthesis–possibly at odds with the reference class and Klebsiella and Serratia classes, which invested in proteases for amino acid uptake (Supplementary Figs. 29, 30). The apparently low-glycolytic capabilities of these communities could result in pyruvate deficiencies, which would hindered the production of sufficient acetyl-CoA and oxaloacetate required to activate the TCA cycle. Consistent with this observation, we observed that these communities exhibited a significantly larger proportion of genes related with glyoxylate metabolism and degradation of benzoate, which may be used as alternatives to glycolysis (Supplementary Fig. 31). Finally, we observed that communities in the reference class and Klebsiella and Serratia classes had a significantly larger repertoire of genes needed to synthesise amino acids requiring pyruvate (valine, leucine and isoleucine), and which, according to our interpretation, they would generate through glycolysis (Supplementary Fig. 28). By contrast, Paenibacillus, Streptomyces and P. putida classes had a significantly larger proportion of genes used to degrade these amino acids (Supplementary Fig. 29) and hence, either they take these essential amino acids from the environment or they generate them from other pathways. Consistent with this observation, genes in these classes were enriched for glycine, serine and threonine metabolism (Supplementary Fig. 29), through which it is possible to obtain valine, leucine and isoleucine, and which could provide an alternative source of acetyl-CoA (Fig. 5).
Source: Ecology - nature.com


