Absolute phototactic behaviour depends on wavelength and past experience
In its simplest form, phototaxis consists in making a choice between light and no light – what we called “absolute phototaxis”. Does absolute phototaxis depend on wavelength? And can it be modulated by exposure or aversive training against a specific wavelength? To answer these questions, we trained bees in the yAPIS (Fig. 1A)23 using a classical aversive conditioning design (Fig. 2A): we paired electric shocks with a conditioned stimulus (CS, here a light) for trained bees, while control bees received both shocks and CS but not in close temporal association (unpaired group). We then analyzed their behaviour during tests in which the choice arms were lit with the same stimulus. Depending on the training protocol, this stimulus could thus be: 1) novel (N) to the bees, meaning they had not seen this wavelength before (but they had seen a different wavelength, and received unpaired electric shocks), 2) they were exposed (E) to this particular wavelength and to shocks but not in close temporal association, or 3) they were trained (T) by pairing this wavelength to electric shocks (see Fig. 2A for an overview of the different groups). Importantly bees never received shocks during the tests, so they had no incentive to move towards the lights other than phototactic drive.
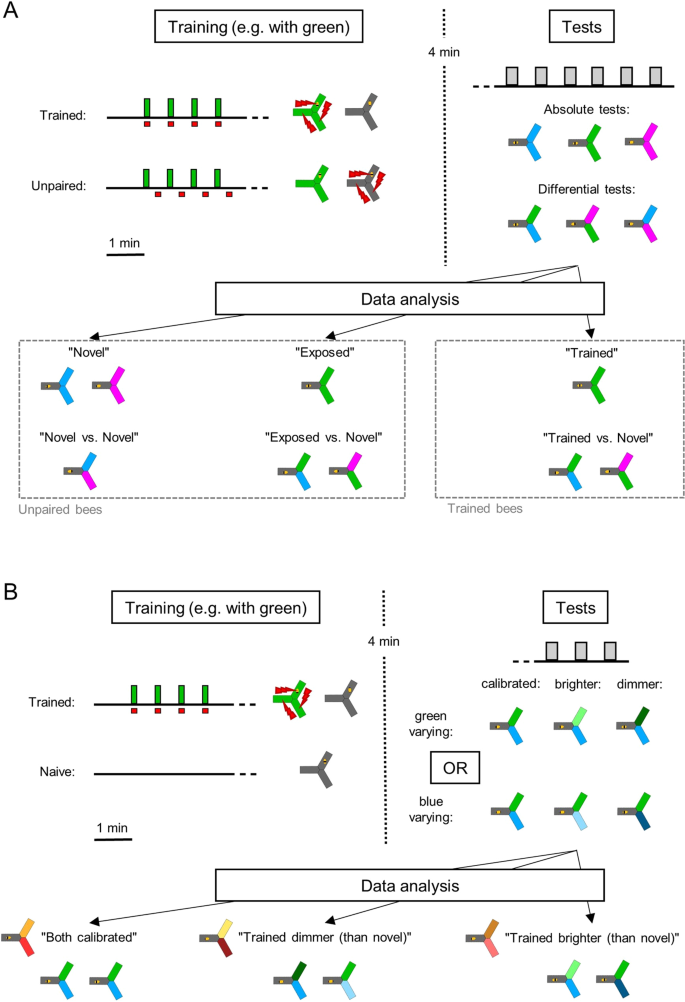
Experimental design. (A) Main experiment. First, all bees had 1 min to habituate to the apparatus in the dark. In the trained group, a wavelength (green in this example) was then paired with electric shocks (4 × 10 s, spaced by 30 s in the dark). The unpaired controls also experienced both the light and the shocks, but these were delivered in the middle of the 30 s inter-trial interval. After a resting period of 4 min in the dark, all bees were tested 6 times for their wavelength-preference and phototactic behaviour (20 s tests separated by 30 s). During each test, the bee always started in the dark arm and could choose to enter two lit arms, which could be of the same wavelength (absolute tests) or of different wavelengths (differential tests). For subsequent data analysis, we differentiated the behaviour of the bees towards novel wavelengths, towards a wavelength they had seen but was not paired with shocks (exposed) and towards the wavelength they had been trained to. A total of 6 groups (trained + unpaired for all 3 wavelengths) of 96 bees each participated in the experiment. B. Experiment with varying light intensities. During the first phase, trained bees received shocks paired with one wavelength as before (green in this example). Naive bees spent the same time inside the apparatus but were not stimulated. All bees then participated in 3 tests, during which only one of the wavelengths varied in intensity. For analysis, the data was pooled such that “Trained dimmer (than novel)” included both “bright trained vs calibrated novel” and “calibrated trained vs dim novel” configurations (and vice-versa for “Trained brighter (than novel)”). Half of the naive bees (randomly selected) were attributed green as “trained” wavelength, the other half blue. Since there were 3 different trainings possible (naive + green trained + blue trained) and 2 wavelengths varying (blue varying + green varying), a total of 6 groups of 48 bees each participated in the experiment.
We used light intensities calibrated for equal preference between wavelengths (see Fig. 1E and Methods). Nonetheless, we first checked for wavelength-specificity by focusing on the bees’ behaviour towards novel lights (Fig. 3A1-D1, statistics in black). To evaluate the bees’ attraction to a light, we measured the percentage of bees entering (or not) and the delay to enter as proxys for initial attraction, and the percentage of time spent into a light and of bees exiting the light as proxys for how this attraction persists over time. All lights were clearly attractive as nearly all bees entered them (Fig. 3A1), but bees spent longer in the UV than in the blue or green light, and longer in green than in blue (Fig. 3B1; Wilcoxon signed rank tests corrected with FDR, UV vs blue: z = −7.054, p < 0.001; UV vs green: z = −5.671, p < 0.001, blue vs green: z = −2.394, p = 0.017). This could in part be explained by a shorter delay in entering UV than blue or green (Fig. 3C1; ANOVA, F(2,573) = 13.99, p < 0.001, followed by pairwise Tukey’s HSD, UV vs blue: p < 0.001; UV vs green: p < 0.001, blue vs green: p = 0.282). Furthermore, about a third of the bees (36%) left the blue arms before the end of the test, against less than 10% for UV and 23% for green (Fig. 3D1; Cochran Q test Q(2,192) = 48.32, p < 0.001, post-hoc χ2 corrected with FDR, UV vs blue: χ2 (1,192) = 36.855, p < 0.001, UV vs green: χ2 (1,192) = 12.675, p < 0.001, blue vs green: χ2 (1,192) = 7.186, p = 0.073). A clear overall pattern emerges from this data: when the stimulus is novel, UV has the strongest phototactic strength whereas blue has the weakest, with green showing intermediate attractiveness.
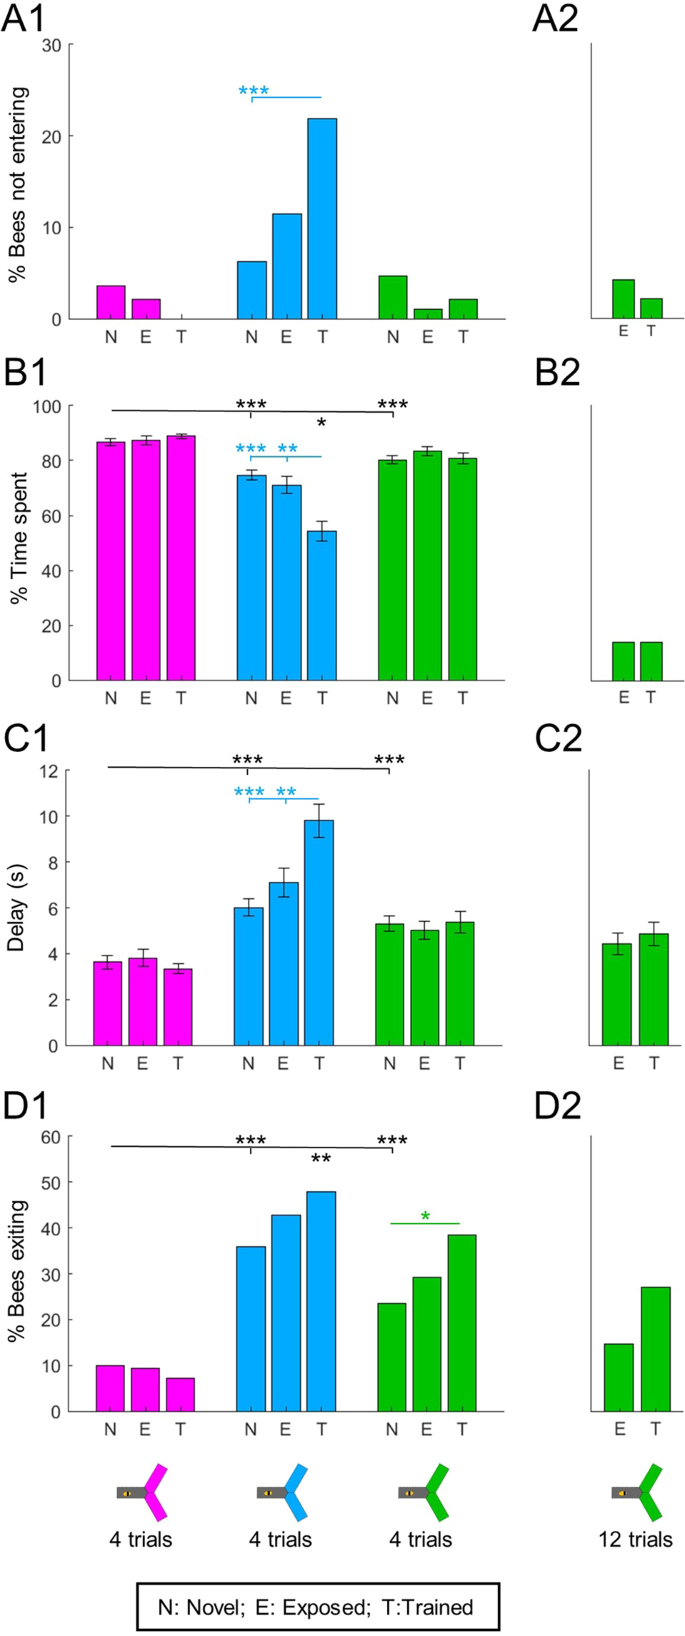
Absolute phototaxis depends on wavelength and previous experience. Absolute phototactic behaviour was tested for all 3 wavelengths and for all possible experiences with each wavelength: novel (N), exposed (E) or trained (T) – from unpaired or trained bees, see Fig. 2A. The main experiment is presented on panels A1-D1. It was repeated with more exposure/training trials for green (12 instead of 4): this 2nd dataset is presented in panels A2-D2. (A) Less than 5% of bees did not enter novel lights. The proportion of bees refusing to enter only increased after training with blue. χ2 tests. (B) The percentage of time spent in the lit arms was different for each wavelength. For the blue light only, training decreased the time spent in the lit area. Wilcoxon signed rank tests, corrected with FDR. (C) Delay before entering the lit arms after light onset. Bees entered the UV light faster than blue or green. An increased delay after aversive training was only observed for the blue light. ANOVA followed by pairwise Tukey’s HSD. (D) Percentage of bees that exited the light at some point during the test. The proportion of bees exiting was different for each wavelength. This number increased after training for the green light, and a similar but non-significant trend was observed after training with blue. χ2 tests. nN = 192; nE = nT = 96; ntotal = 288, *p < 0.05, **p < 0.01, ***p < 0.001.
Did past experience (exposure or training) affect absolute phototaxis? We found that it did, but again in a wavelength-specific manner (Fig. 3A1-D1, statistics in colour). Attraction to UV was unaffected by past experience, with no significant change detected in any of the 4 measures. However, training decreased attraction to blue, as evidenced by some bees completely refusing to enter this light (Fig. 3A1, χ2 corrected with FDR, novel vs exposed: χ2 (1,288) = 2.363, p = 0.124, novel vs trained: χ2 (1,288) = 15.401, p < 0.001, exposed vs trained: χ2 (1,192) = 3.75, p = 0.079). Training also reduced the percentage of time spent in blue (Fig. 3B1; Wilcoxon signed rank tests corrected with FDR, novel vs trained: z = 4.385, p < 0.001, exposed vs trained: z = 3.256, p = 0.002, novel vs exposed: z = 0.313, p = 0.754), and the delay to enter was increased (Fig. 3C1; ANOVA, F(2,381) = 13.13, p < 0.001, followed by pairwise Tukey’s HSD, novel vs trained: p < 0.001, exposed vs trained: p = 0.004, novel vs exposed: p = 0.311). The trend for more bees to exit from the blue light after exposure or training was not statistically significant (Fig. 3D1; χ2 corrected with FDR, novel vs exposed: χ2 (1,288) = 1.243, p = 0.265, novel vs trained: χ2 (1,288) = 3.829, p = 0.151, exposed vs trained: χ2 (1,192) = 0.525, p = 0.703). Attraction to green was only marginally affected by training, the only significant change being that more bees made excursions out of this light (Fig. 3D1; χ2 corrected with FDR, novel vs exposed: χ2 (1,288) = 1.110, p = 0.292, novel vs trained: χ2 (1,288) = 7.169, p = 0.022, exposed vs trained: χ2 (1,192) = 1.884, p = 0.255). This could have been an intermediate state towards the more pronounced changes observed after training with blue. To test this hypothesis, we repeated the experiment with 2 additional groups of bees (1 unpaired control + 1 trained), but this time the bees received 12 training trials instead of 4 (Fig. 3A2-D2). Even with this increased training, there was only a trend (χ2 (1,96) = 2.274, p = 0.132) for more bees to exit the light (Fig. 3D2), the other measurements did not change to a relevant degree. Thus the differences we observed between wavelengths likely represented intrinsic properties of aversive conditioning with each particular wavelength.
Differential phototaxis can be temporally complex
Even after aversive training, the vast majority of bees still entered the lights during absolute tests (except for blue), such that only quantitative differences could be measured. We reasoned that the phototactic drive may be very strong, and that providing the bees with a second, alternative wavelength could be a more powerful way to uncover a learned aversion (differential phototaxis). Since our analysis of absolute tests hinted at wavelength-specific differences in response delay and persistence, we first looked at the temporal dynamics of differential tests in the cases where the two wavelengths were novel. First, we confirmed that the chosen stimulus intensities yielded equal preference when averaged over 20 s observation time, as per our calibration data (Fig. 4A, Wilcoxon signed rank tests, blue vs green: z = −0.748, p = 0.454, green vs UV: z = 1.310, p = 0.190, blue vs UV: z = 1.171, p = 0.242). For the blue vs green test, the first choice of bees was random (Fig. 4B, top panel, χ 2 tests against no bias, χ 2(1,96) = 0.27, p = 0.604) and this balance was maintained during the whole test (Fig. 4C, top panel). However, when UV was involved, the picture was quite different: most bees first chose blue or green (χ2 tests against no bias, blue vs UV: χ2(1,96) = 6.19, p = 0.013, green vs UV: χ 2(1,96) = 12.38, p < 0.001). The preference for UV then increased over time, becoming stronger than for the alternative wavelength after 10–12 s. Thus, the test averaged preference hid a complex temporal pattern. It is intriguing that the UV light, which elicited the shortest response delay in absolute phototaxis tests, had slower dynamics in differential phototaxis tests (despite being presented at the same intensity).
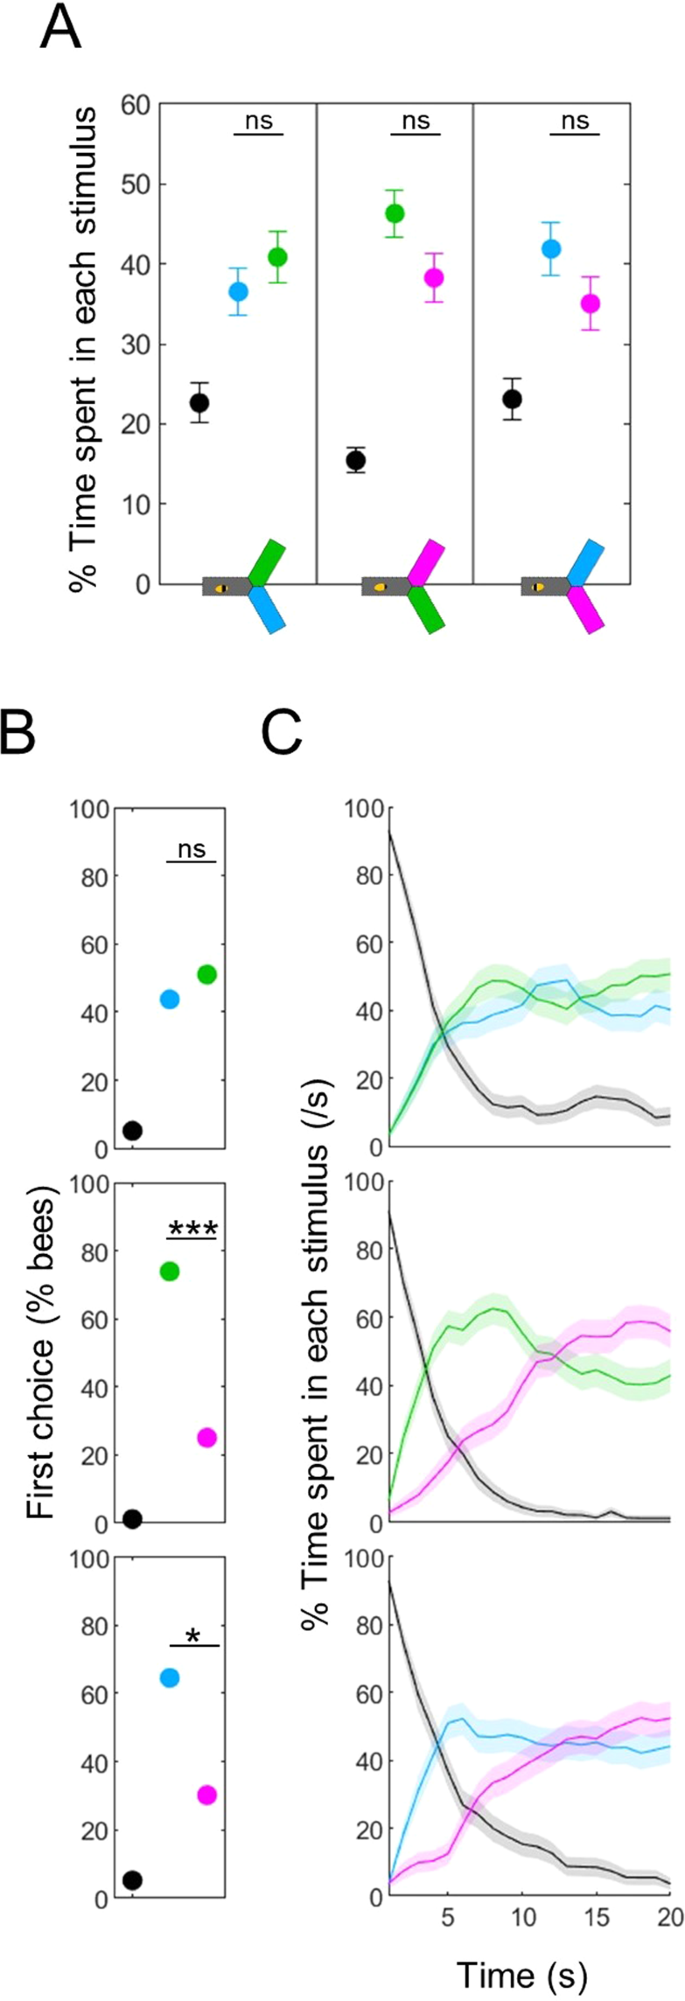
Differential phototaxis has a temporal complexity. (A) Percentage of time spent in each stimulus. Control (unpaired) bees presented with a choice between two novel lights spent a similar amount of time in both wavelengths, consistent with the calibration data. Wilcoxon signed rank tests, corrected with FDR. (B) Percentage of bees first entering into each light (black = no choice made). The first choice was biased in the tests including UV, such that bees initially preferred the other wavelength. χ2 tests against random choices between the two wavelengths. (C) Density of bees within each stimulus over time. When the test included UV, bees initially chose the other wavelength but then switched their preference. n = 288, *p < 0.05, ***p < 0.001, ns: p > 0.05.
Previously experienced stimuli are less attractive than novel ones
Having characterized the baseline behaviour of bees during differential tests allowed us to investigate how it was modified by previous experience with a wavelength. Our first question was: can simple exposure to a light modify phototaxis? To answer this question, we analyzed the responses of bees that experienced both one wavelength and the shocks, but separated by a delay of 10 s to prevent association between the two events24. These bees spent less time in the exposed wavelength than when both were novel, irrespective of the wavelength (Fig. 5A1). This was easier to see when pooling the data (Fig. 5A2, Wilcoxon signed rank tests corrected with FDR, exposed vs novel 1: z = −3.880, p < 0.001, exposed vs novel 2: z = 2.960, p = 0.005, novel 1 vs novel 2: z = −0.303, p = 0.762). Could it be that 10 s spacing was not enough to prevent an associative memory? To check this, we repeated the experiment but removed the shocks completely (CS-only groups, n = 48 bees for each wavelength). Again, bees preferred a novel wavelength over the one they had been exposed to (Fig. 5B1–2, Wilcoxon signed rank tests corrected with FDR for pooled data, exposed vs novel 1: z = −2.811, p = 0.007, exposed vs novel 2: z = 3.890, p < 0.001, novel 1 vs novel 2: z = 1.580, p = 0.114). Thus, visually experiencing a light was sufficient to reduce the attractiveness of that particular wavelength.
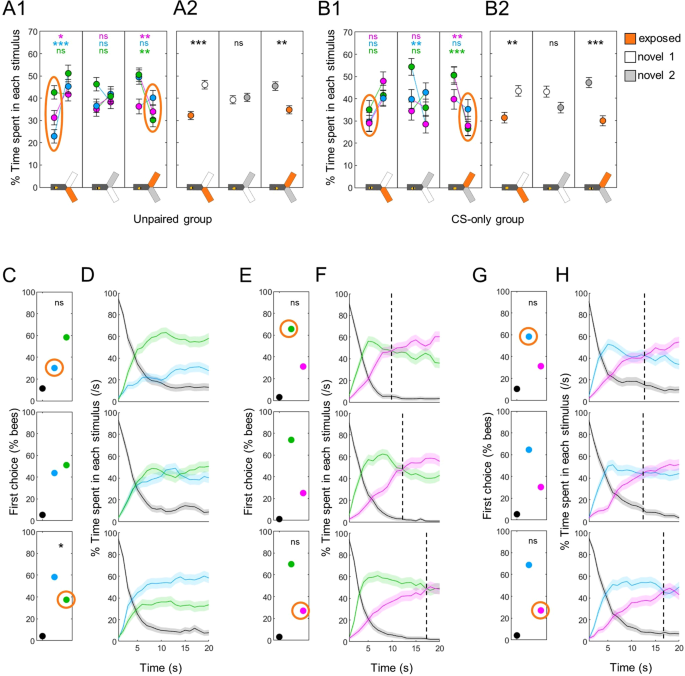
Differential phototaxis is modified by previous exposure. (A) Percentage of time spent in each stimulus. A1 presents the data for each individual group (UV-, blue- and green-exposed bees), A2 presents the pooled data. Overall, bees in the unpaired group avoided the wavelength they had seen before. Wilcoxon signed rank tests with FDR correction. (B) Same as in A for the CS-only group, in which the shocks were completely removed. A similar avoidance of the seen wavelength was observed. (C) First choice in blue versus green tests was also modified depending on experience (seen wavelength circled in orange). χ2 tests against bees for which both wavelengths were novel (middle row). (D) Time course of blue vs green tests. The bias in preference was maintained throughout the test. (E,G) First choices for UV versus green/blue were not modified by exposure. χ2 tests against bees for which both wavelengths were novel (middle row). (F,H) Time courses of UV vs green/blue tests, respectively. The time at which the switch in preference occurred (dotted lines) was modified by previous exposure to one of the test wavelength. n = 144 for panel B (CS-only groups), n = 288 for all other panels (unpaired groups), *p < 0.05, **p < 0.01, ***p < 0.001, ns: p > 0.05.
This bias in preference was also visible in the test dynamics. For differential phototaxis between blue and green, the previously exposed stimulus was already less preferred as first choice (Fig. 5C, χ2 tests against bees for which these stimuli were both novel, blue seen: χ2(1,192) = 2.64, p = 0.104, green seen: χ2(1,192) = 3.98, p = 0.046, the reference bees are plotted again in the middle row), and this remained throughout the 20 s observation time (Fig. 5D). When UV was involved the qualitative effect was different: the first choice remained biased toward the alternative stimulus, with no statistically significant shift (Fig. 5E,G). However, the time of the shift in preference between UV and the alternative stimulus was delayed after exposure to UV (from ~12 s to ~17 s), and advanced after exposure to blue or green (to ~10 s; Fig. 5F,H).
Classical aversive conditioning further decreases the attractiveness of trained stimuli
While exposure was sufficient to create a mild aversion to a wavelength, we expected the aversive training to trigger a more pronounced avoidance. Indeed, irrespective of the wavelength used, bees spent very little time in a trained stimulus, preferring the novel ones (Fig. 6A1-2; Wilcoxon signed rank tests corrected with FDR for pooled data, trained vs novel1: z = −7.412, p < 0.001, novel1 vs novel2: z = 1.580, p = 0.042, trained vs novel2: z = 9.749, p < 0.001). This aversion for the trained light could be seen from the very beginning of the test in all cases: when compared to bees for which both wavelengths were novel (i.e. bees trained to the 3rd wavelength), a shift in the first choice could be measured in blue vs green tests (Fig. 6B, χ2 tests, blue trained: χ2(1,192) = 8.38, p = 0.004, green trained: χ2(1,192) = 11.90, p < 0.001) and in tests opposing green to UV (Fig. 6D, χ2 tests, green trained: χ2(1,288) = 11.91, p < 0.001, UV trained: χ2(1,288) = 4.43, p = 0.035). Blue vs UV tests followed a similar but non-significant trend (Fig. 6F, χ2 tests, blue trained: χ2(1,288) = 2.03, p = 0.154, UV trained: χ2(1,288) = 2.42, p = 0.120). As was already the case after exposure, this bias in preference was maintained throughout the test in the blue vs green configuration (Fig. 6C). For tests including UV, the major effect was again in the dynamics: the shift in preference occurred only ~5 s after the start of the test when the bees were trained against UV (whereas it took 10–15 s for control bees to reach this tipping point), and was delayed beyond the 20 s of the test after training against blue or green (Fig. 6E,G). Direct comparisons between the trained and unpaired groups confirmed that classical aversive conditioning further reduced the time spent in the trained wavelength during differential tests (Fig. 7A, Suppl. Table 1).
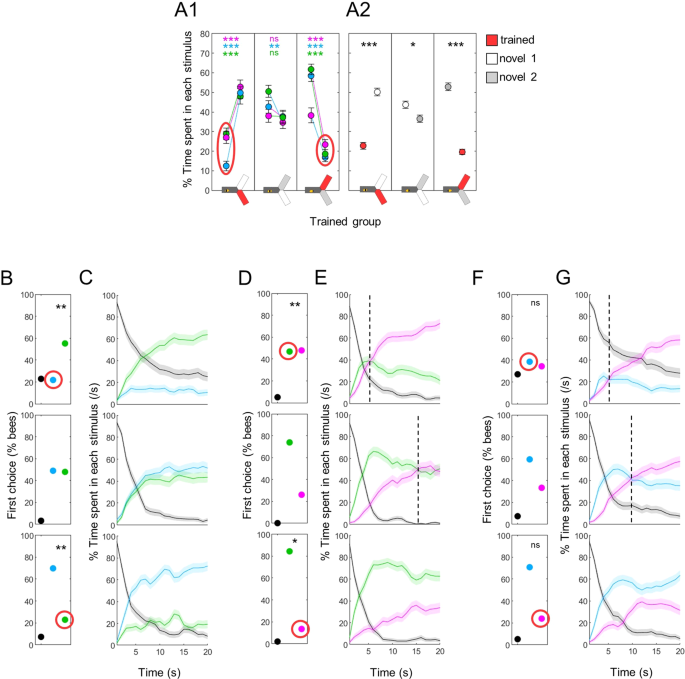
Phototaxis is further modified by training. (A) Percentage of time spent in each stimulus. A1 presents the data for each individual group (UV-, blue- and green-trained bees), A2 presents the pooled data. Bees avoided the wavelength that had been paired with shocks. Wilcoxon signed rank tests with FDR correction. (B) First choice in blue versus green tests was modified after training (trained wavelength circled in red). χ2 tests against bees trained to UV (middle row). (C) Time course of blue vs green test. The bias in preference was maintained throughout the test. (D) First choice for UV versus green was modified by training. χ2 tests against bees trained to blue (middle row). (E) Time course of UV vs green test. The time at which the switch in preference occurred (dotted lines) was modified when one of the test wavelength had been paired with shocks. (F) First choice for UV versus blue was not significantly modified by training. χ2 tests against bees trained to green (middle row). (G) The time at which the switch in preference occurred (dotted lines) was modified after one of the test wavelength had been paired with shocks. n = 288, *p < 0.05, **p < 0.01, ***p < 0.001.
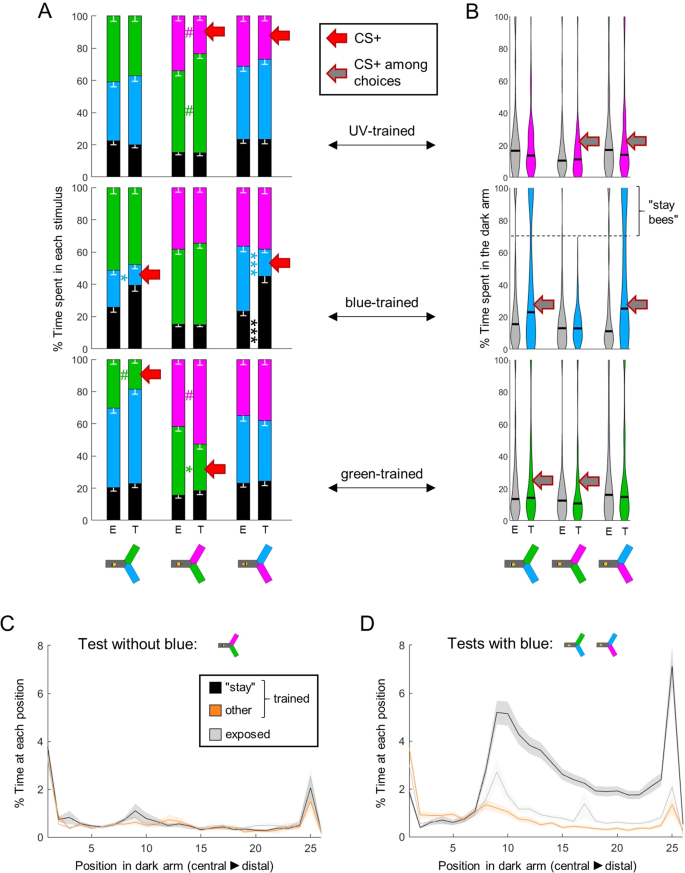
Learning strategy depends on the trained wavelength. (A) During training, shocks were paired with one wavelength (CS+, red arrow) in trained animals (T), while exposed bees (E) received unpaired shocks. For each group of bees, the percentages of time spent in the environments available during a given test (e.g. dark, blue and green) were plotted and stacked into a single bar. Since we included all environments, the resulting stack always totalize 100% (the whole test duration). Data is represented as mean – s.e.m.; Mann-Whitney U tests comparing E to T, corrected with FDR. (B) Distribution of the percentage of time spent in the dark arm. After training with blue, many bees remained in the dark arm rather than making a choice if blue was present. We categorized those bees that stayed in the dark >70% of the time during at least one test as “stay bees”. (C) Spatial density of bees within the dark arm, during the test without blue (nstay = 53; nother = 43; nexposed = 96). (D) Same as C during tests including blue. A clear threshold is visible around position 9 that “stay bees” do not cross. n = 576, *p < 0.05, **p < 0.01, ***p < 0.001, # 0.05 > p > corrected threshold.
The avoidance strategy depends on the trained wavelength
In differential tests, bees had 2 possibilities to avoid the trained wavelength: they could choose the arm with the alternative wavelength, or they could remain in the dark arm (where they always started). Which of these options did they use? We compared the behaviour of trained bees to the behaviour of exposed (unpaired) bees to answer this question, and found that once more, their strategy was dependent on the wavelength. Training against UV or green only shifted the preference of the bees to the alternative wavelength available, whereas training against blue did not affect the time spent in the alternative wavelength (Fig. 7A, Suppl. Table 1; note that the small effect sizes are due to exposed bees already exhibiting some aversion towards the light as was shown in Fig. 5). Instead, training against blue increased the time spent in the dark (Fig. 7A, Suppl. Table 1, also visible in the upper panels of Fig. 6C–G). We confirmed this observation by looking more closely at the time spent by individual bees inside the dark arm (Fig. 7B). Strikingly, some of the bees trained to associate blue with electric shocks spent most of their time in the dark, specifically in tests in which blue was presented. This specificity is important, because it means that positive phototaxis was not generally decreased in those bees.
To better understand this behaviour, we separated bees that stayed in the dark arm over 70% of their time during at least one test (any test), termed “stay bees” (n = 53), from the remainder bees (n = 43). In tests without blue, these two subgroups behaved similarly inside the dark arm (Fig. 7C). When the blue light was present, “stay bees” not only remained in the dark arm, they remained in the far end of that arm. A clear threshold was visible around position 9, which corresponds to a distance of ~ 5 cm from the decision point (Fig. 7D). At this distance, the blue light had a viewing angle of ~12.5° horizontally and ~15.9° vertically. It is interesting that this is within the range of the viewing angle necessary for bees to evaluate chromaticity (~15°)14. However, we have to exert caution as this also corresponds to the position of a slit through which air is extracted from the yAPIS, and we noted earlier that bees tend to turn at this position even in the absence of any light stimulus23.
The trained aversion is superimposed on intensity-driven preferences
In all the results presented so far, light intensities were calibrated to ensure equal preference between any 2 wavelengths in naïve bees (Fig. 1E). In this final experiment, we investigated how deviations from these settings would affect the bees’ performance. Would the intensity difference completely override learning, such that bees would always go to the brightest light? Or, in other words, is there a hierarchy in how bees integrate information about a light? We addressed this question by training bees with either blue or green, and then by varying the intensity of one stimulus during the tests (either the trained one or the novel one; see Fig. 2B for protocol). Hence we had 4 groups of trained bees: “blue trained & blue varied”, “blue trained & green varied”, “green trained & green varied” and “green trained & blue varied”. We only used blue and green lights in this experiment because the bees’ behaviour was easier to interpret in these differential tests. We also included 2 groups of control (naïve) bees which did not receive any stimulation during the training phase (to avoid the exposure effect demonstrated previously): “blue varied” and “green varied”. Each of these control groups was randomly split in 2 to replicate the 4 groups of trained bees (i.e. green was considered the trained wavelength for half of the bees, and blue for the other half). The aim of this slightly complicated design was twofold: 1) cancelling wavelength-specific effects by having symetrical roles for blue and green; and 2) checking if the bees’ behaviour was dictated by the difference in intensities independently of the role of the varied stimulus (trained or novel). The behavioural pattern that we describe in detail below was the same in all groups (Suppl. Fig. 2): neither which wavelength was trained nor which stimulus was varied in the test changed the results. Therefore, we pooled the data, with the tests classified into 3 categories: “both lights calibrated”, “trained dimmer (than novel)” and “trained brighter (than novel)”.
As expected, deviations from the calibrated settings induced biases in preference in naïve bees, such that they always chose the brightest of the two wavelengths (Fig. 8A1–2; Wilcoxon signed rank tests corrected with FDR for pooled data, trained dimmer: z = −2.551, p < 0.001, both calibrated: z = 1.909, p = 0.056, trained brighter: z = 2.264, p < 0.001). This preference for the brightest light was also obvious in the bees’ first choices (Fig. 8D; χ2 tests against calibrated lights, trained dimmer: χ2(1,96) = 16.49, p < 0.001, trained brighter: χ2(1,96) = 6.39, p = 0.011), and was maintained throughout the tests (Fig. 8E). Trained bees, on the other hand, only showed a preference for the brightest light when it was novel (Fig. 8B; Wilcoxon signed rank tests corrected with FDR, trained dimmer: z = −8.868, p < 0.001, both calibrated: z = −7.120, p < 0.001, trained brighter: z = 0, p = 1). Direct comparisons confirmed that trained bees spent less time than naïve bees in the wavelength associated with shocks in all tests, independently of relative intensities (Fig. 8C; Suppl. Table 1). Thus, the intensity bias did not override the learned aversion. But the aversive training by itself also did not fully account for the bees’ behaviour: the shifts in intensity modulated both the time spent in each light (Fig. 8B) and first choice (Fig. 8F; χ2 tests against calibrated lights, trained dimmer: χ2(1,192) = 4.34, p = 0.037, trained brighter: χ2(1,192) = 26.68, p < 0.001). In particular, when the trained wavelength was brighter, trained bees still had a slight preference for it at the beginning of the test before switching to the novel (but dimmer) light (Fig. 8G). Taken together, these results demonstrate that bees clearly integrated both intensity and experience into an overall valence when comparing the two stimuli.
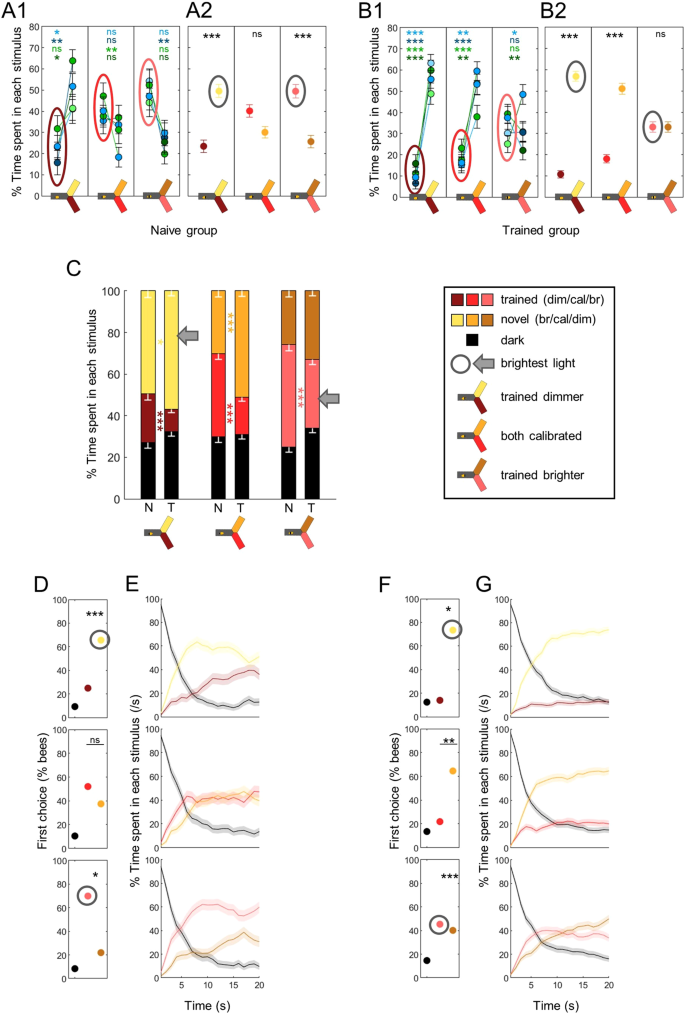
The trained aversion is superimposed on the innate preference. During training, shocks were paired with one wavelength for trained animals (T), while naïve bees (N) were not stimulated. Lighter colors indicate lights brighter than the calibrated reference, darker colors indicate lights dimmer that the calibrated reference. (A) Percentage of time spent in each stimulus, for naïve bees. A1 presents the data for each pair of trained-varied wavelength (blue-green stats are in blue, blue-blue in dark blue, green-blue in green and green-green in dark green), A2 presents the pooled data. Wilcoxon signed rank tests with FDR correction. (B) Same as in A but for trained bees. (C) Percentages of time spent in the environments available during a given test (dark, trained and novel) plotted and stacked into a single bar. Trained bees spent less time than naive bees in the light previously associated with shocks, independently of its relative brightness. Mean – s.e.m, Mann-Whitney U tests comparing N to T, corrected with FDR. (D) The first choice of naive bees was always biased toward the brightest light (circled in grey). χ2 tests against calibrated intensities (top row), or against a random choice for this reference test. (E) Time courses for naïve bees. The preference was maintained throughout the test. (F) The first choice of trained bees was modulated by both training and brightness. χ2 tests against calibrated intensities (top row), or against a random choice for this reference test. (G) Time courses for trained bees. The first choice was corrected during the test if it contradicted the training paradigm. n = 576, *p < 0.05, **p < 0.01, ***p < 0.001, ns: p > 0.05.
Source: Ecology - nature.com
