Delineation of pangenomes and habitats descriptors
The basis of this study is a large collection of pangenomes from a diverse set of prokaryotic species. To establish this collection, we filtered the proGenomes database of annotated prokaryotic genomes [32] to select consistently defined species (see “Methods”, also [31]) for which at least ten high-quality genomes (conspecific isolates/strains/genomes; further referenced as strains or genomes) were available (Fig. 1, also see “Methods”). For each of the resulting 155 species, we computed 21 pangenome features (ranging from pangenome saturation to functional distance, see Fig. 2a and Supplementary Table 1). These features have been shown to characterize different aspects of the pangenome structure and have been previously used in pangenome analyses of individual microbial species [6, 47]. Partitioning the pangenome into subcomponents (“core”, “shell”, “cloud”; see “Methods”) enabled us to relate the evolutionary adaptations of core and accessory genome features to environmental pressures separately. Pangenome subcomponents varied in size, for example, average core-genome size was in the range of 443–5,964 genes; average pangenome size—959–17,739 genes; average shell 18–2,409; average cloud—5–839 genes. We further annotated all genomes and species with regards to their habitat preferences. Yet, environmental metadata for many isolates and prokaryotic species are incomplete and biased towards clinically relevant host-associated annotations, leaving the ecological niches of many species under-characterized. To improve habitat assignments, we used multiple, conceptually different habitat databases. More specifically, we merged the information obtained from the PATRIC database [34], the Microbial Atlas Project database (http://devel.microbeatlas.org/) and the Global Microbial Gene Catalog (http://gmgc.embl.de). This resulted in detailed and accurate habitat annotations using 83 habitat descriptors (see “Methods” and Supplementary Table 3). On average, each species was present in 16.5 ± 7.8 (out of 62 possible) habitats in Microbial Atlas Project; 2.4 ± 1.1 (out of 5 possible) from manually curated PATRIC habitat annotations; and 3.6 ± 2.8 (out of 16 possible) in the Global Microbial Gene Catalog (Supplementary Table 3).
Interdependencies of pangenome features
The relationships between different pangenomes features can be an indication of similar evolutionary pressures acting on the related features. Further, correlations between different features can decrease the accuracy of analyses when not considered. The number of genomes used to infer a species’ pangenome needs to be accounted for as it can potentially influence the calculation of some of these features. Hence, we estimated interdependencies for (i) the number of conspecific strains (the number of genomes per pangenome), (ii) the 21 computed pangenome features, (iii) species ubiquity, and (iv) habitat preference (see Supplementary Table 3 for estimates of pangenome features, Supplementary Table 1 for definition and Supplementary Table 4 for correlation summary) (Fig. 2a). Estimates of pangenome size and the size of its components (core, shell, and cloud) are strongly correlated with each other (Fig. 2a). As expected, mean genome size strongly correlated with several features, including core-genome size (Spearman Rho = 0.955, p < 0.00001), pangenome size (0.963, p < 0.00001), and core-genome nucleotide diversity (0.373, p = 0.00003), indicating that a species’ average genome size is highly predictive of its pangenome features, especially pangenome size. While these results confirm the accuracy of our methodology, we found some pangenome features to be unreliable due to their observed associations with sample size (number of conspecific strains). Significant correlations were found for core-genome saturation, core-genome size, total pangenome size, as well as the sizes of “cloud” and “unique genes”, indicating that sampling biases might affect these features. Hence, we excluded these features from our in-depth analyses. For pangenome and core-genome sizes, we used average normalized size features instead (average of 30 random combinations of nine genomes per species, see Supplementary Table 1 and Supplementary Fig. 1).
Among the reliable features, we unexpectedly found the several pairs of conceptually related pangenome features, which were not correlated. For example, the relationship between genome fluidity [47] and pangenome saturation was not significant (Spearman Rho = 0.15, p = 0.72), despite the fact that both measures are commonly used to estimate the openness of pangenomes [8, 47] (Supplementary Table 1). This might indicate that these two measures characterize different aspects of pangenome openness. Previous studies have hypothesized an implicit sampling bias as a possible explanation for this observation [47], but we did not detect a significant relationship with the number of sampled genomes in our large dataset for either of the two features.
Furthermore, the average pairwise functional distance (average Jaccard distance based on orthologous groups) between conspecific strains positively correlated to the vast majority of pangenome features (Fig. 2a). Only three pangenome features were not significantly correlated to the average pairwise functional distance, namely the size of the extended core, the number of conspecific strains (number of conspecific genomes used to compute pangenome features) and ubiquity (see Supplementary Table 4 for Spearman Rho and p values). We further found that species with larger genomes tend to have a higher functional diversity (Spearman Rho = 0.48, 6.5e–9), mainly driven by changes in the size of the pangenome shell. This seems to imply that functional diversity is maintained within a substantial fraction of organisms in species with larger genomes.
To study which factors shape pangenome features, we performed variance partitioning on 9 out of 21 features representing qualitatively different pangenome properties that are practically unaffected by sample size (nonsignificant correlations with Spearman Rho close to 0, see Fig. 2a). We explored the interdependencies of these nine pangenome features by clustering them according to their correlation strengths and identified two subgroups (Fig. 2b, see also Supplementary Table 5). These subgroups split the features into diversity estimates (core-genome nucleotide diversity, functional distance, and genome fluidity) and size estimates (average genome, pangenome, core, shell, and cloud) implying differing evolutionary dynamics for these feature groups. Specifically, size-related pangenome features were better explained by phylogenetic and environmental preference compared with diversity estimates (Fig. 2b). We also show that, after correcting for within-species diversity, a substantial amount of variance is still explained by environmental preferences and phylogeny (Fig. 2b). These observations are highly relevant for understanding the adaptiveness and evolution of pangenomes, which have been under ongoing discussion [8].
Species ubiquity is related to core-genome size
All surveyed species are present in multiple habitats (Supplementary Table 3) and the transition between free-living and host-associated lifestyles were observed frequently on both micro- and macro-evolutionary (and ecological and evolutionary) timescales, imposing multidirectional pressures on the evolution of their genome architecture [64]. Species ubiquity is a potentially important factor contributing to the evolution of specific pangenome features that needs to be considered, because species with broad ecological niche are likely to have different evolutionary constraints compared with specialists [65]. We operationally defined species ubiquity as the sum of all positive associations with each habitat in the Microbe Atlas Project dataset (see “Methods”), which provides the most comprehensive habitat annotations for our datasets. Broader ecological niches and higher ubiquity have been suggested to be associated with larger and more functionally versatile genomes [66]. Therefore, we investigated the relationship between the ubiquity of each species with its pangenome features in depth and found several associations (Fig. 2a). We observed a moderate, but significant association of species ubiquity (Fig. 3a) with average normalized core-genome size (average core-genome size of random combinations of nine genomes, Supplementary Fig. 1) and pangenome saturation. Other pangenome features were not correlated with ubiquity after correcting for phylogenetic effects (Fig. 3a, Supplementary Table 6). This suggests that a larger core-genome may be important to facilitate persistence and proliferation in multiple habitats. The core-genome of highly ubiquitous species was enriched in genes coding for proteins involved in lipid metabolism and secondary metabolite biosynthesis (COG categories I and Q in Fig. 3b, respectively). This is congruent with earlier studies, suggesting that secondary metabolite biosynthesis might be implicated in adaptation to multiple environments [66].
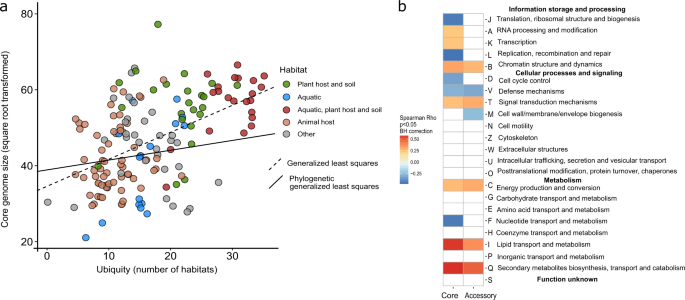
a Species ubiquity (number of habitats a species was assigned to), a habitat feature, is linked to core-genome sizes after correction for phylogenetic effect (Phylogenetic generalized least squares, p value = 0.00005, λ = 0.98 (95% CI 0.957, 0.992), partial R-square (for ubiquity coefficient) 0.09, see also Supplementary Table 6). b Correlation of ubiquity with the relative frequency of functional categories (COG categories assigned by eggNog v4.5 [47]) in core and accessory genomes. Species of high ubiquity tend to encode more proteins involved in lipid metabolism (I) and secondary metabolite biosynthesis (Q).
Dissecting the impact of phylogenetic inertia and environment on pangenome features
Phylogenetic inertia and habitat are thought to have a substantial impact on genome evolution [67, 68], yet to which degree different aspects or features of pangenomes are affected is unknown. Our analysis framework allows us to study these associations in depth. Hence, we quantified differential contributions of phylogenetic and environmental factors to pangenome architecture. Pangenome features were modeled as combinations of the number of conspecific genomes considered, phylogenetic placement, and habitat preference. For this we used an abstract representation of phylogeny and habitats as PCs, accounting for dimensionality, collinearity, and redundancy within these data. The respective relationships were approximated using a linear model (see “Methods”), which allowed us to estimate the variance of pangenome features between species explained by phylogenetic effect and habitat preferences:
$${mathrm{Pangenome}};{mathrm{feature}} =, {mathrm{Number}};{mathrm{of}};{mathrm{genomes}} +, left[ {{mathrm{Genome}};{mathrm{size}};{mathrm{or}};{mathrm{diversity}}} right] , +, 5;{mathrm{phylogenetic}};{mathrm{PCs}} +, 10;{mathrm{habitat}};{mathrm{PCs}}.$$
Together, habitat and phylogenetic effects explained the large parts of the variance (up to 49% by habitat and 18% by phylogenetic effect) in all selected features (Fig. 2b, Supplementary Table 5). This remained true, even when controlling for genome size or core-genome diversity (as evident when these were included in the model as predictors as in the second and third set of stacked charts of Fig. 2b) (Supplementary Table 6). Habitat and phylogeny have considerable independent effects on pangenome features, although the impact of habitat preferences was consistently stronger (Fig. 4). Diversity estimates, in contrast, were explained to a lesser degree by habitat preferences of species and phylogenetic inertia, as they likely reflect spatio-temporal (microevolutionary) variation of subpopulations within-species due to local adaptation and/or genetic drift [28, 69]. For example, a higher fraction of core-genome size (and genome size) variance was explained by species habitat preference than any other pangenome feature (including accessory genome size when considered separately), implying that core-genome size might be linked to a species’ ecology while the accessory genome might often be more affected by random gene acquisition via horizontal gene transfer and loss [70,71,72,73]. The observed signals were robust to technical and annotation noise, as random permutations of habitat and phylogenetic PCs did not exceed the observed data in variance explained (except for genome fluidity (Supplementary Fig. 6)). The strongest phylogenetic effects were observed for average core, pangenome, and genome sizes (confirmed using Pagel’s Lambda estimate to test the strength of the phylogenetic signal [57] (Supplementary Fig. 3). Overall, up to 67% of the variance of different pangenome features was explained by habitat and phylogeny (Figs. 2b and 4). Notably, habitat preferences and phylogenetic inertia affected diversity- and size-based pangenome features differentially (Fig. 2b).
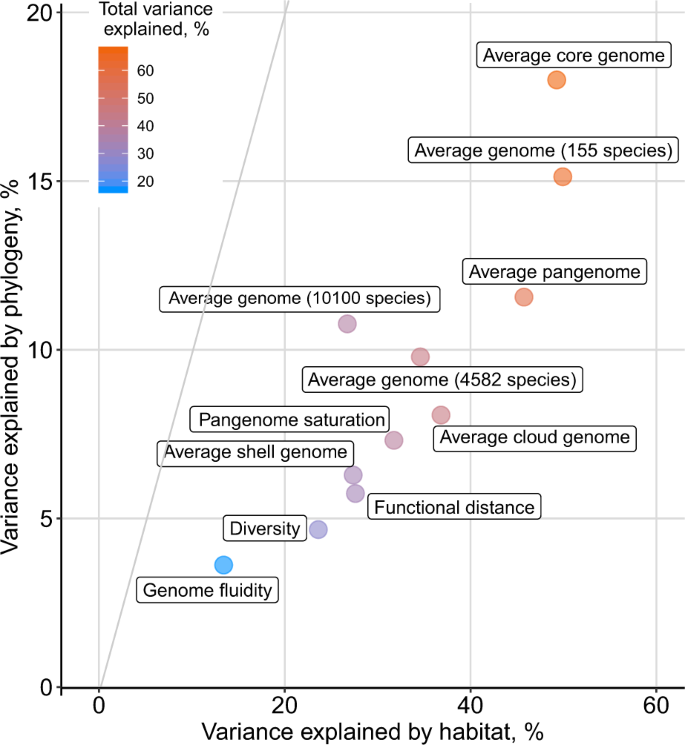
Partitioning of variance in pangenome features explained by phylogenetic inertia and habitat preferences (R-square (car score)) based on model {1} from Fig. 2b.
Due to the required number of genomes of computing pangenomes, species from just ten phyla were part of the pangenome study. To confirm our results on the impact of phylogenetic inertia and habitat preferences on bacterial evolution across a larger phylogenetic range, we used the full proGenomes dataset (4,582 species, ca. 24,000 genomes from 59 phyla, see “Methods” and Supplementary Table 7) and the even larger proGenomes2 dataset (10,100 species, ca. 84,000 genomes from 59 phyla, see “Methods” and Supplementary Table 8). For most species in these datasets only one or a few genomes were available, which did not allow for the computation of pangenomes. Hence, we leveraged our observation that the average genome size of prokaryotic species is strongly correlated to various pangenome features (Fig. 2). In consistence with the pangenome dataset, habitat preference had a much greater effect (Fig. 4; proGenomes: 34.6% variance explained; proGenomes2: 26.7%) than phylogeny (Fig. 4; proGenomes: 9.8% variance explained; proGenomes2: 10.8%). The slightly lower amount of variance explained in the larger datasets might be due to habitat annotation ambiguity and phylogenetic uncertainty. Yet, it confirms that habitat has a larger impact than phylogeny on pangenome architecture (Fig. 3a).
Environment-driven, convergent evolution of pangenome features
To investigate how habitat preferences and phylogenetic inertia impact bacterial evolution in more details, we next analyzed the effects of selected major habitat groups (soil-associated, aquatic, animal-host-associated, and plant-host-associated habitats) on the sizes of genomes/pangenomes and within-species diversity, accounting for their phylogenetic background (Fig. 2a). As expected, soil and plant-host habitats were associated with larger pan and core genomes, while animal host habitats were associated with smaller ones [16, 74]. Aquatic habitats were not a good predictor for size-related pangenome features, which might be indicative of their heterogeneous nature [21, 75]. The distribution of core-genome sizes across the phylogenetic tree of species studied showed that large core genomes have independently evolved (Kruskal–Wallis test, chi-squared = 32.194, df = 1, p value = 1.395e–08) in soil-inhabiting species from at least four (out of ten analyzed) phyla (Proteobacteria, Actinobacteria, Spirochaetes, and Firmicutes, Fig. 5). Small core-genome sizes independently evolved at least three times (Proteobacteria, Actinobacteria, and Firmicutes) in our dataset. Nucleotide diversity of the core-genome was, in contrast to size, less affected by habitat and phylogenetic signals (Fig. 4, Supplementary Fig. 3). Nevertheless, species with a higher nucleotide diversity within their core-genome were positively associated with aquatic habitats (Fig. 5) (Kruskal–Wallis test, chi-squared = 25.69, df = 1, p value = 4.01e–07), in line with earlier observations from metagenomics [18]. In conclusion, core-genome sizes and (to a lesser degree) diversity in prokaryotic species depend on broad habitat type(s) and range, implying that adaptation to a given habitat range might lead to convergent evolution towards habitat-specific core-genome sizes (e.g., soil-associated species have larger genomes, Fig. 5).
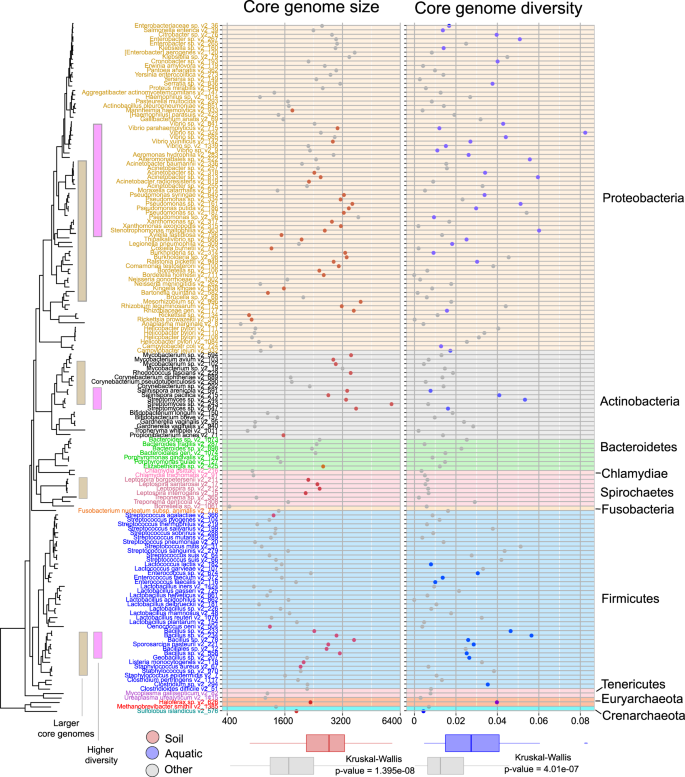
Soil-associated species tend to have larger core genomes (marked in red in the left scatter plot), aquatic species tend to be more diverse (marked in blue in right scatter plot). Tree labels and background of scatter plots are colored by their taxonomic annotations (phylum). Bottom panel: Relationships between habitats and core-genome size and average nucleotide diversity of core genomes.
Source: Ecology - nature.com
