Figure 1 shows the mean and the standard deviation values of logarithms of daily, weekly and monthly E. coli and enterococci concentrations on different sampling times and locations. The datasets were numbered in the sequence they were extracted from the concentration time series. The mean values of logarithms of E. coli concentrations tended to increase downstream. The mean values for the same time scale varied greatly with the measurement period at daily and weekly datasets (Fig. 1). The monthly dataset had a relatively lower variation in the mean values. The mean values of enterococci concentration were substantially lower at TP location compared to the other locations at all time scales. Similar mean values across locations were observed in the monthly datasets.
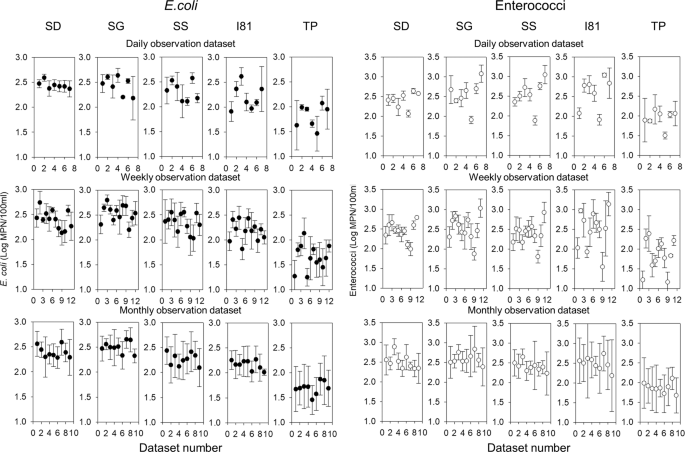
Geometric mean and standard deviation values of logarithms of E. coli and enterococci concentrations for daily, weekly, and monthly observation datasets at monitoring locations TP, I81, SS, SD, and SG.
The supplementary Table 1 shows the probabilities of median logarithms of concentrations being the same in pairs of locations. There were very low (P < 0.001) probabilities that median logarithm concentrations at TP are the same as at any other observation location. Also, low probabilities (<0.01) were found for the median logarithms of E. coli concentrations to be the same in pairs of locations I81-SD and I81-SG. For other location pairs, probabilities of having the same median logarithm E. coli concentrations were larger than 0.01 but remained mostly low. Weekly observations in location pair SD-SG presented the exception, the median logarithm concentrations in these locations were the same with a probability of 0.97. For enterococci, only TP paired with other locations showed a low probability of median concentrations being the same. Larger than 0.1 values of probabilities of having the same median logarithm of enterococci concentration were found for all other pairs of locations. Overall, the enterococci dataset appeared to be more homogeneous along the creek. It is possible that changes in land use along the creek from forest to agricultural use to mixed suburban and agricultural use had less influence on the downstream trend of enterococci.
Standard deviations of the logarithms of indicator concentrations are shown in Fig. 2. The maximum values of the standard deviations were larger for enterococci than for E. coli in all locations for monthly observations. The standard deviations across monitoring locations were mostly not significantly different at the same time scales both for E. coli and enterococci. The TP location presented an exemption, standard deviations were significantly different from other locations except for the SS. Overall, enterococci demonstrated higher variability. Differences between the variability of E. coli and enterococci concentrations may indicate that they are coming to the stream from different sources. These differences may also manifest the differences in survival of the two organisms in various environmental compartments.
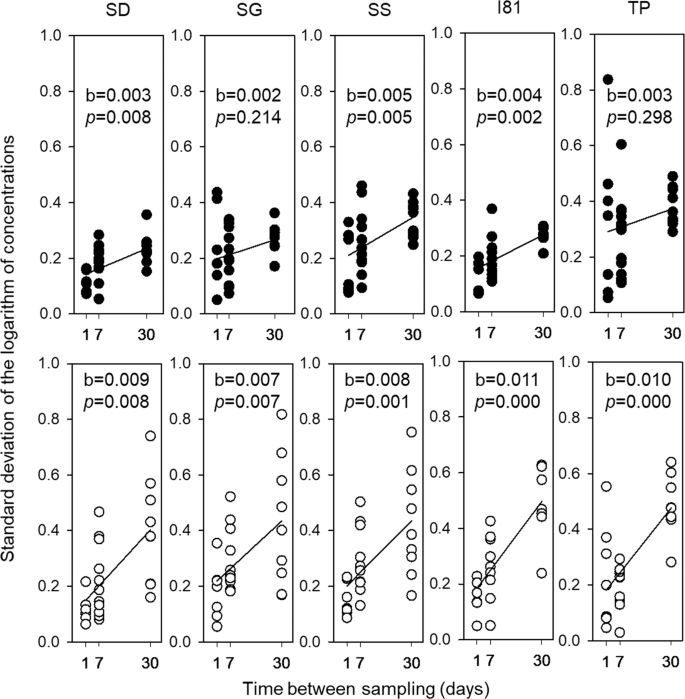
The distribution of standard deviation values and regression slopes of logarithms of E. coli (filled circles) and enterococci concentrations (hollowcircle) according to the different time scales at five monitoring locations. b and p are the slope value and p-value for the regression slope test.
The trend of the increase of the standard deviations with time scale was found for both indicator organisms at all locations (Fig. 2), after a total of 6% and 5% values of standard deviations of logarithms of concentrations were removed as outliers from E. coli and enterococci datasets, respectively. Linear regression equations were developed to quantify this trend. The independent variable was the time between sampling, i.e. 1, 7, and 30 days for weekly, monthly and seasonal time scales respectively. Slopes for E. coli were significantly different from zero at SD, SG and TP locations. The probabilities of slopes being zero at SS and TP locations were larger than 0.05 but still low. Slopes for enterococci were significantly different from zero at all locations.
The slope for E. coli at the TP location was significantly different from other locations except for the SS location, and the slopes at SS and SD locations were not significantly different. The slopes for enterococci did not differ significantly among all the locations.
For the time scale increase from daily to seasonal, values of slopes indicated the increase in standard deviation on average by about 0.1 and 0.2 for log(E. coli) and log(enterococci), respectively (Fig. 2). Several factors might contribute to the increase of the uncertainty in geometric mean concentrations with time scale. Weekly and monthly measurement dates were separated by rainfall events of different intensity. Spatially and temporally variable rainfall events could increase variability in indicator bacteria inputs to water with runoff and from the bottom sediment9,10,11,12. Further increase of time between sampling could also involve changes in sources of fecal indicator bacteria between sampling such as grazing locations, manure application, and wildlife visits. It appears that increase in variability of the geometric mean concentrations with time scale is not large but can be statistically significant and may need to be accounted for if the uncertainty in the geometric mean of concentrations was estimated at the time scale different from the task at hand.
Knowing the uncertainty of geometric means allows one to assess risks of making the incorrect conclusion about the exceeding the regulatory standards on microbial water quality for a water source. It also allows one to define the number of datasets to determine the geometric mean concentration of indicator organisms with the preselected accuracy. Having the estimate of the uncertainty of daily concentration measurements can be useful for calibration of watershed-scale microbial water quality models, that are used, in particular, in mandated Total Maximum Daily Load determinations related to the microbial impairment of surface water sources13. Transferring information about the uncertainty between scales can allow for the more efficient use of existing data collected at specific scales, and for the design of feasible monitoring schedules with subsequent transfer of the variability metrics across the scales.
Source: Ecology - nature.com
