We discuss above results in terms of the impacts both positive and negative by corn production on four capitals, policy drivers, implications for TEEBAgriFood evaluation framework and it’s limitations.
Corn is one of the major crops that contributes significantly to the gross domestic product (GDP) in Minnesota. Minnesota state GDP is about $368 billion, where agriculture contributes about 1.9% ($7 billion annually). Economic contribution from corn also includes other allied goods and services that supply all farm inputs, research, market support, finance and insurance, animal feed and ethanol production. Thus, corn is an important crop for the economy of Minnesota. The GM corn price varies between $150–180 per MT with peak price in 2012 at $333 per MT. These prices are subject to global demand and supply for corn-based animal feed. However, it is important to consider the total contribution of GM corn to the state economy as well as the USA economy. Organic corn prices are always higher than the GM corn at about $190–300 per MT due to its growing demand and low production. In 2012, organic corn price increased to $670 per MT.
The analysis presented here includes all GM corn varieties and does not differentiate GM corn on the basis of differences, such as Ht (herbicide-tolerant), Bt (Bacillus thuringiensis, insect-resistant), and Ht-Bt (stacked) varieties. Out of the total GM corn grown in USA, 80% are stacked gene varieties, 10% Ht varieties and about 10% conventional non-GM, hybrid varieties. There is need to treat transgenic varieties on a case-by-case basis to assess their impact on the environment and health. We have calculated the extent of corn production in an individual’s vicinity using satellite data from USDA which does not allow differentiation based on variety, GM vs. non-GM etc., which would require data linking to locational data on individual farms. For organic farms, we have attempted to do this using data from the USDA’s Agricultural Marketing Service. As organic farms represent a very small proportion of overall production, we do not have a large enough sample of individuals in the Gallup survey data to be able to separate impacts based on proximity to organic vs. non-organic farms. To do so would require a large sample survey data, or US-wide analysis of existing data.
Given higher net returns from organic corn, a greater number of GM corn farmers should convert to organic. However, organic practices are not being widely adopted as is evident from the 0.3% area under organic corn in Minnesota in 2017. There are a number of barriers such as the technology required for weed control, organic seed availability, market, insurance etc., which prevent mass scale conversion to organic farming.
The observed differences between GM and organic corn in production (Table 2) could be due to scale of farms. GM corn is grown on large scale farms, whereas, organic corn is mostly part of mixed farming systems and in rotation with other cereals and pastures (Table S1, Supplementary Information). More than 92% of corn in Minnesota is GM corn, therefore, the data obtained from the databases did not allow to differentiate between GM and conventional corn. However, given the scale of farming, in both GM and conventional corn production systems, it is likely that there are more similarities in terms of productivity and prices. In contrast, organic farms are fewer and are small scale as compared to GM corn farms (Table 1). The differences observed in production could be attributed to the nature of farming system.
There are both formal and informal social networks available to corn growers in Minnesota as summarized in Table 3 that add to the social capital related to agriculture in general and corn systems in particular. Some of these networks provide benefits to individuals such as neighbours, friends etc., while others provide group benefits23. Informal networks between neighbours, friends, grower groups are used to acquire training from others who have already adopted new practices. One example is the cover cropping group, which is a group of farmers that have adopted cover cropping in corn-soybean rotation to improve soil heath. Whereas, formal networks can help obtain assistance to implement various practices through extension activities, participation in conservation programs etc. These networks also help facilitate employment and market opportunities24. However, we did not study the efficacy of these networks in Minnesota. It will be useful to identify those networks that are more promising and effective in bringing positive change in corn production systems and make it financially and environmentally more sustainable.
For the human health cost related to corn systems in Minnesota, we considered official data (Gallup Daily Survey 2008–2017; https://www.gallup.com/home.aspx) that includes general health and disability data. Cancer is the leading cause of death in Minnesota, followed by cardio-vascular diseases, unintentional injury and chronic lower respiratory diseases. The result demonstrates that general health of individuals decreases by 0.67% with corn production in the respective zip code, totalling annual non- financial health costs of corn in Minnesota to $ 1.3 billion. The attribution of causation to individual diseases is highly challenging and whatever scientific studies are considered, results remain debatable. The methodological approach adopted in this study considered health outcomes associated to corn production (i.e., environmental quality) within Minnesota (e.g., not the entire Mississippi drainage basin), thus excluding eventual corn consumption impacts.
For the natural capital impacts of corn, environmental costs associated with production of corn are estimated in this study and do not include environmental costs associated with transport, processing, and consumption. While included variables incorporate most of the key factors that influence the environmental cost of corn production, the inclusion of additional factors or refinement of those evaluations could increase or decrease estimates of the net social cost of conventional corn production. The uncertainty remains high for such estimations. For example, the plausible social costs to drinking water, air quality, and N2O derived climate change, from 1 kg of N fertilizer applications ranged from $0.05 to over $1025. Using the assumptions presented above, the state-wide social cost could range from $19.6 million to $3.9 billion for just those metrics.
The environmental cost varies spatially. For example, production upwind of population centers has greater air quality costs caused by more people being exposed to PM2.5 emissions. Groundwater nitrate contamination risk is heavily influenced by the geology of the region, and the change in water clarity in response to the same amount of P loading varies from lake to lake. For these reasons, applying the costs presented here to other regions will not reflect the local social costs of corn production.
Our analysis does not consider the impacts of production and land use change in a global economic market context, which would require a host of assumptions about market responses and other factors.
Organic practices have a slight negative impact on corn yield. Organic corn has less CO2 emissions than conventional corn but similar N2O and CH4 emissions26. The reduced CO2 emissions come from the lack of synthetic N-fertilizer production. However, if more land is required to meet demand under organic production, land use change could negate these benefits27. The primary difference between the two systems with regards to nitrate leaching is conventional systems typically use synthetic fertilizer, which is more water soluble and can create runoff more easily than manure used in organic systems that is mixed in with the soil28. However, studies have found both that organic systems leach less29 and there is no differences in leaching between conventional and organic systems. More research is required to understand the magnitude of differences in leaching between the systems. The use of manure as a fertilizer source may provide more P than is needed to achieve maximum yields on Minnesota soil. However, no studies quantifying the P export of organic systems were reviewed. The average price of organic corn is higher ($284 per MT for organic versus $182 per MT for conventional in 2010). However, these prices reflect a much lower supply of organic corn relative to conventional (approximately 0.3% of corn production in MN is organic). One study found lower NOx emissions in a no till system compared to tilled system30. Increased tillage required for weed control in organic systems may result in greater NOx and subsequently greater PM2.5 emissions, however, research specifically comparing the precursors to PM2.5 emissions between conventional and organic systems was not found. While soil loss has been studied in conventional tillage and no-till systems, comparisons for conventional and organic were not found. As with air quality, the reliance on tillage for weed control in organic systems could result in more soil loss, but these differences have yet to be quantified.
Organic standards include a limited number of synthetic substances, which are not innocuous but approved by legislators for limited use. The USDA National List of synthetic substances includes materials that are allowed in organic crop production under certain circumstances. The list includes algaecides, disinfectants, sanitizers, irrigation system cleaners, herbicides, animal repellents, insecticides, miticides, pheromones, rodenticides, slug baits, plant disease controls, soil amendments, and plant growth regulators. USDA Organic Standards allow a total of 25 synthetic plant protection products (as compared to 900 for conventional agriculture) to keep farms economically viable in the absence of natural alternatives. Among which copper sulphate is used by many organic farmers. Copper sulphate is used as fungicide in organic orchards and not on organic grains, such as our corn fields. However, there is need to analyse impacts of each chemical in organic systems on health and the environment.
Market forces linked with US federal policy have driven corn production in Minnesota and throughout the Midwest. While corn has been major commodity in the region for decades, recent policy changes to the Farm Bill and the enactment of the Renewable Fuel Standard have protected and incentivized corn production by subsidizing insurance for corn production and mandating production volumes of corn-based ethanol. The US Farm Bill originated in 1930s and is regularly updated to address a wide range issues related to food and agriculture. In 2014, crop insurance subsides were expanded for corn and other crops, reducing the risk producers face from planting commodity crops on marginal land31. Demand for corn was bolstered with the Renewable Fuel Standard, a federal law designed to increase demand for agricultural commodities by mandating production of both corn and cellulosic based ethanol32. While corn production has been sufficient to keep pace with the corn ethanol volumes called for in the law, cellulosic production has not met targets. In addition to increased demand for corn, reductions in funding for the US Conservation Reserve Program have resulted in conversion of hundreds of thousands of acres of retired land to corn production33. These policies contributed to record corn production expansion in the US, both through crop switching and expansion on to marginal land34.
The TEEBAgriFood evaluation framework applied here to corn production is an opportunity to describe and monetize key positive and negative impacts in Minnesota. Although the framework prescribes to capture significant impacts throughout the value chain, it is a challenging task for the researchers to gather and assemble a large amount of data into the framework template to include all aspects of farming systems, society and the environment. Therefore, we focused on the production side of the corn systems only. The analysis does not only focus on quantitative data, it included descriptive information, monetary and non-monetary information, spanning from natural sciences to social and health sciences including economic values. Therefore, a multi-disciplinary team is required to undertake such an assessment.
The assessment is based on existing data and information, which may be a limiting factor in understanding the comprehensive costs and benefits. Access to wide set of resources is required for complete and meaningful assessment that can be used for making policy responses. There are several indicators related to corn production that did not have reliable data or information to be used in this assessment. Current databases are of limited use in terms of the analysis, as they don’t have individualized information about production, area, market prices of different types of varieties, for example, Bt, Ht, stacked, different organic varieties etc.
The framework itself is limited use in terms of comparing two systems, where there is data limitation. This study compared two dominant corn production systems and did not examine other stages of the corn value chain. The framework is useful in assessing macro level data that is required for policy analysis. However, systems level analysis requires much granular data that should include – types of varieties, farming systems, cropping rotations, time period, impacts of all chemicals and practices in different systems etc.
The assessment should not be interpreted as final estimation of all costs and benefits but as a pointer towards significant externalities (including magnitude of their costs to society and economy) that are unwarranted and are the result of current practices and policies. The assessment can be used as a source to review wider impacts of the entire corn value chain in order to modify policies and practices.
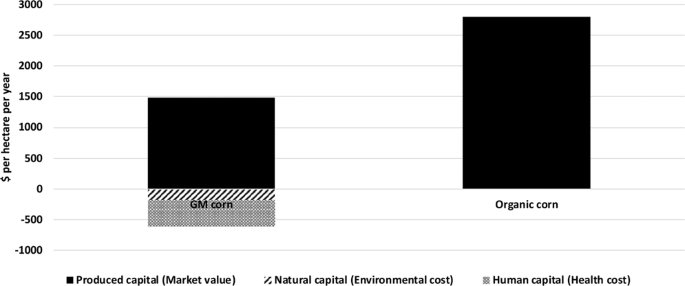
The health costs of corn production are significant as compared to the farmgate value of corn (Fig. 1). However, these are under-estimations of the true cost of corn to human health due to the exclusion of corn consumption and linked health costs, which are not being investigated in the study. Research on health impacts of corn systems provides tentative evidence for a potentially positive effect of organic corn systems, as compared to conventional corn operations. However, more research is required, with finer resolution data than district level data, including detailed locations of survey respondents and planted areas of organic production in order to estimate the health costs of organic corn. Granular data would also facilitate the development of an improved causal framework, affording future research increased confidence in its findings, and offering deeper insights. Expanding the analysis to include other corn-producing states would provide evidence as to whether the negative health effects of corn production hold on a broader scale, and in doing so increase sample size available to researchers.
Source: Ecology - nature.com
