Identification of bulking bacteria in the A2O process train using amplicon sequencing, and their correlation with SVI
Quantities of putative bulking bacteria in the 12 sludge samples after amplicon sequencing are expressed here as relative abundances of each as a percentage of the total number of amplicons. Figure 1 lists the filamentous genera mentioned in the MiDAS database and other published data16,21,22,23,24, although not all of the more abundant populations there should be considered as filamentous organisms. These data show that Kouleothrix was dominant, with a relative abundance of 3.06%, followed by Tetrasphaera sp., “Ca. Defluviifilum”, and Gordonia sp. with percentage relative abundances of 1.11%, 0.88%, and 0.60%, respectively. Figure 1 also shows the results of correlation analysis between SVI and these putative filaments. Only five populations: Kouleothrix, Tetrasphaera sp. “Ca. Defluviifilum”, Gordonia sp., and “Ca. Microthrix” correlated positively (R > 0.63) with statistical significance (p < 0.05).
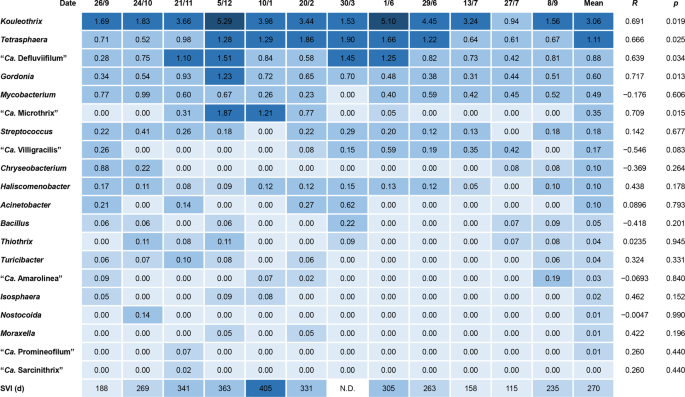
Heat map showing 16S rRNA gene copy number percentage abundances of putative filamentous bacteria in 12 activated sludge samples. R shows correlation coefficients between gene copy ratios and SVI.
To explore what impact the unidentified filamentous populations with amplicon percentage abundances >0.5% of the total abundances (Table S1) might have on SVI values in this community, correlation analysis was performed. Figure 2 shows four (Skagenf80 (“Ca. Saccharibacteria”), Rhodobacter, uncultured Alcaligenaceae, and Terrimonas) with positive and four (Nannocystis, strain mle1-48, unidentified Gammaproteobacteria, and Nitrosomonas) with negative correlations with SVI, at a statistically significant (p < 0.05) level. None of the four genera showing positive correlation has not been reported, possessing filamentous morphotype, but their individual relative mean abundances (0.64%−1.01%) might suggest that they may impact on sludge settleability. On the other hand, the other four genera with negative correlations may assist in improving sludge settleability. Although their individual relative abundances (0.51%–0.87%) were slightly lower than those non-filamentous populations showing a positive correlation, their correlations with SVI were more statistically significant. Thus, three of the four (strain mle1-48, unidentified Gammaproteobacteria, and Nitrosomonas) showed statistical significance (p < 0.01) with high correlation coefficients (<−0.796).
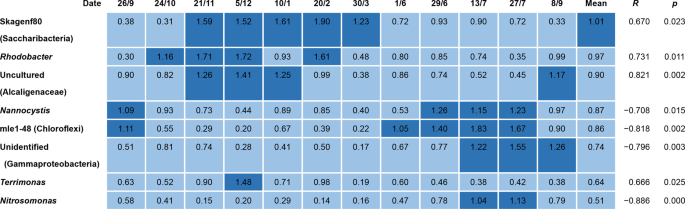
Heat map showing 16S rRNA gene copy percentage abundances of bacterial genera other than those from known putative filamentous bacteria given in Fig. 1, showing correlations with SVI in 12 activated sludge samples from the A2O process train. R shows correlation coefficients between gene copy ratio and SVI in Fig. 1.
FISH analysis of Kouleothrix present in activated sludge samples
To confirm the morphology and location of Kouleothrix (type 1851), the most highly abundant population in the amplicon sequencing data, FISH analyses were performed on samples collected on 5/12/2016, 30/3/2017, 1/6/2017, and 27/7/2017. Figure 3a-d show FISH images of Kouleothrix with the third most abundant filament “Ca. Defluviifilum” (type 0803) (Fig. 1), where light blue and yellow images represent Kouleothrix and “Ca. Defluviifilum”, respectively. The samples show Kouleothrix filaments extending from the surface of flocs to form interfloc bridges (Fig. 3b–d), a pattern typical of bulking sludge25, and occasionally intertwining with those of “Ca. Defluviifilum” filaments (Fig. 3a). Figure 3e-h also show FISH images of Kouleothrix with the second most abundant filament Tetrasphaera (Fig. 1), readily recognizable as T. jenkinsii (Nostocoida limicola II) from its distinctive morphology of coiled and bent filaments with often irregular discoidal cells. Light blue and yellow images represent Kouleothrix and T. jenkinsii, respectively. All samples examined again showed Kouleothrix filaments extending from the surface of flocs, but not to extending around those of T. jenkinsii.
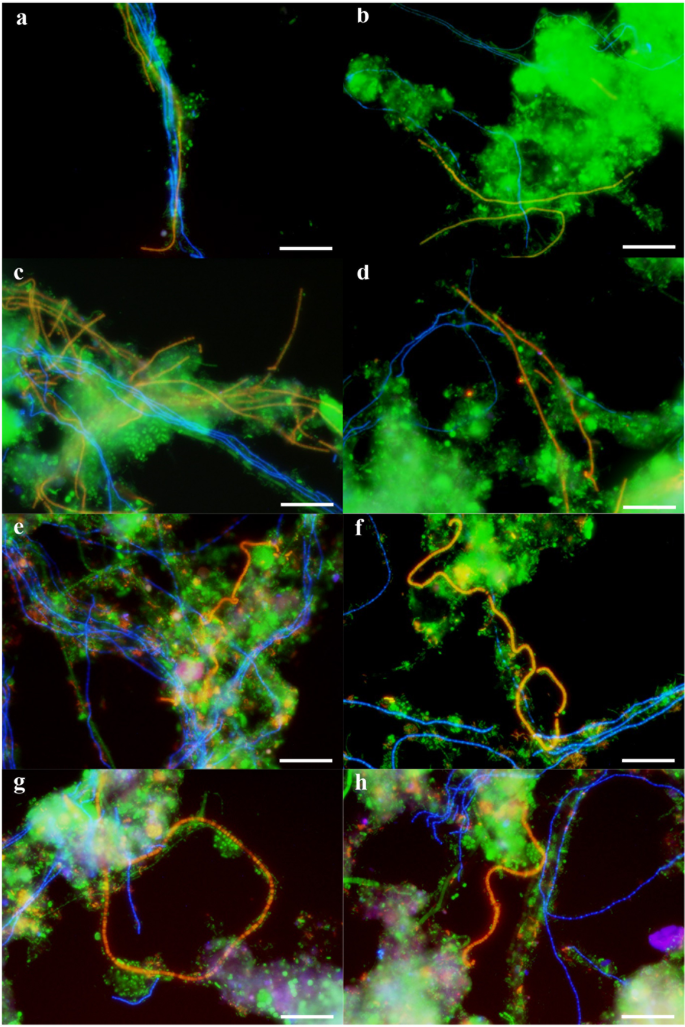
FISH composite images using probes EUBmix (Fluos, green), CHL1851 (Cy5, blue), and T0803-0654 (a–d) or HGC69a (e–h) (Cy3, red) on sludge samples (a,e) 5/12/2016, (b,f) 30/3/2017, (c,g) 1/6/2017, and (d,h) 27/7/2017. Probes CHL1851, T0803-0654, and HGC69a were designed to target Kouleothrix (type 1851), “Ca. Defluviifilum” (type 0803), and Tetrasphaera (Nostocoida limicola II), respectively. Yellow shows merged colors of green and red, and light blue also shows green and blue. Scale bars show 20 µm.
Time course of increase and decrease in Kouleothrix 16S rRNA gene copy number and SVI
Forty-two sludge samples were collected from the A2O train during the one year period and further assayed specifically for Kouleothrix 16S rRNA gene copy number using real-time qPCR. The trends are shown in Fig. 4. The SVI values for the mixed liquors were provided by Yokohama City Government are also plotted (Fig. 4). The data show that Kouleothrix 16S rRNA gene copy number increased markedly from 104 copies ng-DNA−1 to 105 copies ng-DNA−1 between 9/2016 − 1/2017 and then gradually doubled in value between 1/2017–5/2017. From 6/2017, copy numbers decreased rapidly to around 10% of their previous value (i.e., 2.61 × 10⁴ copies ng-DNA−1) until 23/8/2017, when they then increased. As expected, SVI also rapidly increased from 188 to 405 mL g−1 between 9/2016 and 1/2017 and remained at >250 mL g−1 with frequent small oscillations from 1/2017 to 5/2017. The SVI fell to about 100 mL g−1 between 6/2017 and 23/8/2017 and then increased marginally. Thus, changes in the Kouleothrix 16S rRNA gene copy number mirrored changes in the biomass SVI over the whole monitoring period.
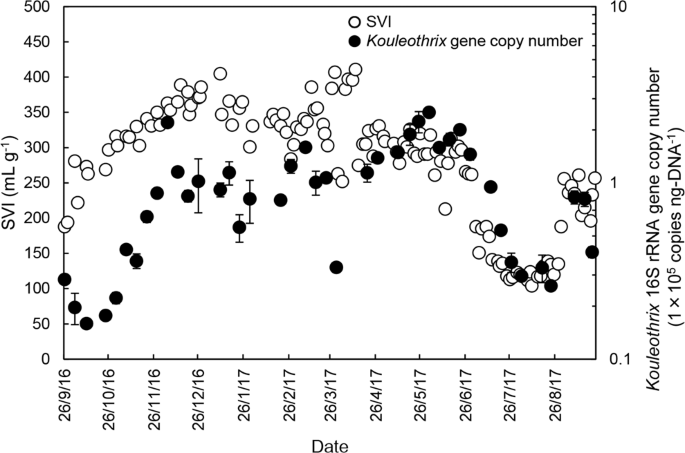
Time course of changes in Kouleothrix gene copy number and SVI. Error bar shows the standard deviation of Kouleothrix gene copy number (n = 3).
Comparisons of amplicon sequencing data (Kouleothrix 16S rRNA gene abundance) and qPCR data (Kouleothrix 16S rRNA gene copy number)
To confirm the relationship between 16S rRNA gene copy numbers of Kouleothrix and its relative percentage abundances values generated by amplicon sequencing, comparisons between them were made (Fig. 5) for the following 12 sludge samples (26/9/2016, 24/10/2016, 21/11/2016, 5/12/2016, 10/1/2017, 20/2/2017, 30/3/2017, 1/6/2017, 29/6/2017, 13/7/2017, 27/7/2017, 8/9/2017) where amplicon sequence dates were available. The data show a positive statistically significant correlation between these two variables (p < 0.001) as follows (Eq. (2)):
$$y=1.73times {10}^{-5}x+1.41$$
(1)
where x is Kouleothrix 16S rRNA gene copy number (copies ng-DNA−1) and y is Kouleothrix 16S rRNA gene relative abundances expressed as percentage of total number of bacterial 16S rRNA gene sequences.
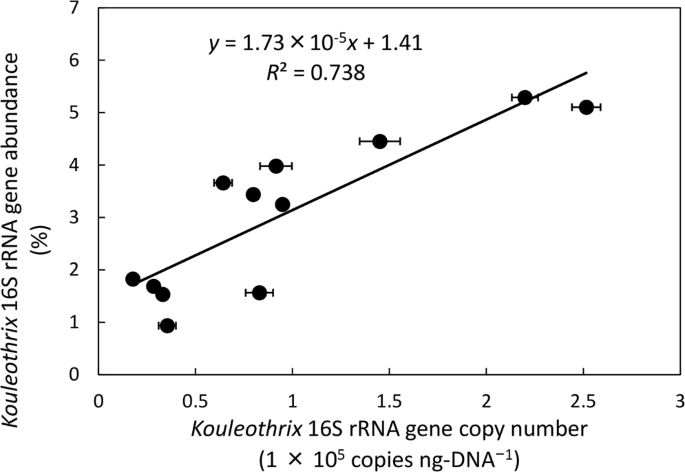
Relationship between Kouleothrix 16S rRNA gene copy number measured by qPCR and Kouleothrix 16S rRNA gene ratio determined by amplicon sequencing. Error bar shows the standard deviation of Kouleothrix gene copy number (n = 3).
Multiple regression analysis of Kouleothrix 16S rRNA gene copy number and operational parameters
To explore which operational factors (Table 1) might affect Kouleothrix abundance, multiple regression analysis was conducted on 22 samples as described in the section “statistical analysis”. Kouleothrix 16S rRNA gene copy numbers and the following process operating parameters, SS, BOD, T-N, and T-P of effluent for the primary settling tank, mixed liquor temperature, pH, MLSS, DO, HRT, and SRT for the aeration tank, and sludge recirculation ratio, and return sludge SS were selected as dependent and independent variables, respectively. Stepwise multiple regression analysis revealed that increases in mixed liquor temperature negatively influenced Kouleothrix gene copy numbers, while SS, SRT, and return sludge SS variables each showed a positive correspondence (Table S2). The final four-variable model was statistically significant (see Table S3) and accounted for approximately 75% of the variance in the dependent variable (R2 = 0.75). The standardized β-coefficients for the measured parameters of temperature, SS, SRT, and return sludge SS were −0.712 (p < 0.01), 0.425 (p < 0.01), 0.568 (p < 0.01), and 0.524 (p < 0.01), respectively. These values clearly indicate that the four parameters contributed significantly to the regression model. The resulting multiple regression equation is as follows (Eq. (2)):
Predicted Kouleothrix gene copy number (copies ng−DNA−1) =
$$begin{array}{cc} & -1.46times {10}^{4},{rm{m}}{rm{i}}{rm{x}}{rm{e}}{rm{d}},{rm{l}}{rm{i}}{rm{q}}{rm{u}}{rm{o}}{rm{r}},{rm{t}}{rm{e}}{rm{m}}{rm{p}}{rm{e}}{rm{r}}{rm{a}}{rm{t}}{rm{u}}{rm{r}}{rm{e}},({}^{circ }{rm{C}})+4.46times {10}^{3},{rm{S}}{rm{S}},({rm{m}}{rm{g}},{{rm{L}}}^{-1}) & + 1.06times {10}^{4},{rm{S}}{rm{R}}{rm{T}}({rm{d}})+,33.5,{rm{r}}{rm{e}}{rm{t}}{rm{u}}{rm{r}}{rm{n}},{rm{s}}{rm{l}}{rm{u}}{rm{d}}{rm{g}}{rm{e}},{rm{S}}{rm{S}},({rm{m}}{rm{g}},{{rm{L}}}^{-1})-2.31times {10}^{4}end{array}$$
(2)
Table S2 also shows the variance inflation factor (VIF) values for temperature, SS, SRT, and return sludge SS, which were determined to be 2.20, 1.12, 1.84, and 1.64, respectively. All values were less than 10, indicating that there was no multicollinearity for these independent variables. These data as expected indicate that, increasing the SS, SRT, and return sludge SS values leads to an increase in the Kouleothrix 16 S rRNA gene copy number, which in turn negatively correlates with the mixed liquor temperature.
Source: Ecology - nature.com
